. 2023 Jan;19(1):28-37.
doi: 10.1038/s41589-022-01145-w. Epub 2022 Sep 15.

Hydropersulfides inhibit lipid peroxidation and ferroptosis by scavenging radicals

Affiliations

Hydropersulfides inhibit lipid peroxidation and ferroptosis by scavenging radicals

Uladzimir Barayeu et al. Nat Chem Biol. 2023 Jan.

Abstract

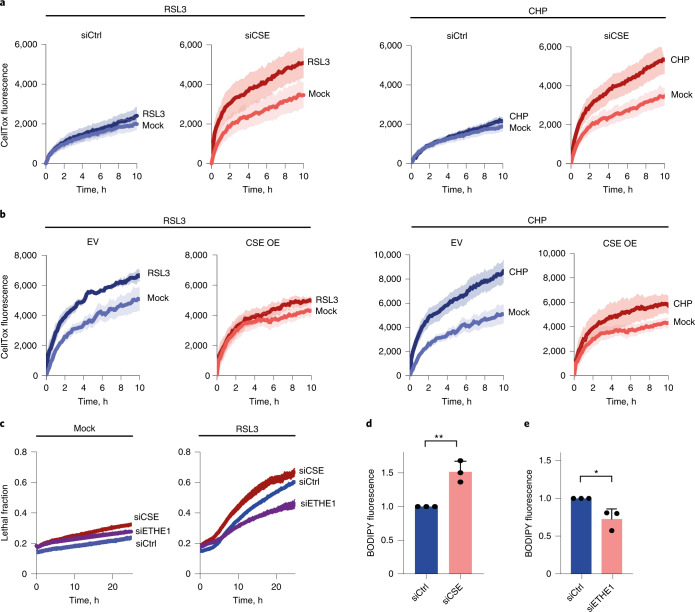
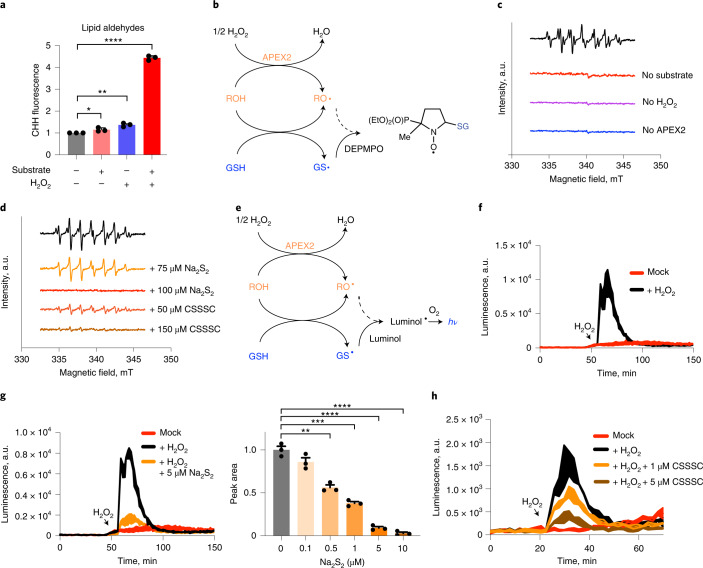
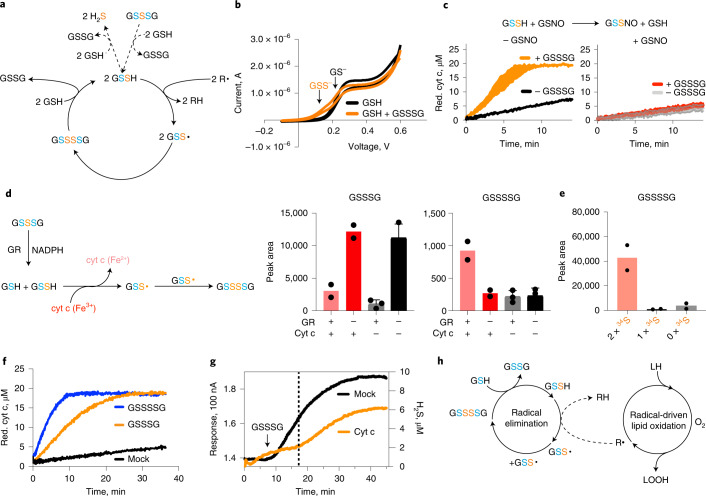
Ferroptosis is a type of cell death caused by radical-driven lipid peroxidation, leading to membrane damage and rupture. Here we show that enzymatically produced sulfane sulfur (S0) species, specifically hydropersulfides, scavenge endogenously generated free radicals and, thereby, suppress lipid peroxidation and ferroptosis. By providing sulfur for S0 biosynthesis, cysteine can support ferroptosis resistance independently of the canonical GPX4 pathway. Our results further suggest that hydropersulfides terminate radical chain reactions through the formation and self-recombination of perthiyl radicals. The autocatalytic regeneration of hydropersulfides may explain why low micromolar concentrations of persulfides suffice to produce potent cytoprotective effects on a background of millimolar concentrations of glutathione. We propose that increased S0 biosynthesis is an adaptive cellular response to radical-driven lipid peroxidation, potentially representing a primordial radical protection system.


Conflict of interest statement

The authors declare no conflicts of interest.

Figures

Fig. 1
Fig. 1. Cys uptake can inhibit ferroptosis independently of GPX4.
a, Pathways by which cellular Cys2 uptake may contribute to ferroptosis resistance. On the one hand, Cys serves the biosynthesis of GSH, which is required by GPX4 to reduce oxidized lipids (upper branch). On the other hand, Cys is a source of S0 species, which may counteract lipid oxidation in a GPX4-independent manner (lower branch). b, S0 levels measured by SSP4 staining 4 hours after treatment of HeLa cells with either RSL3 (5 µM) or CHP (40 µM). n = 3. P = 0.0282 and 0.0500. c, S0 levels measured by SSP4 staining 48 hours after the addition of 4-hydroxytamoxifen (Tam, 0.75 µM) and liproxstatin-1 (Lipr, 1 µM) to Pfa1 cells. n = 3. P = 0.0070 and 0.0377. d, GSSH/GSSSH levels measured by LC–MS 24 hours after the addition of 4-hydroxytamoxifen (Tam, 0.75 µM) to Pfa1 cells. Left panel: n = 3 (mock), n = 5 (Tam), P = 0,0754; right panel: n = 4 (mock), n = 3 (Tam), P = 0.0015. e, Cys levels as measured by LC–MS in Pfa1 and xCT OE cells. n = 5. P = 0.00007. f, GSSH, GSSSH and GSH levels in Pfa1 and xCT OE cells as measured by LC–MS. Left panel: n = 3, P = 0.0251; middle panel: n = 3, P = 0.0504; right panel: n = 4, P = 0.0103. g, Cell viability after 72 hours of incubation with 4-hydroxytamoxifen (Tam, 0.5 µM), measured with an ATP assay (left panel) and a PrestoBlue (reduction capacity) assay (right panel) in Pfa1 and xCT OE cells. Left panel: n = 3, P = 0.00005; right panel: n = 3, P = 0.00004. h, Lipid aldehyde levels in Pfa1 and xCT OE cells, 48 hours after the addition of tamoxifen (Tam, 0.75 µM), as measured by CHH staining. n = 3. P = 0.0157, 0.0370, 0.0404 and 0.0397. Data are presented as mean values. For LC–MS data, error bars represent s.e.m. For the rest, error bars represent s.d. * P ≤ 0.05; ** P ≤ 0.01; *** P ≤ 0.001; and **** P ≤ 0.0001 based on a two-tailed unpaired t-test. OE, overexpressing. Source data
Fig. 2
Fig. 2. S0-generating/degrading enzymes modulate LPO and ferroptosis.
a, Influence of depleting CSE (siCSE) on the loss membrane integrity triggered by treatment of HeLa cells with either RSL3 (5 µM) (left two panels) or CHP (40 µM) (right two panels), as measured by the CellTox Green cytotoxicity assay. n = 3. b, Influence of overexpressing CSE (CSE OE) on the loss of membrane integrity triggered by treatment of HeLa cells with either RSL3 (5 µM) (left two panels) or CHP (40 µM) (right two panels), as measured by the CellTox Green cytotoxicity assay. n = 3. c, Influence of depleting CSE (siCSE) or ETHE1 (siETHE1) on the loss membrane integrity triggered by treatment of HeLa cells with RSL3 (5 µM), as measured by the CellTox Green cytotoxicity assay. Fluorescence is normalized to the lysis control (lethal fraction). n = 3. d, Influence of depleting CSE (siCSE) on the oxidation of BODIPY-C11, as induced by incubation with RSL3 (5 µM) for 4 hours. n = 3. P = 0.0049. e, Influence of depleting ETHE1 (siETHE1) on the oxidation of BODIPY-C11, as induced by incubation with RSL3 (2 µM) for 3 hours. n = 3. P = 0.0236. Data are presented as mean values. For CellTox assays, error bars represent s.e.m. For the rest, error bars represent s.d. * P ≤ 0.05 and ** P ≤ 0.01 based on a two-tailed unpaired t-test. Source data
Fig. 3
Fig. 3. Exogenously supplied S0 eliminates intracellular radicals.
a, Relative lipid aldehyde levels as measured by CHH staining in APEX2-expressing HeLa cells treated with substrate (HPI, 1 mM), H2O2 (100 µM, repeated every hour for 5 hours) or the combination of substrate and H2O2. n = 3. P = 0.0428, 0.0015 and 0.00001. b, Reaction scheme depicting APEX2-dependent generation of phenoxyl (RO•) and glutathionyl (GS•) radicals and their trapping with DEPMPO. c, ESR spectrum of HeLa cells incubated with DEPMPO (50 mM) in the presence of APEX2 expression, substrate (HPI, 1 mM) and H2O2 (1 mM) (upper trace). The lower traces show the spectra obtained when omitting either the substrate or H2O2 or in the absence of APEX2 expression. d, ESR spectrum of APEX2-expressing HeLa cells incubated with DEPMPO (50 mM) in the presence of the substrate (HPI, 1 mM) and H2O2 (1 mM) (upper trace). The lower traces show the influence of pre-treatment with either Na2S2 or CSSSC at the indicated concentrations. e, Reaction scheme depicting APEX2-dependent generation of phenoxyl (RO•) and glutathionyl (GS•) radicals and their further reaction with luminol to trigger light (hv) emission. f, Luminescence profiles recorded from APEX2-expressing HeLa cells in the presence of substrate (HPI, 250 µM) and luminol (250 µM), with or without the addition of H2O2 (50 µM). n = 3. g, Luminescence profiles recorded from APEX2-expressing HeLa cells in the presence of luminol (250 µM), substrate (HPI, 250 µM) and H2O2 (50 µM), with or without the persulfide donor Na2S2 (5 µM) (left panel). Titration of Na2S2 (0.1–10 µM) and quantitation of the area under the luminescence curve (right panel). Right panel: n = 3. P = 0.0012, 0.0002, 0.00004 and 0.00003. h, Luminescence profiles recorded from APEX2-expressing HeLa cells in the presence of luminol (250 µM), substrate (HPI, 250 µM) and H2O2 (50 µM), with or without the persulfide donor CSSSC (1 µM and 5 µM). n = 3. Data are presented as mean values. Error bars represent s.d. * P ≤ 0.05; ** P ≤ 0.01; *** P ≤ 0.001; and **** P ≤ 0.0001 based on a two-tailed unpaired t-test. a.u., arbitrary units. Source data
Fig. 4
Fig. 4. Endogenously produced S0 eliminates intracellular radicals.
a, Selected enzymatic pathways of hydropersulfide (RSSH) formation and elimination. CSE drives RSSH formation primarily through production of H2S, which is oxidized to RSSH by SQR. MPST provides an H2S-independent route to RSSH. Hydropersulfides are degraded by the persulfide dioxygenase ETHE1, which oxidizes S0 to sulfite (SO32−). b, Influence of Na2S (5 µM, substrate for SQR), 3MP (100 µM, substrate for MPST) or Cys (1 mM, substrate for CSE) on the radical load of APEX2-expressing HeLa cells, added 5 minutes before triggering radical generation with luminol, substrate and H2O2 (50 µM). n = 3. P = 0.0011, 0.0011 and 0.0136. cf, Influence of CSE overexpression (c), CSE depletion (d), ETHE1 overexpression (e) and ETHE1 depletion (f) on the luminescence profiles recorded from APEX2-expressing HeLa cells (left panels). Cells were incubated with luminol and substrate (250 µM each), and radical generation was triggered with H2O2 (50 µM). Normalized AUC (right panels). EV, empty vector. n = 4. P = 0.0056 (c). n = 3. P = 0.0009 (d). n = 4. P = 0.0001 (e). n = 4. P = 0.0016 (f). Data are presented as mean values. Error bars represent s.d. * P ≤ 0.05; ** P ≤ 0.01; *** P ≤ 0.001; and **** P ≤ 0.0001 based on a two-tailed unpaired t-test. a.u., arbitrary units; OE, overexpressing. Source data
Fig. 5
Fig. 5. Persulfides are superior radical scavengers.
a, In vitro ESR spectrum of GS• radicals spin trapped in a solution containing DEPMPO (10 mM), GSH (1 mM), APEX2 (1 µM) and H2O2 (100 µM) (left panel). Corresponding ESR spectra obtained by the addition of the indicated concentrations of the persulfide donor GSSSG (right panel). b, Resorufin formation recorded from a mixture of APEX2 (2 µM), Amplex Red (100 µM), GSH (1 mM) and increasing concentrations of GSSSG (left panel). Using an H2O2 calibration curve, the observed inhibition time allows the calculation of the amount of radicals eliminated in the presence of GSSSG (right panel). n = 2. c, Reduction of ferric cytochrome c (cyt c, 24 µM) measured by absorbance at 550 nm in the presence of GSH (1 mM) and the indicated concentrations of GSSSG. n = 2. d, Reduction of TEMPOL (18 mM) measured by absorbance at 430 nm in the presence of GSH (20 mM) and the indicated concentrations of CSSSC. n = 2. a.u., arbitrary units. Source data
Fig. 6
Fig. 6. GSSH catalyzes GSH-dependent radical reduction.
a, Proposed autocatalytic cycle of GSSH-mediated radical elimination. GSSH reduces radicals (R•), in turn forming perthiyl radicals (GSS•). These recombine to form GSSSSG, which is then reduced by GSH to regenerate GSSH. Overall, the cycle couples glutathione oxidation to radical reduction. Potential supply and decay pathways for GSSH are indicated by dotted lines. For example, GSSH can be formed from the persulfide donor GSSSG. In the absence of radicals, GSSH is slowly reduced by GSH, releasing H2S. b, Cyclic voltammetry of a GSH solution with or without the addition of GSSSG. c, Influence of blocking GSSH with the NO donor GSNO. Reduction of ferric cyt c (20 µM) was measured in the presence of GSH (1 mM) and GSSSG (1 µM), and in the presence or absence of GSNO (1 mM). n = 2. d, Reduction of ferric cyt c triggers the formation of GSSSSG. Using GR (1 U ml−1) and NADPH (400 µM), GSSSG (400 µM) is rapidly reduced to GSSH. GSSSSG is specifically formed in the presence of ferric cyt c, thus implicating the formation and recombination of perthiyl radicals. GSSSG and GSSSSG levels were measured by LC–MS (right panel). n = 2 (first two bars) and n = 3 (remaining bars). e, Conversion of singly labeled glutathione trisulfide (GS34SSG) to doubly labeled glutathione tetrasulfide (GS34S34SSG) by the GR/NADPH/cyt c system, as measured by LC–MS. n = 2. f, Acceleration of cyt c reduction by GSSSSG. The reduction of ferric cyt c (20 µM) was measured in the presence of GSH (1 mM) and either GSSSG or GSSSSG (1 µM). n = 2. g, H2S release from the mixture of ferric cyt c (50 µM), GSH (1 mM) and GSSSG (10 µM), as measured with an H2S-selective electrode. The vertical dashed line indicates the timepoint of complete cyt c reduction. n = 2. h, Scheme summarizing the radical chain braking effect of persulfides. Initiating and/or propagating radials (R•) are rapidly reduced by hydropersulfides (GSSH). The resulting perthiyl radicals (GSS•) do not participate in radical chain propagation but, instead, rapidly self-recombine to form GSSSSG, thus permanently removing unpaired electrons from the system. Reduction of GSSSSG regenerates GSSH. Data are presented as mean values. Error bars represent s.d. Source data
Extended Data Fig. 1
Extended Data Fig. 1. Cysteine rescues cells from ferroptosis independently of GPX4.
(A) Relative GSH and GSSH levels in HeLa and Pfa1 cells as measured by LC-MS. n = 4. (B) Flow cytometry of SSP4 stained HeLa cells treated with RSL3 (5 µM) for 4 hours. (C) Flow cytometry of SSP4 stained Pfa1 cells treated with tamoxifen (Tam; 0.75 µM), in the presence or absence of liproxstatin-1 (Lipr; 1 µM), for 48 hours. (D) GSH levels in HeLa cells treated with RSL3 (5 µM) (left panel) and in Pfa1 cells treated with Tam (0.75 µM) for 24 h (right panel), as measured by LC-MS. Left panel: n = 3, p = 0.1379 (mock, RSL3 2 h). n = 5, p = 0.0067 (RSL3 4 h). Right panel: n = 4 (Pfa1), n = 3, p = 0.0014 (Tam). (E) Immunoblotting of xCT, GPX4 and α-actin in Pfa1 and xCT OE cells, 24 h (left panel) or 48 h (right panel) after treatment with Tam (0.75 µM) and/or Lipr (1 µM). (F) Viability of Pfa1 and xCT OE cells after 72 h of incubation with Tam (0.5 µM) and Lipr (1 µM), as measured with an ATP assay (left panel) and a PrestoBlue cell viability assay (right panel). n = 5. (G) Viability of Pfa1 and xCT OE cells after 72 h of incubation with erastin, as measured with an ATP assay. n = 5. (H) Flow cytometry of coumarin hydrazide (CHH) stained Pfa1 and xCT OE cells treated with Tam (0.75 µM) for 48 h. Data are presented as mean values. For LC/MS data error bars represent SEM. For the rest, error bars represent SD, ** P ≤ 0.01 based on a two-tailed unpaired t-test. Source data
Extended Data Fig. 2
Extended Data Fig. 2. CSE knockdown and overexpression.
(A) Loss of viability in HeLa cells treated with CHP (40 µM), in the presence or absence of liproxstatin-1 (Lipr, 20 µM), measured with the CellTox Green cytotoxicity assay. n = 3. (B) Depletion of CSE in HeLa cells, demonstrated by immunoblotting. (C) Influence of depleting CSE (siCSE) on H2S, Cys and GSH levels in HeLa cells, as measured by LC-MS. Left panel: n = 3, p = 0.0143; Middle panel: n = 4, p = 0.3399; Right panel: n = 5, p = 0.0753. (D) Overexpression of CSE in HeLa cells, demonstrated by immunoblotting. (E) Influence of overexpressing CSE (CSE OE) on H2S, Cys and GSH levels in HeLa cells, as measured by LC-MS. EV: empty vector. Left panel: n = 5 (EV), n = 4 (CSE OE), p = 0.0038; Middle panel: n = 3, p = 0.8181; Right panel: n = 5, p = 0.5282. Data are presented as mean values. Error bars represent SEM, * P ≤ 0.05; ** P ≤ 0.01 based on a two-tailed unpaired t-test. Source data
Extended Data Fig. 3
Extended Data Fig. 3. Influence of S0 metabolizing enzymes on membrane integrity.
(A) Influence of CSE depletion on the viability of HeLa cells treated for 24 h with either RSL3 (5 µM) or CHP (40 µM), as measured with an ATP assay. n = 4. p = 0.00003 (RSL3), p = 0.00001 (CHP). (B) Influence of CSE overexpression (OE) on the loss of viability of U2OS cells treated with either RSL3 (5 µM) (left panels) or CHP (40 µM) (right panels), measured with the CellTox Green cytotoxicity assay. Rightmost panel: Influence of CSE overexpression (OE) on the viability of U2OS cells treated for 24 h with either RSL3 (5 µM) or CHP (40 µM), as measured with an ATP assay. EV: empty vector. n = 3. Right panel: n = 4, p = 0.2763 (RSL3); n = 5, p = 0.0029 (CHP). (C) Depletion of ETHE1 in HeLa cells, demonstrated by immunoblotting. (D) Influence of ETHE1 depletion on the loss of viability of HeLa cells treated with either RSL3 (5 µM) (left panels) or CHP (40 µM) (right panels), measured with the CellTox Green cytotoxicity assay. n = 3. (E) Overexpression of ETHE1 in HeLa cells, demonstrated by immunoblotting. (F) Influence of ETHE1 overexpression on the loss of viability of HeLa cells treated with either RSL3 (5 µM) (left panels) or CHP (40 µM) (right panels), measured with the CellTox Green cytotoxicity assay. n = 3. (G) Depletion of SQR in HeLa cells, as demonstrated by fluorescent antibody labeling. (H) Influence of SQR depletion on the loss of viability of HeLa cells treated with either RSL3 (5 µM) (left panels) or CHP (40 µM) (right panels), measured with the CellTox Green cytotoxicity assay. n = 3. Data are presented as mean values. For CellTox assay error bars represent SEM. For the rest, ** P ≤ 0.01; **** P ≤ 0.0001 based on a two-tailed unpaired t-test. Source data
Extended Data Fig. 4
Extended Data Fig. 4. Influence of CSE and ETHE1 depletion on lipid oxidation.
(A) Flow cytometry of BODIPY-C11 stained CSE-depleted HeLa cells following treatment with RSL3 (5 µM) for 4 h (left panel). Lipid aldehyde levels in CSE-depleted HeLa cells following treatment with either RSL3 (5 µM) or CHP (40 µM) for 4 h, as measured by CHH staining (middle panel). Flow cytometry of CHH stained CSE-depleted HeLa cells following treatment with RSL3 (5 µM) for 4 h (right panel). Middle panel: n = 4, p = 0.0101 (RSL3); n = 3, p = 0.05 (CHP). (B) Flow cytometry of BODIPY-C11 stained ETHE1-depleted HeLa cells following treatment with RSL3 (2 µM) for 3 h. Data are presented as mean values. Error bars represent SD, * P ≤ 0.05 based on a two-tailed unpaired t-test. Source data
Extended Data Fig. 5
Extended Data Fig. 5. Exogenously supplied persulfide donors scavenge APEX2-generated intracellular radicals.
(A) Flow cytometry of CHH-stained HeLa cells treated with RSL3 (5 µM) for 4 hours, in the presence or absence of DATS (100 µM) (left panel), and in the presence or absence of CSSSC (100 µM) (right panel). (B) Flow cytometry of CHH stained APEX2 expressing HeLa cells treated with substrate (HPI, 1 mM), H2O2 (100 µM, repeated hourly for 5 h) or with the combination of substrate and H2O2. (C) ESR spectra of DEPMPO-trapped radicals, recorded from HeLa cells expressing APEX2 in either the cytosol (upper left trace) or the mitochondrial matrix (upper right trace), after exposure to HPI (1 mM), H2O2 (1 mM) and DEPMPO (50 mM). Simulated ESR spectra of DEPMPO-trapped radicals (80% GS·, 20% C·) (lower traces), based on the following parameters: DEPMPO-SG·(80 %): giso = 2.00440, aH1 = 15.4 G, aH2 = 0.9 G, ap = 45.9 G, aNO = 14.1 G; DEPMPO-C·(20 %): giso = 2.00420, aH1 = 22.1 G, aH2 = 3 G, ap = 46.1 G, aNO = 14.8 G. Spectra were simulated with MATLAB R2021a using the EasySpin 5.2.33 package. ESR parameters were taken from. (D) GSSH levels in HeLa cells measured by LC-MS after treatment with Na2S2 (50 µM) for 5 min. n = 4 (mock), n = 5 (Na2S2), p = 0.00007. (E) Reaction scheme explaining how APEX2-derived radicals generate luminescence in the presence of luminol. The APEX2 substrate 4-(Imidazol-1-yl)phenol (HPI) is oxidized by APEX2 to generate phenoxyl radicals, which further react with luminol to generate luminol radicals. The oxidation of luminol radicals by O2 leads to the emission of blue light. (F) Luminescence recorded from HeLa cells either expressing or not expressing APEX2, pre-treated for 20 min with luminol and substrate (HPI) (250 µM each), and then exposed to H2O2 (50 µM). n = 3. (G) Area under the luminescence curve obtained for different H2O2 concentrations, using the same conditions as in (F). (H) Area under the luminescence curve after incubating APEX2 expressing HeLa cells with Na2S2 (5 µM) for the indicated times, prior to the addition of H2O2 (50 µM). n = 3. Data are presented as mean values. Error bars represent SD, **** P ≤ 0.0001 based on a two-tailed unpaired t-test. Source data
Extended Data Fig. 6
Extended Data Fig. 6. Endogenously generated persulfides scavenge APEX2-generated intracellular radicals.
(A) Area under the luminescence curve obtained after pretreating APEX2 expressing HeLa cells with the indicated concentrations of Na2S (left panel) or 3MP (right panel) for 5 min before the addition of H2O2 (50 µM). n = 3. p = 0.0451. p = 0.0040. p = 0.0003. (B) Influence of MPST depletion on the luminescence recorded from APEX2-expressing HeLa cells after addition of H2O2 (50 µM) (left panel). Corresponding quantitation of the area under the luminescence curve (right panel). n = 3. p = 0.0198. (C) Influence of CSE overexpression (upper left panel), CSE depletion (upper middle panel), MPST depletion (upper right panel), ETHE1 overexpression (lower left panel), and ETHE1 depletion (lower right panel) on the area under the luminescence curve measured in HeLa cells expressing APEX2 in the mitochondrial matrix. n = 4. p = 0.00004. p = 0.00004. (CSE OE, siCSE); n = 3. p = 0.0435 (siMST); n = 4. p = 0.0474 (ETHE OE); n = 5. p = 0.0001 (siETHE1). Data are presented as mean values. Error bars represent SD, * P ≤ 0.05; ** P ≤ 0.01; *** P ≤ 0.001; **** P ≤ 0.0001 based on a two-tailed unpaired t-test. Source data
Extended Data Fig. 7
Extended Data Fig. 7. Persulfides are superior radical scavengers.
(A) Scheme explaining the autoxidation of Amplex Red (ROH) in the presence of GSH, APEX2 and O2. APEX2-generated phenoxyl radicals (RO·) react with GSH to form glutathionyl radicals (GS·). These react further with GSH and O2 to produce superoxide radicals (O2.-), which dismutate to yield H2O2, in turn driving APEX2 activity. Phenoxyl radicals of Amplex Red disproportionate to form Amplex Red and resorufin. (B) Influence of oxygen partial pressure (1% vs. 21%) on resorufin formation in the presence of APEX2 (2 µM) and Amplex Red (100 µM), with or without GSH (1 mM) (left panel). Influence of DEPMPO (20 mM) on resorufin formation in the presence of APEX2 (2 µM) and Amplex Red (100 µM), with or without GSH (1 mM) (right panel). n = 2. (C) Influence of increasing concentrations of Na2S4 on resorufin formation in the presence of APEX2 (2 µM), Amplex Red (100 µM), GSH (1 mM) and 21% O2 (left panel). The relationship between Na2S2 concentration and inhibition time (left axis) allows quantification of eliminated radicals (right axis), using a calibration curve (right panel). n = 2. (D) Influence of Na2S (10 µM) on resorufin formation in the presence of APEX2 (2 µM), Amplex Red (100 µM), GSH (1 mM) and 21% O2. The influence of Na2S4 (10 µM) is shown for comparison (left panel). The relationship between Na2S concentration and inhibition time, shown in comparison to Na2S4 (right panel). n = 2. Data are presented as mean values. Source data
Extended Data Fig. 8
Extended Data Fig. 8. Persulfides do not inhibit APEX2 or cytochrome c.
(A) APEX2 is not inactivated by polysulfides. APEX2 (2 µM) was incubated with Amplex Red (100 µM), GSH (1 mM), plus/minus Na2S4 (10 µM), for 15 min, while recording resorufin formation (left panel). Next, APEX2 was separated from low molecular weight compounds by gel filtration. The photo shows resorufin remaining in the gel filtration matrix (middle panel). When desalted APEX2 was again incubated with Amplex Red (100 µM) and H2O2 (100 µM) its activity was unaffected by prior exposure to Na2S4. For measurement, samples were diluted 20-fold (right panels). (B) Absorbance spectra of APEX2 (5 µM) in the presence or absence of H2O2 (10 µM) (left panel). Recording of the APEX2 Soret peak (absorbance at 406 nm) from a mixture of APEX2 (5 µM) and H2O2 (10 µM), to which GSH (1 mM) and Na2S4 (10 µM) were added (right panel). (C) Reduction of cyt c (24 µM) over time, in the presence of GSH (1 mM) and the indicated concentrations of Na2S, measured by absorbance at 550 nm. n = 2. (D) Reduction of TEMPOL (18 mM) over time, in the presence of GSH (20 mM), plus/minus CSSSC (100 µM) and plus/minus SOD (10 U/mL), as measured by absorbance at 430 nm. n = 2. Data are presented as mean values. Source data
Extended Data Fig. 9
Extended Data Fig. 9. GSSH catalyzes the reduction of radicals by GSH.
(A) Visualization of the singly occupied molecular orbital in GS· (left panel) and GSS· (right panel). The corresponding spin radical densities are given below the panels. (B) Reduction of cyt c (20 µM) over time, in the presence of GSH (1 mM), plus/minus ascorbate (Asc, 0.5 mM), plus/minus S-nitrosoglutathione (GSNO, 1 mM), measured by absorbance at 550 nm. n = 2. (C) In the presence of radicals, GSSH converts into GSSSSG. We used GR (1 U/mL) plus NADPH (400 µM) to rapidly convert GSSSG (400 µM) into GSSH. By reducing ABTS radicals (400 µM), GSSH converts into perthiyl radicals (GSS·) which in turn recombine to yield GSSSSG (upper panel). Measurement of GSSSG (lower left panel) and GSSSSG levels (lower right panel) by LC-MS. n = 2 (first two bars). n = 3 (remaining bars). (D) Kinetics of GSH-mediated cyt c reduction in the presence of either GSSSG or GSSSSG. n = 2. (E) Reduction of cyt c (50 µM) in the presence of GSH (1 mM) plus/minus GSSSG (10 µM), measured by absorbance at 550 nm. The vertical dashed line indicates the time point of complete cyt c reduction. n = 2. (F) QM calculation of standard state Gibbs free energies (ΔG0) for all reactions in the proposed reaction cycle, shown here for the reduction of tyrosyl radicals (Tyr·). Of note, calculation of ∆G values on the basis of estimated intracellular concentrations would result in negative ∆G values for GSH-mediated reduction steps (first and last steps). Data are presented as mean values. Error bars represent SD. Source data

Comment in

  • A radical way to avoid cell death.
    Fukuto JM. Fukuto JM. Nat Chem Biol. 2023 Jan;19(1):1-2. doi: 10.1038/s41589-022-01174-5. Nat Chem Biol. 2023. PMID: 36280796 No abstract available.

References

    1. Dixon SJ, Stockwell BR. The hallmarks of ferroptosis. Annu. Rev. Cancer Biol. 2019;3:35–54. doi: 10.1146/annurev-cancerbio-030518-055844. - DOI
    1. Ursini F, Maiorino M. Lipid peroxidation and ferroptosis: the role of GSH and GPx4. Free Radic. Biol. Med. 2020;152:175–185. doi: 10.1016/j.freeradbiomed.2020.02.027. - DOI - PubMed
    1. Stockwell BR, et al. Ferroptosis: a regulated cell death nexus linking metabolism, redox biology, and disease. Cell. 2017;171:273–285. doi: 10.1016/j.cell.2017.09.021. - DOI - PMC - PubMed
    1. Doll S, et al. ACSL4 dictates ferroptosis sensitivity by shaping cellular lipid composition. Nat. Chem. Biol. 2017;13:91–98. doi: 10.1038/nchembio.2239. - DOI - PMC - PubMed
    1. Dixon SJ, et al. Ferroptosis: an iron-dependent form of nonapoptotic cell death. Cell. 2012;149:1060–1072. doi: 10.1016/j.cell.2012.03.042. - DOI - PMC - PubMed

Publication types