. 2022 Oct;24(10):1487-1498.
doi: 10.1038/s41556-022-00989-7. Epub 2022 Sep 15.

Single-cell atlas of human liver development reveals pathways directing hepatic cell fates

Affiliations

Single-cell atlas of human liver development reveals pathways directing hepatic cell fates

Brandon T Wesley et al. Nat Cell Biol. 2022 Oct.

Abstract

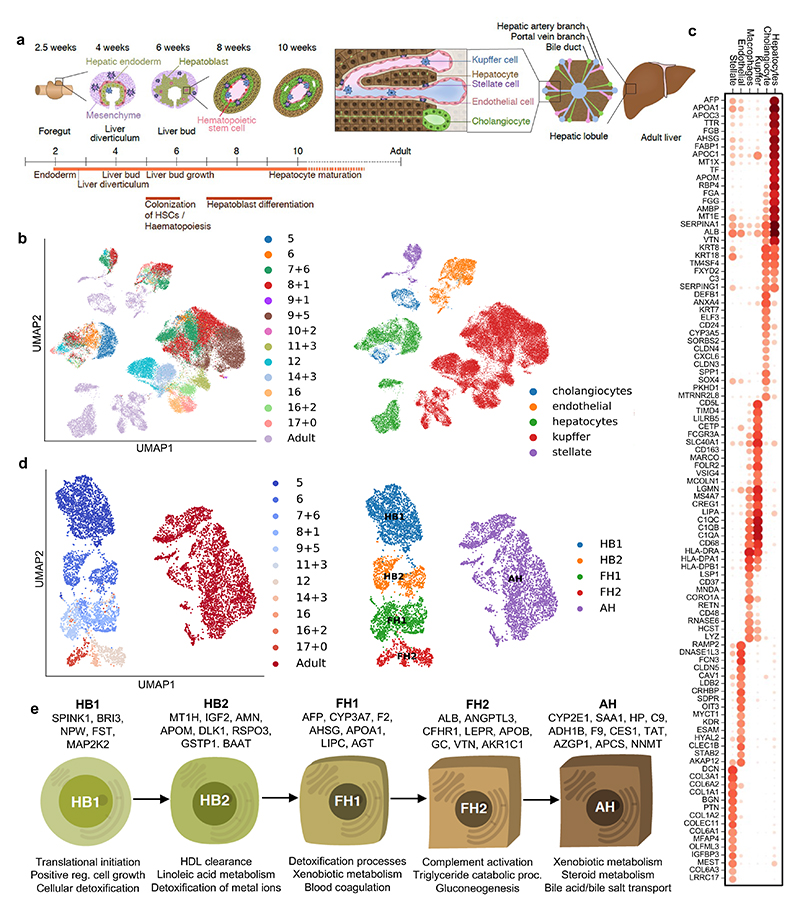
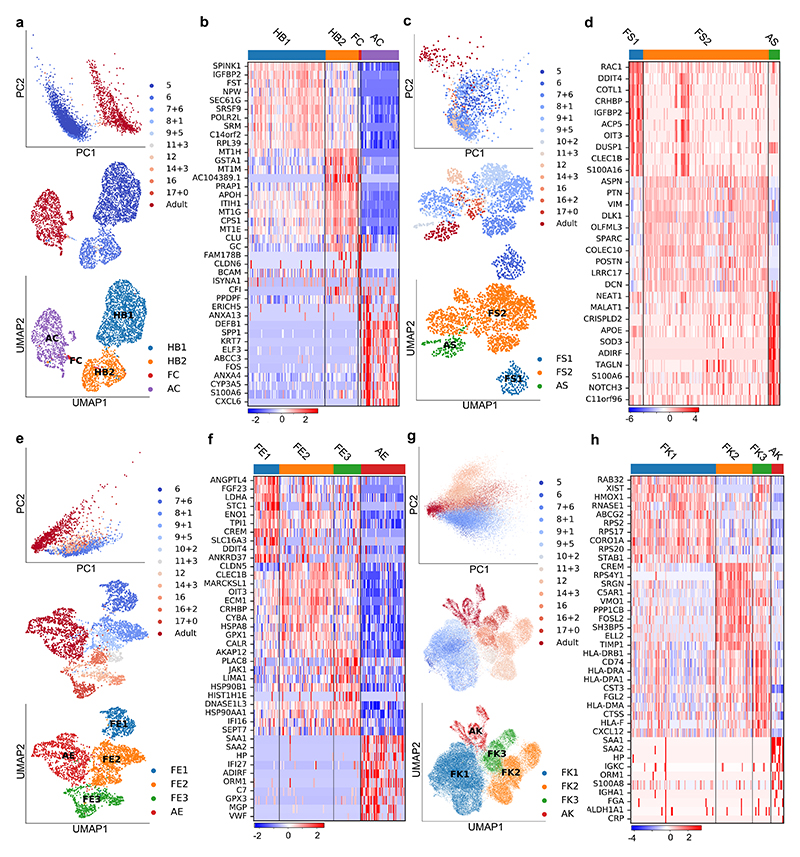
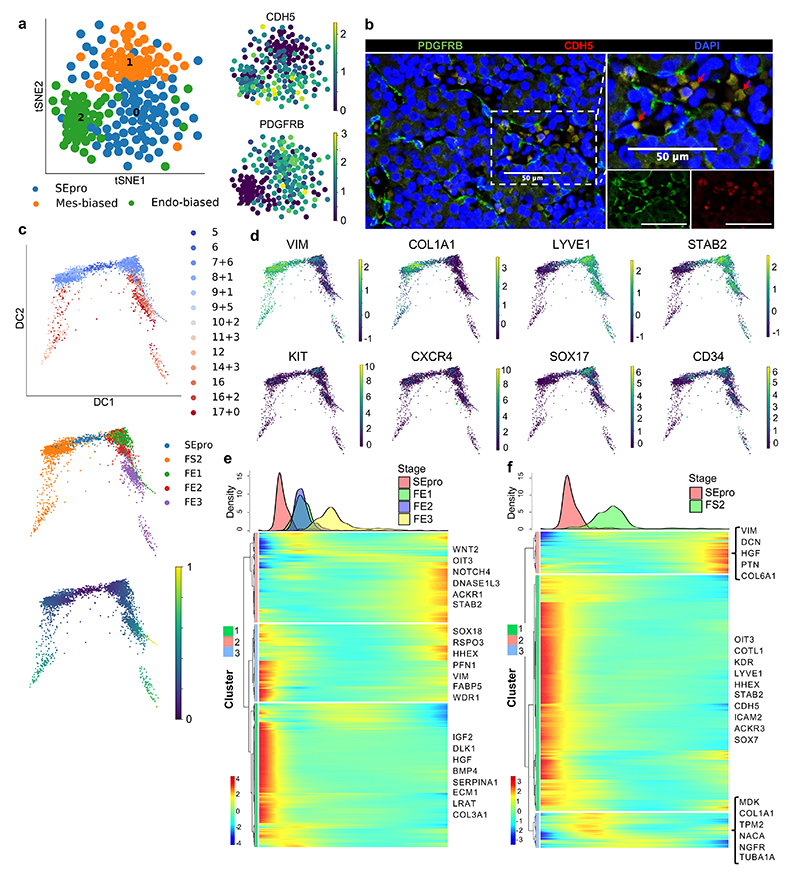
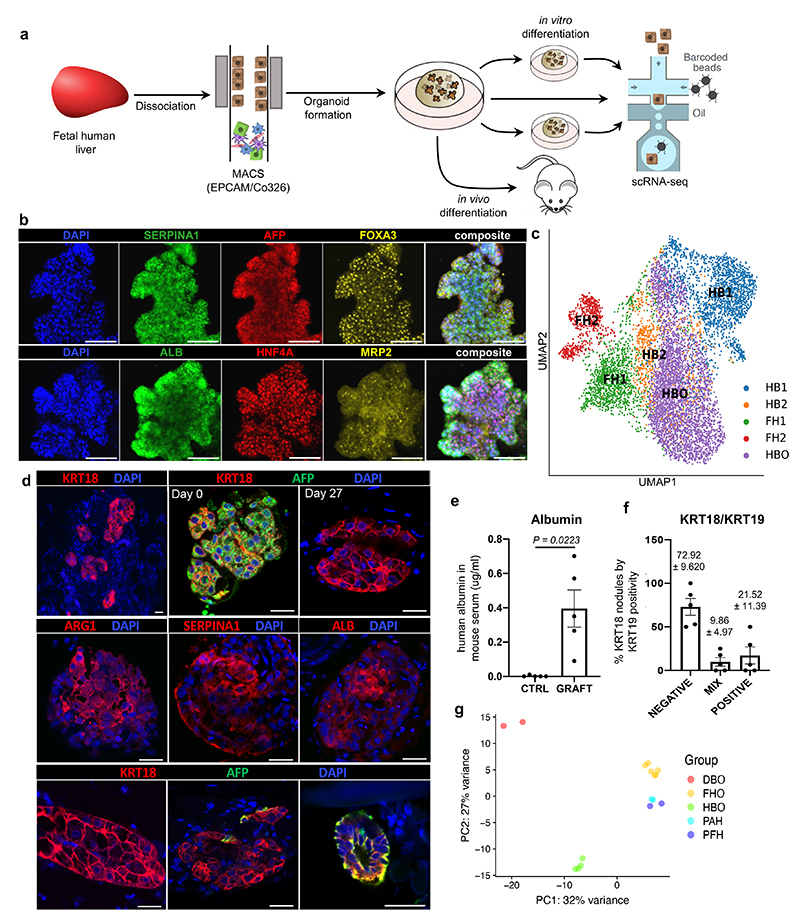
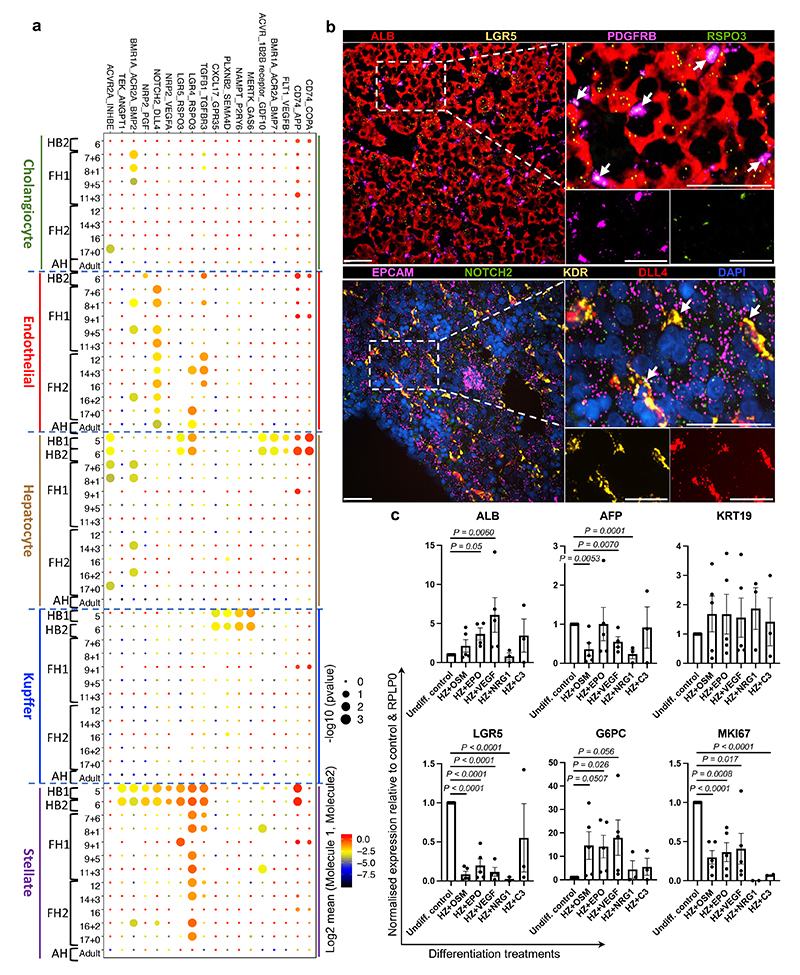
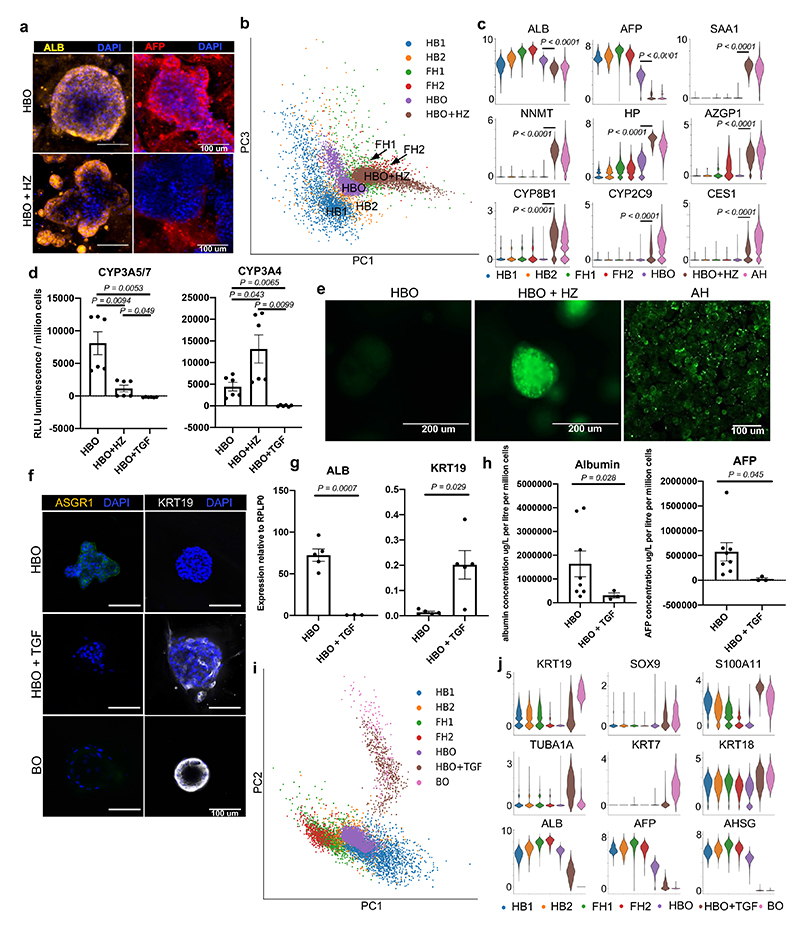
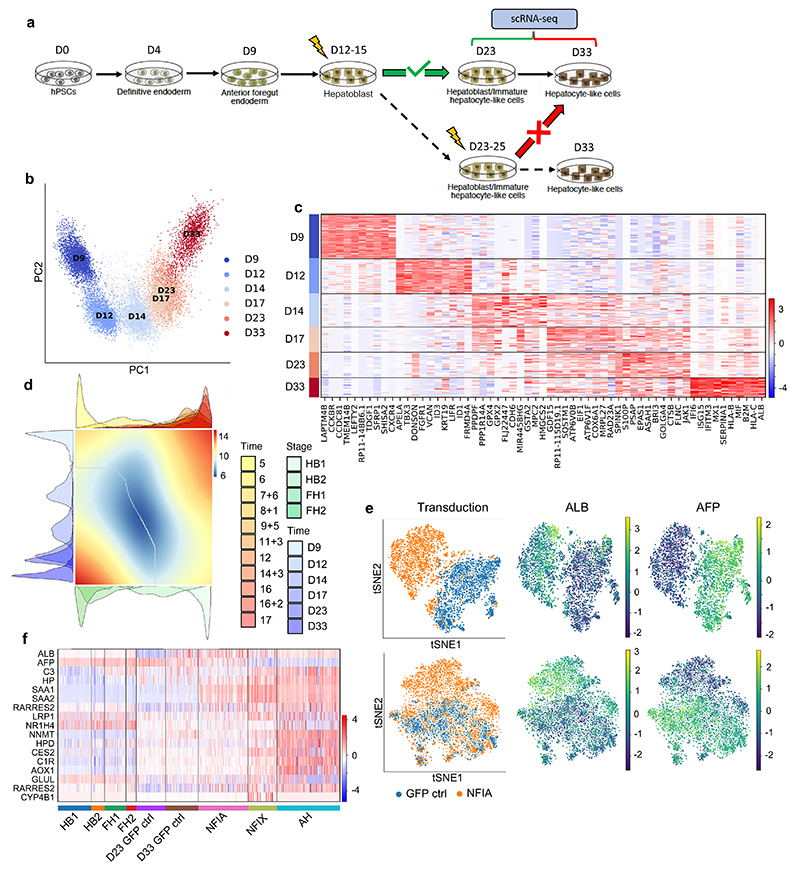
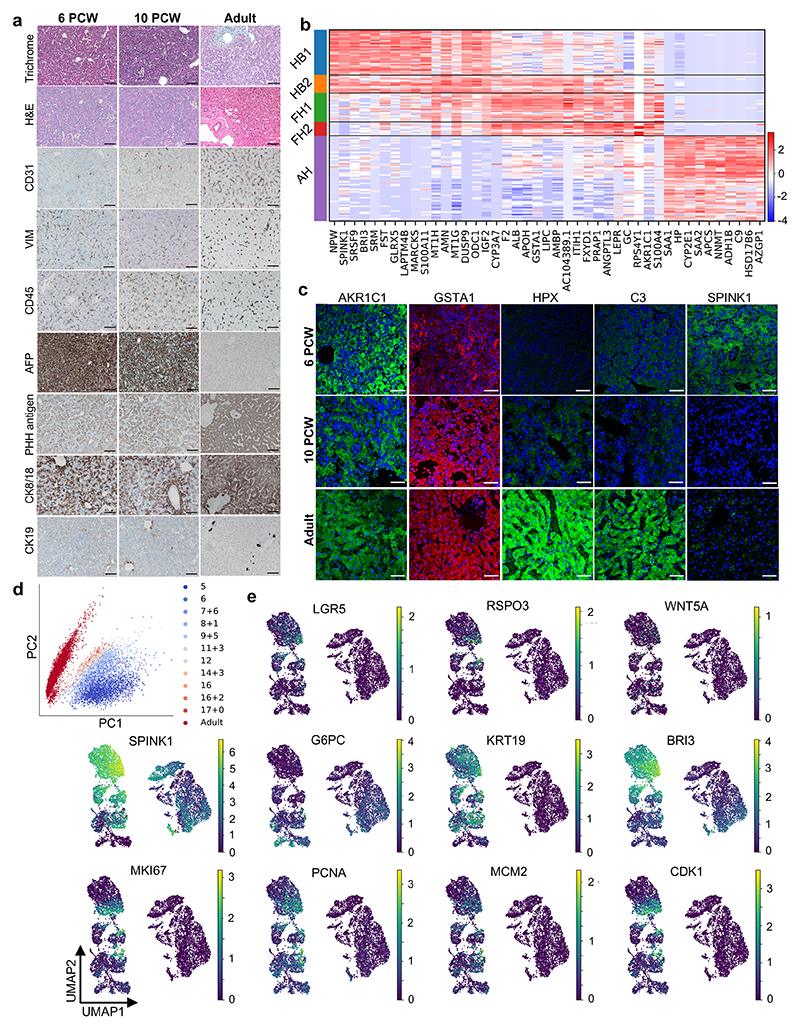
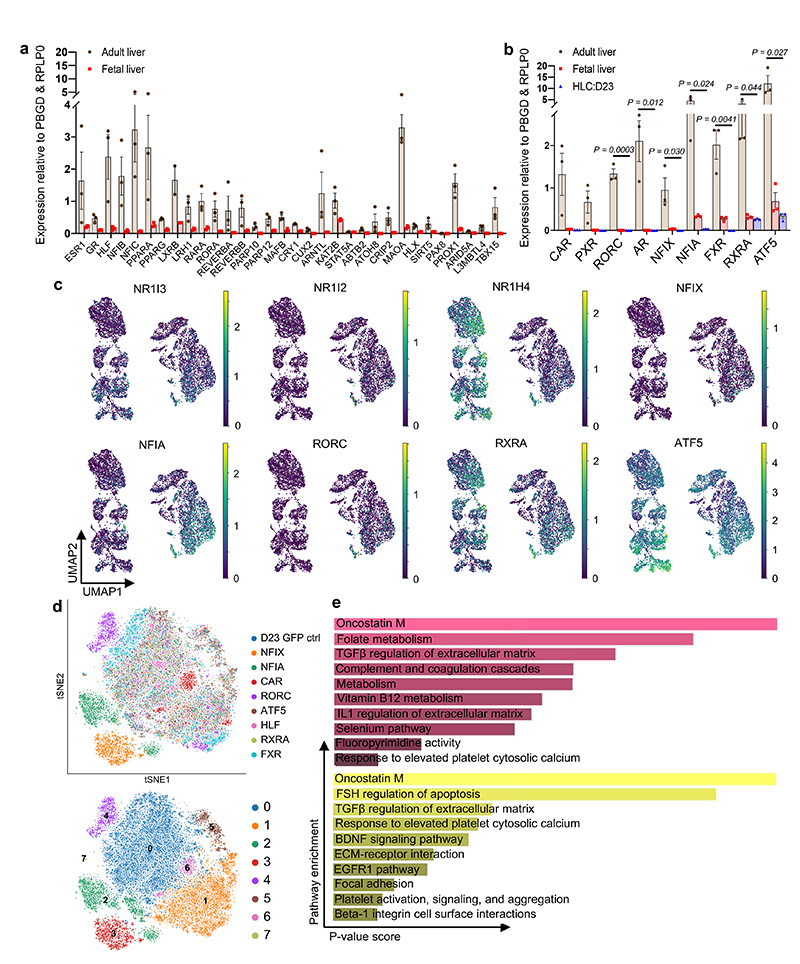
The liver has been studied extensively due to the broad number of diseases affecting its vital functions. However, therapeutic advances have been hampered by the lack of knowledge concerning human hepatic development. Here, we addressed this limitation by describing the developmental trajectories of different cell types that make up the human liver at single-cell resolution. These transcriptomic analyses revealed that sequential cell-to-cell interactions direct functional maturation of hepatocytes, with non-parenchymal cells playing essential roles during organogenesis. We utilized this information to derive bipotential hepatoblast organoids and then exploited this model system to validate the importance of signalling pathways in hepatocyte and cholangiocyte specification. Further insights into hepatic maturation also enabled the identification of stage-specific transcription factors to improve the functionality of hepatocyte-like cells generated from human pluripotent stem cells. Thus, our study establishes a platform to investigate the basic mechanisms directing human liver development and to produce cell types for clinical applications.


Conflict of interest statement

Competing interests

All authors declare no competing interests.

Figures

Fig. 1
Fig. 1. Single-cell transcriptomic map of human liver development.
a, Schematic representation of human liver development. b, UMAP visualization of all integrated single-cell transcriptomic data of fetal and adult human hepatic cells generated using the 10x Genomics workflow; annotation indicates post-conceptional weeks (PCW) + days (left panel) and the cell-specific lineages (right panel). c, Gene expression values of selected differentially expressed genes (DEGs) for each hepatic cell lineages. Gene-expression frequency (fraction of cells within each cell type expressing the gene) is indicated by dot size and level of expression by colour intensity; colour intensity shows “gene expression [mean-scaled, log-normalized counts]”. d, UMAP visualization of hepatocyte developmental trajectory (left panel) and annotation of developmental stages based on Louvain analysis (right panel): HB1, hepatoblast stage 1; HB2, hepatoblast stage 2; FH1, fetal hepatocyte stage 1; FH2, fetal hepatocyte stage 2; AH, adult hepatocyte. e, Characteristic genes induced at each stage of hepatocyte differentiation and corresponding gene ontology (GO). Plots integrate scRNA-seq data from n=17 independent fetal livers aged 5-17 PCW and n=16 independent adult livers.
Fig. 2
Fig. 2. Mapping nonparenchymal cell identity during human liver development.
a, PCA (top) and UMAP (middle) plots of primary human cholangiocyte sample timepoints and UMAP annotation of discrete cholangiocyte developmental stages (bottom); HB1 = hepatoblast 1, HB2 = hepatoblast 2, FC = fetal cholangiocyte, AC = adult cholangiocyte. b, Heatmap showing time-related DEGs of each stage of primary cholangiocyte development. c, PCA (top) and UMAP (middle) plots of primary human hepatic stellate cell sample timepoints and UMAP annotation of discrete stellate cell developmental stages (bottom); FS1 = fetal stellate cell 1, FS2 = fetal stellate cell 2, AS = adult stellate cell. These three developmental stages correlate with the onset of haematopoietic function of the liver and birth. d, Heatmap showing time-related DEGs of each stage of primary hepatic stellate cell development. e, PCA (top) and UMAP (middle) plots of primary human endothelial cell sample timepoints and UMAP annotation of discrete endothelial cell developmental stages (bottom); FE1 = fetal endothelial cell 1, FE2 = fetal endothelial cell 2, FE3 = fetal endothelial cell 3, AE = adult endothelial cell. f, Heatmap showing time-related DEGs of each stage of primary endothelial cell development. Endothelial cells are closely associated with haematopoietic stem cell differentiation, with changes of function associated with haematopoietic and vascularization events. g, PCA (top) and UMAP (middle) plots of primary human Kupffer cell sample timepoints and UMAP annotation of discrete Kupffer cell developmental stages (bottom); FK1 = fetal Kupffer cell 1, FK2 = fetal Kupffer cell 2, FK3 = fetal Kupffer cell 3, AK = adult Kupffer cell. h, Heatmap showing time-related DEGs specific to each stage of primary Kupffer cell development. Heatmap colour scales show “gene expression [mean-scaled, log-normalized counts]”. Plots integrate scRNA-seq data from n=17 independent fetal livers aged 5-17 PCW and n=16 independent adult livers.
Fig. 3
Fig. 3. Identification of a hepatic stellate and endothelial cell progenitor in the early fetal liver.
a, tSNE visualization based on Louvain clustering of 6 PCW human fetal liver cells identifying stellate-endothelial progenitors or “SEpro” (left panel). Gene expression tSNE plots show the co-expression of specific markers for both hepatic stellate and endothelial lineages by SEpros (right panel) (n=3 independent fetal livers). b, Immunofluorescence staining of 6 PCW human liver identifying the SEpro population based on co-expression of stellate (PDGFRB) and endothelial (CDH5) markers; scale bars = 50 um. c, Diffusion pseudotime analyses of stellate and endothelial cells developmental trajectories showing that each lineage originated from SEpro (integrated scRNA-seq data from n=17 independent fetal livers aged 5-17 PCW). d, Diffusion pseudotime analyses of specific markers for each lineage (top row stellate cells, bottom row endothelial cells). e, Heatmap of time-related genes during fetal endothelial cell development and f, fetal hepatic stellate cell development starting with SEpro and progressing toward 17 PCW. Dpt pseudotime colour scale shows “geodesic distance [distance between nodes]”; heatmap colour scale shows “gene expression [mean-scaled, log-normalized counts]”.
Fig. 4
Fig. 4. Modelling early hepatic development in vitro using hepatoblast organoids.
a, Schematic representation of hepatoblast organoid (HBO) derivation and subsequent analyses. b, Immunostaining of hepatoblast markers in HBO grown in vitro; scale bars = 100 um. c, UMAP visualisation of fetal hepatoblast/hepatocyte differentiation stages along with HBO, confirming that HBO share the transcriptional profile of the HB2 stage of hepatocyte development. d, Immunostaining showing decrease of the fetal hepatocyte marker (AFP) in HBO after 27 days of engraftment while hepatocyte markers (KRT18, ALB, ARG1, and SERPINA1) were maintained, indicative of differentiation into mature hepatocytes. Immunostaining for biliary markers identified KRT19-positive cells in a subset of nodules, which organised into bile duct-like structures. Unless otherwise stated, pictures show grafts 27 days post-transplantation; scale bars = 20 um. e, ELISA analyses showing secretion human ALB in the serum of HBO recipient mice 27 days after engraftment (n=5 independent animals). f, Quantification (percentage) of KRT19-positive cells within KRT18-positive nodules. g, Principal component analysis (PCA) showing the divergence in gene expression profile between hepatoblast organoids (HBO; n=4 lines derived from 4 independent fetal livers), differentiated biliary organoids (DBO; n=2), fetal hepatocyte organoids (FHO; n=6), primary adult hepatocytes (PAH; n=2), and primary fetal liver (PFH; n=2). Data are presented as mean values +/- SEM; unpaired two-tailed t-tests.
Fig. 5
Fig. 5. Cell-to-cell interaction networks during human liver development.
a, CellphoneDB analysis of the receptor-ligand interactions of hepatocytes with other hepatic cells across all developmental timepoints. Y-axis shows ligand-receptor/receptor-ligand interactions, with the hepatocyte protein listed first in each pairing; x-axis shows developmental timeline of each cell type; dot colour signifies log2 mean expression of interacting molecules and dot size shows -log10(P) significance (integrated scRNA-seq data from n=17 independent fetal livers ranging in age from 5 to 17 post-conceptional weeks; n=16 independent adult livers). b, RNAscope validating ligand-receptor interactions that establish the hepatoblast niche in 6 PCW liver. RSPO3 is expressed in hepatic stellate cells and its LGR5 receptor is expressed by hepatoblasts (top panels). DLL4 is expressed by endothelial cells while NOTCH2 receptor is expressed on hepatoblasts (bottom panels); scale bars = 50 um. c, Quantitative PCR showing the expression of hepatocyte maturation genes following treatment with key signalling molecules discovered using the single-cell liver development atlas (n=5 independent experimental replicates); Undiff. control = HBO grown in upkeep culture conditions to maintain their self-renewal capacity, HZ = HepatoZYME basal medium. Data are presented as mean values +/- SEM; unpaired two-tailed t-tests.
Fig. 6
Fig. 6. Characterisation of the differentiation capacity of hepatoblast organoids into both hepatocyte and cholangiocyte mature lineages.
a, Immunostaining showing that HBO differentiated into hepatocytes (HBO+HZ) maintain expression of ALB while losing the fetal marker AFP; scale bars = 100 um. b, PCA showing that HBO differentiation in vitro follows the developmental trajectory of fetal primary hepatocyte development. c, Violin plots of key functional markers corresponding to the acquisition of an adult hepatocyte phenotype after HBO differentiation. d, Cytochrome P450 3A5/7 and cytochrome P450 3A4 activity in HBO, HBO+HZ, and HBO treated with TGFB (HBO+TGF) (n=6 independent experimental replicates using lines derived from 2 independent fetal livers). e, BODIPY assay showing differences in lipid uptake in HBO compared to HBO + HZ and primary adult hepatocytes (PAH). f, Immunocytochemistry of HBO, HBO+TGF, and BO stained for KRT19 and ASGR1; scale bars = 100 um. g, QPCR analyses showing the expression of denoted genes in HBO and HBO+TGF (n=5, each point represents an HBO line derived from a unique primary fetal liver). h, ELISA analyses showing the concentration of protein in media secreted by HBO (n=8, each line derived from an independent fetal liver), and HBO treated with TGFB (n=3) after 48 hours of freshly applied medium. Values are normalised to cell number (i.e. per million cells) with albumin as micrograms per litre, and alpha-fetoprotein as units per ml. i, PCA plot of scRNA-seq data comparing the in vitro differentiation of HBO toward cholangiocytes (HBO+TGF) to adult biliary organoids and in vivo differentiation of hepatoblasts. j, ScRNA-seq violin plots showing the loss of hepatocyte functional genes and the acquisition of a biliary transcriptome, thus demonstrating the similarity of HBO+TGF cholangiocytes to the positive biliary organoid control. Data are presented as mean values +/- SEM; unpaired two-tailed t-tests.
Fig. 7
Fig. 7. Temporal overexpression of key transcription factors in hPSC-derived hepatocytes increases their similarity to adult primary hepatocytes.
a, Schematic representation of experimental processes to validate the functional transcription factors in hepatocyte differentiation. b, PCA showing the step-by-step differentiation of hPSCs into hepatocytes. D: day of differentiation (n=6 sequential differentiation timepoints, with one replicate sequenced per timepoint). c, Heatmap of top 10 differentially expressed genes (DEG) specific between each stage of differentiation; Wilcoxon-Rank-Sum test, z-score>10. d, Alignment of primary hepatocyte developmental trajectory to hiPSC differentiation using the CellAlign software; red colour shows regions of misalignment/dissimilarity, blue colour shows regions of close alignment/similarity (integrated scRNA-seq data from n=17 independent fetal livers ranging in age from 5 to 17 post-conceptional weeks and n=16 independent adult livers). e, UMAP visualization of HLCs transduced with transcription factors NFIX, NFIA and GFP (control) showing that TFs can increase ALB expression while decreasing the expression of the fetal marker AFP. f, Heatmap showing the acquisition of functional hepatocytes markers in transduced hepatocytes derived from hPSCs (n=1 sample sequenced per transduction). Heatmap colour scales show “gene expression [mean-scaled, log-normalized counts]”.
None
None
None
None
None
None
None

References

    1. Bilzer M, Roggel F, Gerbes AL. Role of Kupffer cells in host defense and liver disease. Liver Int. 2006;26:1175–1186. - PubMed
    1. Asahina K, et al. Mesenchymal origin of hepatic stellate cells, submesothelial cells, and perivascular mesenchymal cells during mouse liver development. Hepatology. 2009;49:998–1011. doi: 10.1002/hep.22721. - DOI - PMC - PubMed
    1. Maroni L, et al. Functional and structural features of cholangiocytes in health and disease. Cell Mol Gastroenterol Hepatol. 2015;1:368–380. doi: 10.1016/j.jcmgh.2015.05.005. - DOI - PMC - PubMed
    1. Raven A, et al. Cholangiocytes act as facultative liver stem cells during impaired hepatocyte regeneration. Nature. 2017;547 doi: 10.1038/nature23015. - DOI - PMC - PubMed
    1. Lu W-Y, et al. Hepatic progenitor cells of biliary origin with liver repopulation capacity. Nat Cell Biol. 2015;17:971–983. doi: 10.1038/ncb3203. - DOI - PMC - PubMed

Publication types

Substances

LinkOut - more resources