. 2022 Oct;24(10):1461-1474.
doi: 10.1038/s41556-022-00991-z. Epub 2022 Sep 15.

An intercellular transfer of telomeres rescues T cells from senescence and promotes long-term immunological memory

Affiliations

An intercellular transfer of telomeres rescues T cells from senescence and promotes long-term immunological memory

Alessio Lanna et al. Nat Cell Biol. 2022 Oct.

Abstract

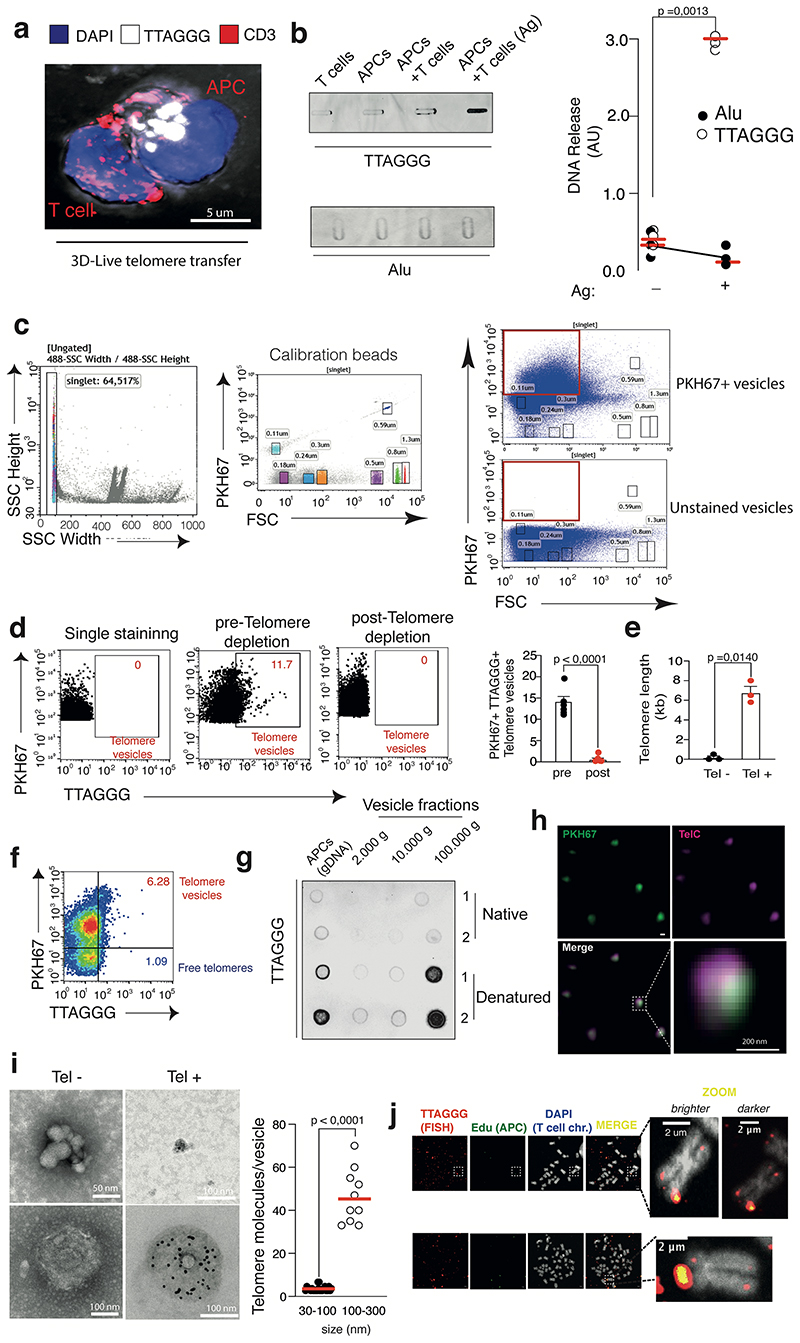
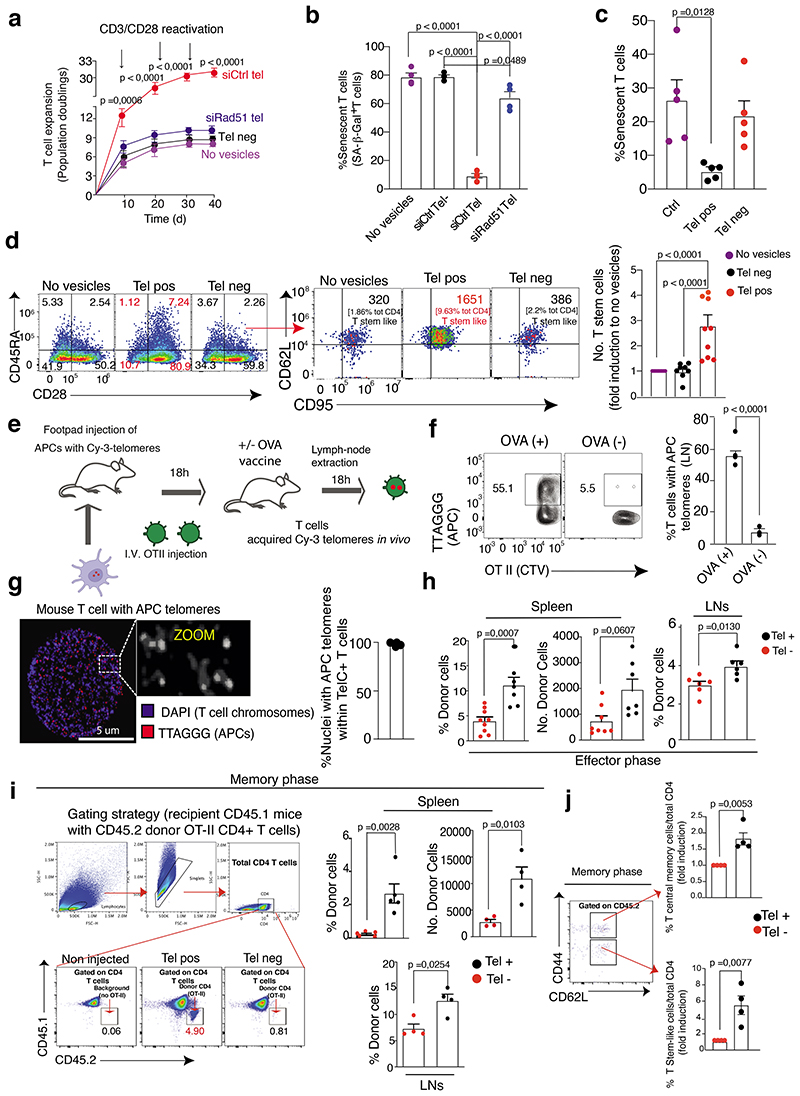
The common view is that T lymphocytes activate telomerase to delay senescence. Here we show that some T cells (primarily naïve and central memory cells) elongated telomeres by acquiring telomere vesicles from antigen-presenting cells (APCs) independently of telomerase action. Upon contact with these T cells, APCs degraded shelterin to donate telomeres, which were cleaved by the telomere trimming factor TZAP, and then transferred in extracellular vesicles at the immunological synapse. Telomere vesicles retained the Rad51 recombination factor that enabled telomere fusion with T-cell chromosome ends lengthening them by an average of ~3,000 base pairs. Thus, there are antigen-specific populations of T cells whose ageing fate decisions are based on telomere vesicle transfer upon initial contact with APCs. These telomere-acquiring T cells are protected from senescence before clonal division begins, conferring long-lasting immune protection.


Figures

Extended Data Fig. 1
Extended Data Fig. 1. Telomere elongation in the absence of DNA synthesis
(a) Representative IF-FISH and (b, top) pooled data showing telomere elongation in nonsenescent CD4+ T cells and concomitant telomere shortening in APCs after forming the synapse. APCs from human donors were pre-loaded with cytomegalovirus lysates and allowed to interact with autologous nonsenescent CD4+ T cells in 3:1 ratio for the indicated time points. Conjugates were fixed and analysed by IF-FISH. Data are from n=3 donors (three independent experiments). Scale bar, 10 μm. T=0, initial time at which conjugates are observed (20 min). Images were z-stacked, and the raw telomere integrated fluorescence signals (AU, arbitrary units) are shown. One-hundred two conjugates were analysed. (b, bottom) Analysis of telomere length by qPCR in APCs and nonsenescent CD4+ T cells after forming conjugates. (c-d) Primary human nonsenescent CD4+ T cells were transfected by nucleofection with sgCtrl or sgTERT CRISPR constructs, activated with anti-CD3 plus anti-CD28 and elimination of telomerase was confirmed by (c) qPCR and (d) TRAP assay. (e) Telomerase positive (transfected with sgCTRL) and negative (transfected with sgTERT) nonsenescent T cells were exposed to APCs in the presence of antigen pool, and telomere content was quantified by Flow-FISH using TelC telomere probe. Absolute telomere length by Flow-FISH was determined from Mean Fluorescence Intensity (MFI) values using a standard curve formed by cryopreserved samples with known telomere length as determined by TRF. (f) Telomere content was measured by flow-FISH using either TelC or TelG telomere PNA specific probes coupled to anti-BrdU detection (to monitor telomere elongation vs DNA synthesis in T cells) in telomerase negative nonsenescent CD4+ T cells (CRISPR KO sgTERT) and control T cells (sgCtrl) stimulated with antigen pool for 48h. (g) Telomere length by flow-FISH demonstrating telomere elongation in primary human nonsenescent CD4+ T cells treated with DNA polymerase inhibitors aphidicolin and thymidine prior to exposure to APCs for 48h. Data are from n=3 donors throughout. Statistical Tests are provided in the Supplementary Table 1. Error bars indicate S.E.M. throughout.
Extended Data Fig. 2
Extended Data Fig. 2. Generation of live APCs with fluorescent telomeres
(a) PNA-telomere probes were dissolved 1:50 in telomere loading buffer (80 mM KCl, 10 mM K2PO4, 4 mM NaCl, pH 7.2) and gently introduced on adherent APCs by rolling large glass beads (size: 400-600 mm) for 2 min on cell surface to create temporary pores on the APC membranes and allow telomere TelC PNA probe entry into the APCs while preserving their viability (no cell fixative) needed for subsequent synapse studies with T cells. Arrow indicates beads. The beads were completely removed by washing two times with PBS prior to assays. (b) Absence of any residual glass beads from TelC PNA probe labelled APCs was confirmed by FESEM. Scale bar, 2 μm. Representative of n=3 experiments (three donors). (c) Identical telomere detection by FISH (fixed cells) or glass bead-mediated telomere PNA probe delivery (live cells) in APCs. Nuclei were counterstained by DAPI (blue). Representative of n=4 experiments (four donors). Scale bar, 20 μm. (d) Manders colocalization scores of experiments as in (c). Negative control, APCs with unlabelled telomeres. (e) Immunofluorescence staining of POT1 and telomere TelC PNA probe live delivery on primary human APCs (CD3-depleted PBMCs). POT1 recruitment to telomeres was detected directly ex vivo. Scale bar, 10 μm. (f) Manders co-localization scores of experiments as in (e). Results are from n=3 donors (two experiments). Statistical Tests are provided in the Supplementary Table 1. Error bars indicate S.E.M. throughout..
Extended Data Fig. 3
Extended Data Fig. 3. APCs donate telomere vesicles
(a) Telomere transfer through the immune synapse, confocal imaging. Scale bar, 5 μm. Representative of n=3 donors. (b, top left) Telomere vesicle release triggered by 18h antigen-specific contacts of APCs and nonsenescent CD4+ T cells. (b, bottom left) Alu release in the same T cells. (n=6 donors b, right). (c, left and middle) Side scatter (SSC) threshold and calibration beads used in FAVS-based vesicle purifications, gated on singlets (Extended Data Fig. 3c, left panel). Extended Data Fig. 3c, middle panel, size of the beads. (c, right) PKH67 lipid staining of all vesicles produced by primary human APCs upon 18h ionomycin activation. Unstained PKH67, threshold control. Gating strategy for individual vesicles <100 nm up to 300 nm. Larger particles (>300 nm) due to aggregates were excluded. (d, left) PKH67 staining and (d, middle and right) presence of telomere vesicles in ~10% of the total APC single particle vesicle fraction. (n=9 donors; d, far right). (e) Telomeric DNA from telomere vesicles was purified and confirmed by qPCR (n=3 donors form three independent experiments). (f) Presence of a small population (~1%) of vesicle free telomeres released by APCs during FAVS. Representative of n=9 experiments. (g) Dot-blot analysis of telomeric DNA isolated from different fraction of vesicles isolated from sequential centrifugation of APC supernatants under native or denaturing conditions. APC genomic DNA (gDNA), loading control. Representative of n=3 donors. (h) Super-resolution Zeiss Airyscan microscopy of FAVS-purified Tel+ vesicles. A representative experiment from n=3 independent experiments (three donors) is shown. Scale bar, 200 nm. (i) TEM analysis of Tel-vs Tel+ vesicles. Examples for small-sized vesicles (top) and larger vesicles (bottom) are shown for both Tel- and Tel+. Quantifications of telomeric DNA in telomere vesicles distributed by size (right). Representative images (left) and pooled vesicle data (right) (n=10; from three independent experiments).(j) Further examples of T cell chromosomes with APC telomeres. Metaphase experiments of T cells with APC telomeres were performed n=5 times. Statistical Tests are provided in the Supplementary Table 1. Error bars indicate S.E.M. throughout.
Extended Data Fig. 4
Extended Data Fig. 4. APC telomeres at T cell chromosome ends
(a) Representative metaphase spreads showing T cell chromosomes with APC derived telomeres. Scale bar, 0.85 μm. Representative of n=3 donors. (b) Metaphase spreads generated as in (a) were treated with 1 unit T7 endonuclease for 30 min at 37 °C. The number of T cell chromosomes with APC telomeres before (black values) and after (red values) T7 endonuclease treatment is shown. Pooled from n=3 experiments (three donors). (c) Presence of APC-derived telomeres in purified nonsenescent T cell plasma membranes from (106) vs T cell nuclei from the same cells 24h after transfer of fluorescent telomere enriched supernatants derived from APCs activated with ionomycin. The T cell plasma membranes were assessed by confocal imagining on LEICA SP2. APC telomeres were only observed in the nuclear fraction but not in the T cell plasma membrane after the 24 hours incubation. Pooled data from n=3 independent experiments (three donors). (d) Quantification of APC telomere signal after T cell chromatin immunoprecipitation. Primary human nonsenescent CD3+ T cells (107) were activated by anti-CD3 plus anti-CD28 overnight in in the presence or absence of fluorescent telomere enriched supernatants. The nuclei were digested after lysis with MNase-based Thermofisher Pierce Agarose Chip kit. Chromatin derived from digestion was immunoprecipitated with polyclonal anti-POT1 (1:100) or control rabbit IgG antibodies. The Cy3-fluorescence of APC-derived telomeres was quantified with a microplate reader. Control IP, T cell extracts precipitated with irrelevant IgG. Presence of APC-derived telomeres was confirmed by adding DNase directly to the POT1 IP for 10 min at room temperature prior to fluorescence reading. Pooled results from n=3 donors. Statistical Tests are provided in the Supplementary Table 1. Error bars indicate S.E.M. throughout.
Extended Data Fig. 5
Extended Data Fig. 5. Telomere transfer does not cause APC death
(a) Analysis of cell death of APCs after 18h stimulation with or without ionomycin (0.5 mg/mL), or with hydrogen peroxide (H2O2; 500 mM) as death positive control. Cell death was analysed 18h later by FITC Annexin V/PI Apoptosis staining with flow cytometry. Pooled data from n=7 independent biological experiments are shown. (b) FESEM micrographs (10,000x) of resting APCs or activated APCs upon treatment with ionomycin or H2O2 for 18h. Scale bar 1μm. Pooled data from n=12 micrographs (3-5 APCs per micrograph at 10,000x magnification) depicting %APCs with structural alterations (blebbing or membrane damage) are shown. Note that ionomycin treatment does not induce membrane blebbing. APCs treated with H2O2 (500μM) served as positive control throughout experiments. Each dot is an individual cell from n=3 independent experiments (three donors) (c, left). APCs were coupled to nonsenescent CD4+ T cells in the presence or in the absence of the antigen pool for 18h then analysed by Annexin/PI with flow cytometry. (c, right). Pooled results from n=3 independent experiments (three donors). (d) APCs were separated into their main subsets of DCs, Monocytes and B cells by FACS sorting then 106 cells/subset were live labelled with TelC PNA probes and PKH67 lipid dye, stimulated with ionomycin for 18h, followed by FAVS analysis of APC subset supernatants. Note that hypo or non-proliferative myeloid cells are the major telomere donors. (d, right) Cumulative data from n=3-4 donors are shown (three experiments). (e) The sorting strategies and related purities to derive DCs (99.1%), Monocytes (99.3) and B cells (98.8%) for experiments in (d). Statistical Tests are provided in the Supplementary Table 1. Error bars indicate S.E.M. throughout.
Extended Data Fig. 6
Extended Data Fig. 6. Generation of artificial shelterin APCs
(a, left) IF-FISH demonstrating recruitment of artificial shelterin factors (POT1 and TRF2) to telomeres in primary human APCs transduced with the lentiviral vectors (mock vector and TRF2/POT1 vectors, see methods) and activated with ionomycin for 18h, 96h post transduction. The Pearson’s co-localization score for artificial POT1 and TRF2 with APC telomeres are shown. Scale bar, 5 μm. (a, right) Validation of shelterin overexpression (TRF2 and POT1) by immunoblotting in primary human APCs. Numbers indicate shelterin overexpression efficiency. H2B, loading control. (b) Immunoblot analysis of TRF2 and POT1 following indicated siRNA treatment in primary human APCs. H2B, loading control. The numbers indicate knock-down efficiency. Shelterin knock down APCs were generated by siTRF2 plus siPOT1 transfection from resting primary human APCs. Seventy-two hours later telomere release was analyzed as above described in the absence of ionomycin activation. Results are representative of n=3 independent experiments (three donors) throughout.
Extended Data Fig. 7
Extended Data Fig. 7. Telomere vesicle effects do not require telomerase.
(a) Expansion of human T cells by heterologous telomere vesicles. Nonsenescent CD4+ T cells were activated with anti-CD3 and anti-CD28 and cultured ten days with or without 1,000 telomere vesicles (Tel+) or telomere depleted vesicles (Tel-) purified by FAVS. The vesicles were derived from donor mismatched human (h) or mouse (m) APCs, as indicated, upon ionomycin activation. Different biological cultures are shown (n= 6 no vesicle; n= 18 Tel neg; n= 12 Tel pos human, n= 6 Tel pos; n= 3 free Tel human). (b) Confirmation of CRISPR-based telomerase enhancement in nonsenescent CD4+ T cells by TRAP assay (top) and immunoblots (bottom). (c) Population doublings (n = 3 donors) of nonsenescent CD4+ T cells cultured as indicated for 30 days. (d) Telomere positive and negative nonsenescent CD4+ T cells were activated with anti-CD3 and anti-CD28 for 10 days in the presence of 1,000 telomere vesicles, telomere depleted vesicles or left without any vesicles; n=3 experiments (three donors) throughout cultures. (e) Defective proliferation in primary human nonsenescent CD4+ T cells supplemented with siTZAP telomere vesicles that do not express TZAP compared to those expressing TZAP. Results from n=4 independent experiments (four donors). (f, top). Telomere vesicles produced by TZAP-artificial APCs were purified by FAVS following ionomycin activation for subsequent stimulation of T cells. (f, bottom) Proliferative expansion of T cells with TZAP+ vesicles was tested as in (a). N= 13 (Ctrl); n= 16 (TZAP+), n= 10 (no vesicle); n= 14 (Tel pos). (g) Reduced load of ultra-short telomeres (<3kb) in nonsenescent CD4+ T cells activated by anti-CD3 plus anti-CD28 for 48h followed by transfer of 1,000 FAVS-purified telomere vesicles (Tel pos) or vector-based telomerase enhancement assessed by U-STELA. Controls, T cells with mock vector or 1,000 telomere depleted vesicles. Results from n=5 (tel neg); n= 8 (tel pos; mock vector) or n= 6 (TERT-OE). Statistical Tests are provided in the Supplementary Table 1. Error bars indicate S.E.M. throughout..
Extended Data Fig. 8
Extended Data Fig. 8. Signaling and phenotypic changes of T cells with APC telomeres
(a) Representative immunofluorescence (IF) staining of sestrin 1 in primary human T cells cultured with or without telomere vesicles derived from APCs previously transfected with either siCtrl or siRad51 RNAs then transferred to primary human nonsenescent CD4+ T cells activated by anti-CD3 plus anti-CD28 for ten days. Telomere depleted vesicles (telomere neg) as background control. Representative of 3 donors. (b) Data shown are pooled from n=3 donors, with each dot being an individual T cell. (c) Primary human nonsenescent CD4+ T cells (105) were activated with anti-CD3 (0.5 mg/mL) and recombinant human IL-2 (10ng/mL) for 10 days in the presence of 250 FAVS-purified telomere vesicles derived from either human or mouse APCs prior to multiparametric flow cytometry. Control T cells were activated without any vesicle or with 250 telomere depleted vesicles obtained by FAVS. Representative plots and (d) pooled data from n=5 independent experiments are shown. Numbers indicate mean fluorescence intensity (MFI) value from a representative experiment. Statistical Tests are provided in the Supplementary Table 1. Error bars indicate S.E.M. throughout.
Extended Data Fig. 9
Extended Data Fig. 9. Naive and central memory T cells are the major telomere acquiring cells from APCs.
(a) Analysis of telomere transfer by flow FISH flow cytometry upon conjugation of APCs live-labelled with TelC PNA telomere probes and total primary human CD3+ T cells for 24 hours. Each dot is an individual donor from n = 4 independent biological experiments. Control, APCs loaded with antigen pool and stimulated with T cells but without telomere labelling throughout experiments (no APC telomere). No antigen (pool) control is also shown confirming antigen dependency. (b) Naïve and central memory T cells are the major APC telomere acquiring cells. Purified primary human CD4+ T cell populations (CD28+ CD45RA+ naïve purity 98.7%; CD28+ CD45RA- central memory (CM) purity 95%; CD28- CD45RA- senescent effector memory (EM) 97.5%; senescent CD28- CD45RA+ EMRA purity 94%) were treated as in (a) and telomere transferred was measured by flow FISH with TelC probe. Pooled results from n = 3 (CM and EM) and n = 4 (naïve and EMRA) independent individual donors. Note that since primary human CD4+ T cells first lose expression of CD27 followed by that of CD28, CD28- CD4+ T cells are highly differentiated cells, many of which are considered senescent,–,. The opposite regulation occurs in primary human CD8 T cells, where the CD27- population is considered highly differentiated/senescent since the cells first expression of CD28 followed by that of CD27,. The reason for this is not known. Statistical Tests are provided in the Supplementary Table 1. Error bars indicate S.E.M.
Extended Data Fig. 10
Extended Data Fig. 10. Existence of T cells with telomeres of APC origin in mice
(a) Quantification of APC telomeres at mouse T cell chromosomes upon in vivo APC labelling. Two representative examples are shown. As control, mouse OTII CD4+ T cells were analysed by IF-FISH in the absence of telomere vesicles (no vesicle control). Scale bar, 2μm. FACS plot, Edu incorporation control in donor APC prior to telomere transfer. Representative of n=3 mice. (b) Naïve CD45.2 OTII CD4+ T cells were incubated with congenic TelC labelled APCs in the presence of OVA (3 μM) for 18 hours then sorted into CD45.2 OTII CD4+ Tel+ (T cells with APC telomeres) versus CD45.2 OTII CD4+ Tel- (T cells without APC telomeres) based on telomere transfer prior to transfer into CD45.1 recipients and vaccination with OVA (30 μg). Effector responses were assessed 5 days post-transfer; for memory responses mice were re-vaccinated with OVA (30 μg) forty days after the first vaccination and observed after additional fifty days. Note that the in vitro efficacy of telomere transfer is much lower than that observed in vivo, possibly due to the well-recognized lower efficiency of in vitro APC-T cell conjugates versus their physiological counterparts in vivo. (c) Phenotype of donors CD45.2 OTII CD4+ T cells as in Fig. 6h. and (d) the same markers for experiments as in Fig. 6i-j. (e-f) Percentage of CD45.2 OTII CD4+ Tel+ vs CD45.2 OTII CD4+ Tel- in the blood of recipient mice vaccinated with OVA during effector and memory responses. Each dot is an individual animal (Tel neg n= 9; Tel pos n=7 animals, e; and n = 5 per group in f). Statistical Tests are provided in the Supplementary Table 1. Each dot is an individual mouse. Error bars indicate SEM.
Figure 1
Figure 1. APCs donate telomeres to T cells.
(a) TRF analysis of APCs and T cells before and after synapse formation. Loading control, double stranded DNA (dsDNA). Representative (left) and pooled data (n=7 donors) are shown (right). (b) Telomere clustering in APC-T cell conjugates. Nonsenescent CD4+ T cells were labelled with CTV prior to conjugation with CTV-free APCs for 2h then analysed by Immunofluorescence IF-FISH. Representative conjugate (left) and pooled data (right) from thirty-seven conjugates (n= 3 independent experiments) are shown. Scale bar, 5 μm. (c) Telomere donation by APCs upon antigen-specific contact with T cells. Immunoprecipitates of telomeric DNA donated by BrdU-labelled APCs immunoprecipitated from cell-free supernatants were assessed by dot blot. Input, APC genomic DNA (200 ng). Representative data (left) and pooled data (n=3 independent experiments; right) are shown. (d) DNAse I-based telomere vesicle protection assays by qPCR in the presence or in the absence of 1% Triton-X 100. Pooled data (n= 3 independent experiments) are shown. (e) TRF analysis of APC telomeric DNA present in the EVs isolated by ultracentrifugation upon ionomycin activation. Restriction enzyme digestion to remove non telomeric DNA. APC gDNA, positive control. dsDNA, loading controls. Representative data (left) and (right) pooled data (n= 3 donors) are shown. (f) TEM with strepavidin-colloidal 10 nm immunogold conjugate labelling of telomere vesicles released by human APCs. Scale bar, 100nm. A representative telomere vesicle (n= 3 independent experiments) is shown. Additional TEM data, Extended Data Fig. 3i. (g) Ultrastructural analysis of telomere vesicles by FESEM following purification by FAVS. Magnification, 100,000X; scale bar, 100nm. Representative images (left) and pooled data (right) from 204 vesicles are shown (n= 3 independent experiments). (h) Detection of T cell chromosomes upon transfer of EdU-labelled APC telomeres by IF-FISH. Representative data (left n= 5 donors along with additional examples in ED3j) and their enlargement (middle) are shown. Scale bar, 2 μm. Quantification from 2425 chromosomes in the same experiments (bottom right). Error bars indicate S.E.M. throughout. Statistical tests, Supplementary table 1.
Figure 2
Figure 2. Synaptic TCRs are sufficient to extract telomere vesicles from APCs.
(a) Schematic representation of telomere transfer on artificial synapse bilayers (see Methods). (b) Representative release of CD63+ telomere vesicles from APCs activated on bilayers. APCs were live-labelled with TelC telomere probes and anti-CD63 prior to transfer on bilayers (n= 3 donors). (c) Quantification of antigen-specific telomere release by APCs (n= 4 donors) on bilayers dependent on TCR and antigen availability on the bilayer. Bilayers were either coated with or without anti-TCR followed by loading of nonsenescent CD4+ T cells which resulted either in release of TCR (TCR+) or no TCR release on the bilayer (TCR-) after removal of T cells. TelC-labelled APCs where then either pre-loaded with (Ag+) or without (Ag-) the antigen pool and their telomere release on bilayers quantified. As control, TelC-labelled APCs were pre-treated with Syk inhibitor (Syk inhibitor; 200nM) to inhibit calcium signalling for 30 min in the presence of the antigen pool prior to transfer on TCR coated bilayers. The percentage of telomere releasing APCs was normalized to the total number of APCs on the bilayer. (d) Demonstration of lipid content of telomere vesicle released from APCs on planar bilayers (n= 3 donors). Antigen (Ag)-pulsed APCs were live labelled with TelC probes and PKH67 lipid dye then incubated onto bilayers containing synaptic TCRs for 24h. (e) Representative release of CD63+ telomere vesicles on planar bilayers documented by brightfield illumination (n= 4 donors). (f) Isotype control experiments for telomere vesicle release on bilayers (n= 3 donors). (g) Nonsenescent CD4+ T cells (10) were cultured for 48 hours with five-thousands telomere vesicles (Tel+) purified from APCs by FAVS, in the presence or absence of blocking MHC II antibodies (1 μg/mL), then analysed by qPCR. Five-thousands telomere depleted vesicles (Tel-) served as control. Data from n= 3 donors. Scale bars, 10, 5 or 1 μm as shown throughout. Error bars indicate S.E.M. throughout. Statistical tests, Supplementary table 1.
Figure 3
Figure 3. TZAP is required for telomere transfer.
(a) Composition of telomere vesicles derived from ionomycin stimulated APCs by immunoblotting. APC lysates (20%), input control. Representative of n= 3 donors. (b) Protein cargo analysis in FAVS purified telomere vesicles (TTAGGG+ PKH67+; Tel+) or telomere depleted vesicles (TTAGGG- PKH67+; Tel-) by indirect ELISA. Results from n= 9 experiments are shown. (c) APCs treated as indicated for 18h were analysed by immunoblot against cleaved caspase 3 as apoptosis marker, and the telomere trimming factor TZAP. Tubulin, loading control. Representative of n= 3 donors. (d) Representative TRF analysis (left) and pooled data from (n= 3 experiments; right) of TZAP dependent telomere trimming in vitro. TZAP was immunoprecipitated from APCs cultured with or without ionomycin for 18h and the immunoprecipitates were incubated for additional 18h at 30°C with genomic DNA extracted from resting APCs. TRF analysis determined telomere shortening upon incubation with TZAP but not control IgG immunoprecipitates that was enhanced by ionomycin. (e) Immunoblotting validation of TZAP depletion by siRNA nucleofection. Human APCs were transfected with siCtrl or siTZAP for 72h followed by immunoblotting to TZAP. GAPDH, loading control. The numbers indicate quantification of knock-down efficiency. Representative of n= 3 experiments. (f) Defective telomere vesicle production by TZAP-deficient APCs. APCs were transfected with control siRNA (siCtrl) or silencing TZAP RNA (siTZAP) for 72 hours and stimulated with ionomycin for 18 hours during the 72h culture before telomere vesicle analysis of their ultra-centrifuged supernatants. Representative results (left) and pooled data from n= 5 experiments (right). (g) The siTZAP vesicles from one million APCs were counted by FAVS. The red bar indicates mean from n= 4 experiments. Donor matched, TZAP-proficient APCs, Fig. 4g-h. (h) TZAP transfer at the immune synapse. TZAP-over-expressing APCs (106) were conjugated 24h with primary human nonsenescent CD4+ T cells in a 3:1 ratio in the presence of antigen pool then analysed by IF-FISH. Representative of n= 3 donors. Error bars indicate S.E.M. throughout. Statistical tests, Supplementary table 1.
Figure 4
Figure 4. APCs dismantle shelterin to donate telomeres.
(a) Activated APCs lose shelterin asssessd by IF-FISH of shelterin proteins in primary human APCs cultured without (top two left) or with (bottom two left) ionomycin (0.5 μg/mL) for 18h. Results from n= 4 donors. Co-localization scores, (top right). Shelterin relative mean fluorescence intensity, middle and bottom right. Scale bar, 2 μm. (b) Representative immunoblot (left) and pooled data (n= 3 donors; right) from APC nuclear extracts treated with (+) or without (-) ionomycin quantification. H3, loading control. (c) Representative images (left) and quantification (right) from n= 3 donors of TRF2 by immunofluorescence in primary human APCs left either untreated, or pre-incubated with the proteasome inhibitor MG-132 (1μM) then conjugated with nonsenescent CD4+ T cells for 24h in the presence of antigen pool. Scale bar, 10 μm. (d) APCs donate shelterin-devoid telomeres. TelC-labelled APCs were activated with ionomycin for 18h, then analysed by IF to POT1. Arrows indicate ‘shelterin-devoid’ telomeres released by APCs. Quantification of TRF2 is also shown (n= 3 donors). Scale bar, 10 μm. (e) Shelterin over-expression arrests telomere release from activated APCs. Telomere dot blot on BrDU immunoprecipitates from APCs transduced with mock or shelterin overexpressing (Shelterin OE) vectors to TRF2 + POT1, then activated with or without ionomycin for 18h (n= 3 experiments). (f) Spontaneous release of telomere vesicles from supernatants of resting primary human APCs transfected with siCtrl or siTRF2 plus siPOT1 during a 72h culture. Quantification from n= 4 independent experiments (top) and representative telomere dot-blot (bottom). (g) Representative FAVS profiles and quantifications of telomere vesicles released by 106 ionomycin activated APCs modified as indicated. TTAGGG, telomeres; PKH67, lipid dye used for vesicle detection. For quantifcation, each dot is an individual donor. (h) Quantificaiton of (g). N = 7 (siCtrl); n= 5 (siShelterin), n= 7 (siCtrl iono); n= 4 (Shelterin-OE iono). Error bars indicate S.E.M. throughout. Statistical tests, Supplementary table 1.
Figure 5
Figure 5. Defective recombinogenic potential in Rad51-deficient telomere vesicles.
(a) Presence of Rad51 assessed by IF in APC vesicles upon 18h ionomycin activation. Representative results (left) and pooled data from forty-two microscopy fields are shown (n=3 experiments; right). Scale bars, 2 μm. (b) DNA damage factors in extracellular vesicles derived by sequential centrifugation of APC supernatants as in (a). APCs, whole cell lysate control (n=3 experiments). (c) Validation of Rad51 deficiency by siRNA treatments in primary human APCs. Histone H2B, loading control. Representative of n=3 donors. (d) Release of telomere vesicles by 106 Rad51-deficient APCs (siRad51; left) assessed by FAVS (n=6 donors). (e) Size of siRAd51 telomere vesicles by FESEM. Two-hundred vesicles were enumerated from n=3 experiments (three donors). (f) Protein cargo in FAVS purified siRad51 or siCtrl telomere vesicles by ELISA (n=4 experiments). (g) siCtrl and siRad51 vesicles were assessed by QAOS (n=3 experiments). (h) Role of vesicular Rad51 in APC-T cell telomere colocalization. Cell-free supernatants containing red fluorescent siCtrl or siRad51 APC-telomere vesicles were transferred into T cells with green telomeres that were live-labelled in the same manner prior to telomere transfer. Analysis was carried 24h later. Arrowheads, APC-T cell telomere co-localization. Only green signals are endogenous T cell telomeres. Scale bar, 5 μm. Representative results (left) and thirty-six cells pooled from n=6 experiments (six donors) for each treatment (right). (i) Metaphase Q-FISH showing defective elongation of individual T cell chromosome ends upon transfer of telomere vesicles derived from Rad51-deficient APCs (siCtrl, 370 and siRad51, 378 from n=6 experiments). (j) siCtrl and siRad51 vesicles were assessed by TRF (n= 3 experiments). (k) Reduced fusion (elongation) between siRad51 telomere vesicles and T cell telomeres. Nonsenescent (106) CD4+ T cells were treated with five-thousands FAVS-purified siCtrl or siRad51 APC-derived telomere vesicles (Tel+) and total nuclear T cell extracts were analysed by qPCR 48h later (n= 3 experiments). Five-thousands telomere depleted vesicles (Tel-) were also transferred as control. Error bars indicate S.E.M. throughout. Statistical tests, Supplementary table 1.
Figure 6
Figure 6. Generation of long-lasting immunity by telomere transfer.
(a) Population doublings of nonsenescent CD4+ T cells activated as indicated and treated once with siCtrl or siRad51 telomere vesicles at the start of the culture for 39 days (n= 3 donors). (b) Lack of beta-galactosidase activity in nonsenescent CD4+ T cells activated with anti-CD3 plus anti-CD28 for ten days and treated with 1,000 siCtrl or siRad51 telomere vesicles (n= 4 donors). (c) Prevention of senescent T cell generation by telomere transfer from naïve CD4+ T cells activated by anti-CD3 and anti-CD28 and treated with 250 telomere vesicles for fifteen days (n= 5 donors). (d) Generation of CD62L+ CD95+ stem-like memory T cells from naïve CD4+ T cells during the fifteen day culture (n= 8 experiments). (e) Demonstration of in vivo telomere transfer, experimental design. (f) Presence of APC telomeres among the transferred OT II T cells (n=3 mice). (g) APC telomeres (red) into the recipient T cell nuclei after in vivo telomere transfer (n=3 mice). Scale bar, 5 μm. (h) Naïve CD45.2 OT-II T cells were separated into Tel+ versus Tel- following synaptic telomere transfer from APCs pulsed with OVA, then injected into wild type CD45.1 recipients, then immunized with OVA with assessment after five days. Expansion of transferred CD45.2 OTII Tel+ T cells in both spleen (%donor spleen Tel+ n = 7 mice and Tel- n=9 mice; and no. donor spleen Tel+ n= 5 mice and Tel- n= 6 mice) and lymph nodes (n= 6 mice per group). (i) Gating strategy (left) and data (right) showing enhanced in vivo presence of CD45.2 OTII Tel+ T cells derived and injected as in (g), with a second vaccination of recipients after forty days and assessment of CD45.2 OTII T cells fifty days later: data are from n = 5 mice (%donor spleen cells) or n= 4 mice per group. (j) Induction of CD95+ stem-like CD45.2 OT II T cells, and that of central memory CD45.2 OT II T cells as in (i). Data from n= 4 mice per group. Error bars indicate S.E.M. throughout. Statistical tests, Supplementary table 1.
Figure 7
Figure 7. Vesicular Rad51 is required for the longevity effect of the telomere vesicles.
(a) Naïve CD45.2 OT II (CD4+) T cells were treated with 500 telomere vesicles from siRNA control transfected APCs (siCtrl), Rad51 depleted vesicles (siRad51 tel) or telomere depleted vesicles (Tel-) from siRNA transfected APCs (congenic CD3-depleted splenocytes) for 24h then transferred into recipient CD45.1 mice. Mice were challenged with OVA 18h later, rested for 40 days, followed by OVA restimulation, rested for another 30 days followed by assessment of presence of donor T cells by flow-cytometry. Analysis was carried out 70 days post-transfer to assess percentage of donor CD45.2 OTII T cells in the spleen (b) and (c) lymph nodes of recipient CD45.1 mice. (d) Phenotypic analysis of splenic CD45.2 OTII (CD4+) T cells 70 days in adoptive transfer experiments described in (a) that is assessment of memory response 70 days after telomere transfer. Data are from n= 5 mice (b), n= 6 mice (c) and for (d) n= 6 mice (CD95, all conditions; CD44 siCtrl Tel and siRad51 Tel; CD62L siCtrl Tel and siRad51 Tel) n = 5 mice (CD44 siCtrl Tel-; and CD62L siCtrl tel-). Each dot is an individual animal. Error bars indicate S.E.M. throughout. Statistical tests, Supplementary table 1.
Figure 8
Figure 8. Role of telomere vesicle transfer in immune defense.
(a)Experimental design. Mice were vaccinated with FLUAD (1:20 of the human dose) and sacrificed after five days, to derive splenic CD4+ T cells that had been primed by the vaccine. Primed CD4+ T cells were incubated with 5,000 vesicles containing telomeres (Tel+ ves) or 5,000 depleted of telomeres (Tel- ves) obtained from ionomycin activated APCs of congenic origin not exposed to FLUAD for 18h then adoptively injected into recipient naïve C57BL/6J mice (n= 5 animals per group). Control mice (n=4 animals) were injected with T cells from C57BL/6J mice not primed with the FLUAD vaccine. Recipient mice were then early (after 18 hours) and delayed (after 15 days) infected with H1N1 flu virus (3.5x10⁵ PFU). Survival was monitored for fifteen days and clinical score was recorded throughout. Mice (n=5 animals per group) were sacrificed when a clinical score was equal or above 10, or in any case severe dyspnea was observed. Clinical scoring for sign of illness was performed as described in Methods. (b) Survival of mice receiving either CD4+ T cells with APC telomere vesicles (Tel+) or with telomere depleted vesicles (Tel-) from FLUAD-primed congenic donors as in panel (a) and infected immediately. Ctrl, animals injected with T cells that had not been exposed to the vaccine (yellow line). (c) Survival of mice receiving either Tel+ or Tel- T cells as in (b) and infected 15 days later. Statistical tests, Supplementary table 1.

Comment in

References

    1. Kipling D. Telomeres, replicative senescence and human ageing. Maturitas. 2001;38:25–37. discussion 37-8. - PubMed
    1. Hayflick L, Moorhead PS. The serial cultivation of human diploid cell strains. Exp Cell Res. 1961;25:585–621. - PubMed
    1. Blasco MA. Telomeres and human disease: ageing, cancer and beyond. Nat Rev Genet. 2005;6:611–22. - PubMed
    1. Collins K. Mammalian telomeres and telomerase. Current Opinion in Cell Biology. 2000;12:378–383. doi: 10.1016/S0955-0674(00)00103-4. - DOI - PubMed
    1. Cesare AJ, Reddel RR. Alternative lengthening of telomeres: models, mechanisms and implications. Nature Reviews Genetics. 2010;11:319–330. - PubMed

Publication types