. 2022 Sep 15;23(1):196.
doi: 10.1186/s13059-022-02757-0.

Genetic regulation of RNA splicing in human pancreatic islets

Collaborators, Affiliations

Genetic regulation of RNA splicing in human pancreatic islets

Goutham Atla et al. Genome Biol. .

Abstract

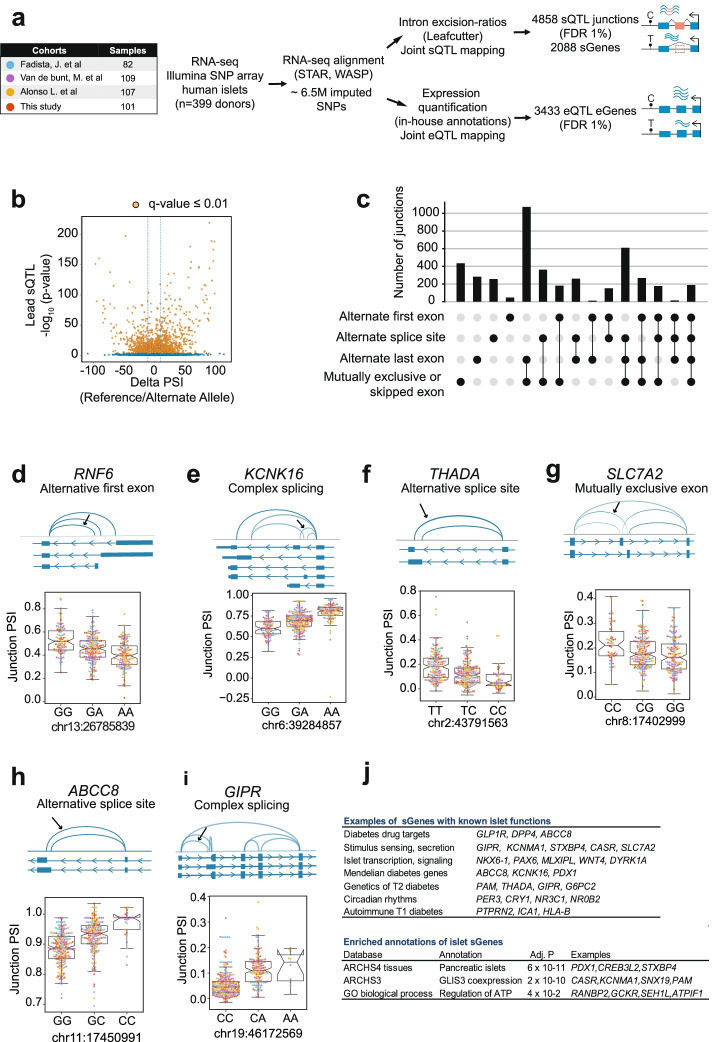
Background: Non-coding genetic variants that influence gene transcription in pancreatic islets play a major role in the susceptibility to type 2 diabetes (T2D), and likely also contribute to type 1 diabetes (T1D) risk. For many loci, however, the mechanisms through which non-coding variants influence diabetes susceptibility are unknown.

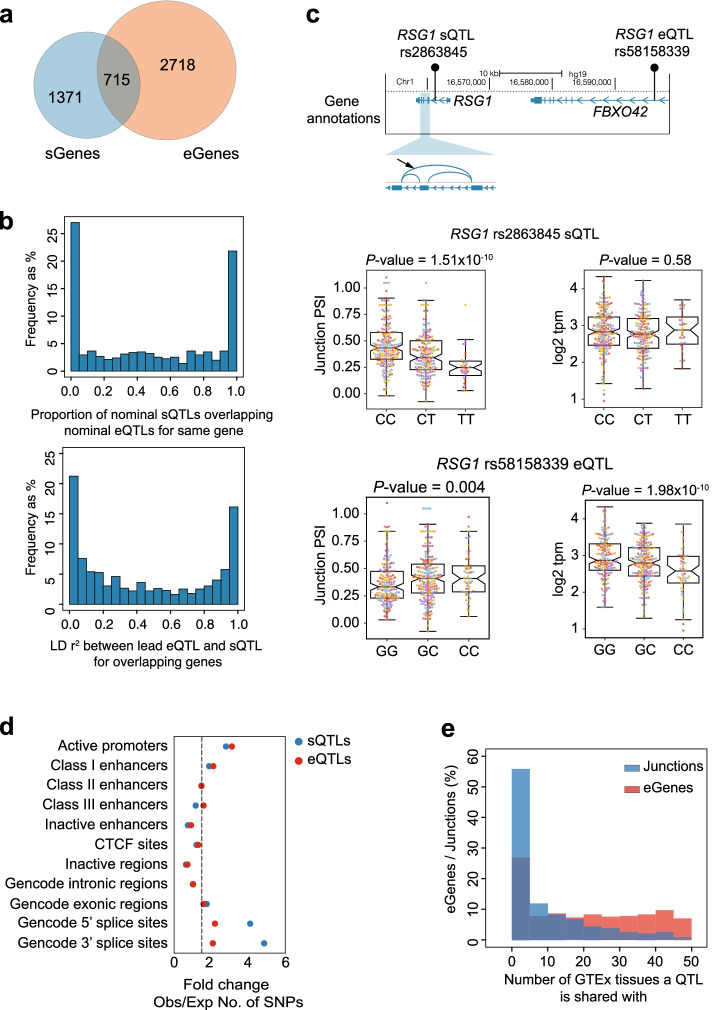
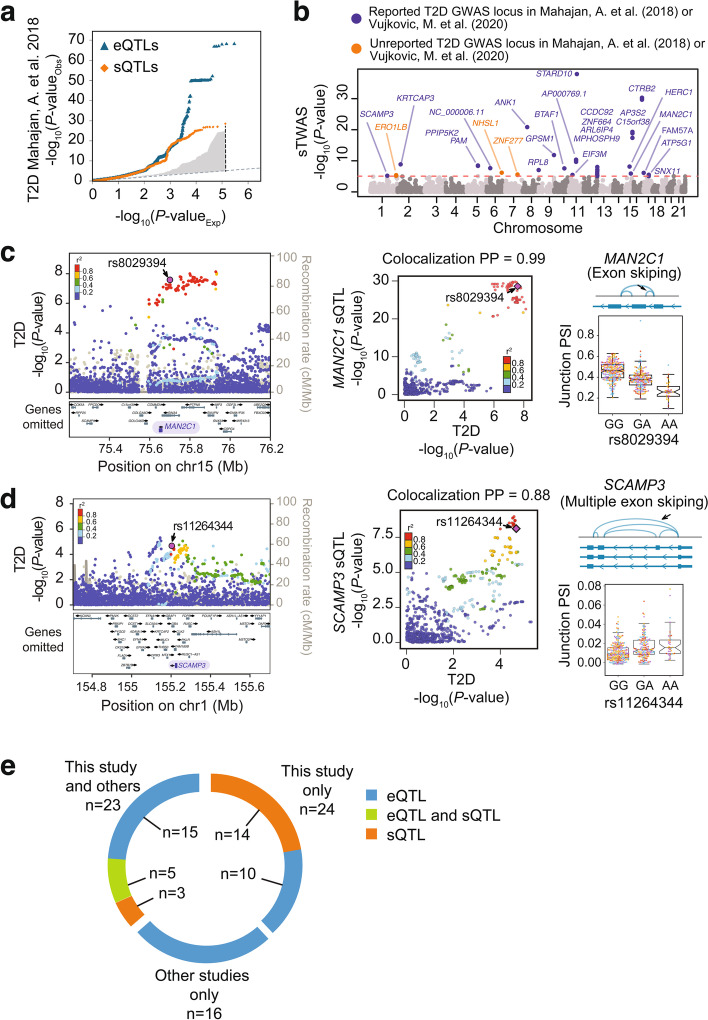
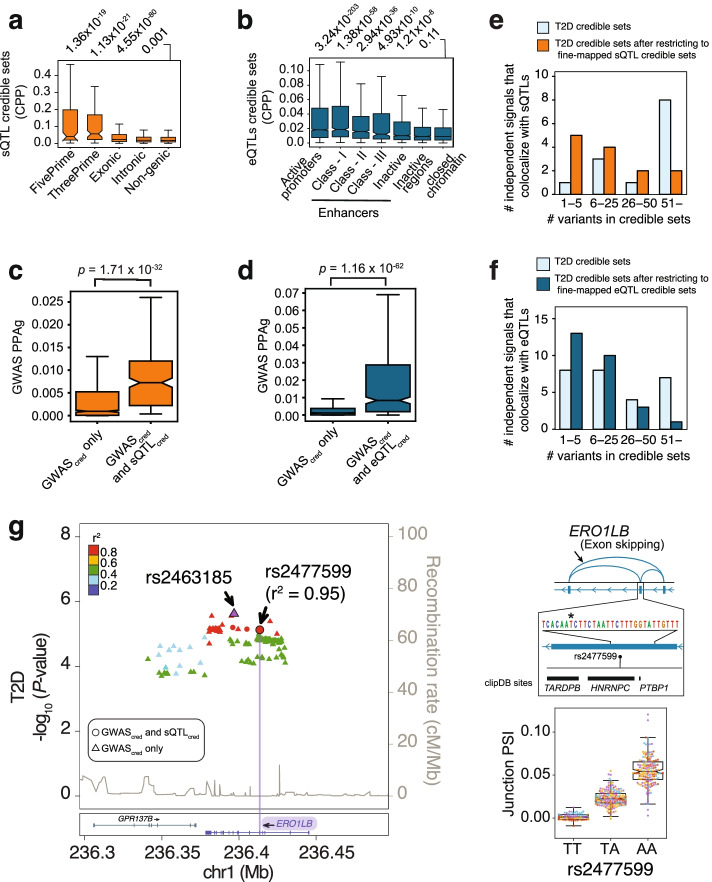
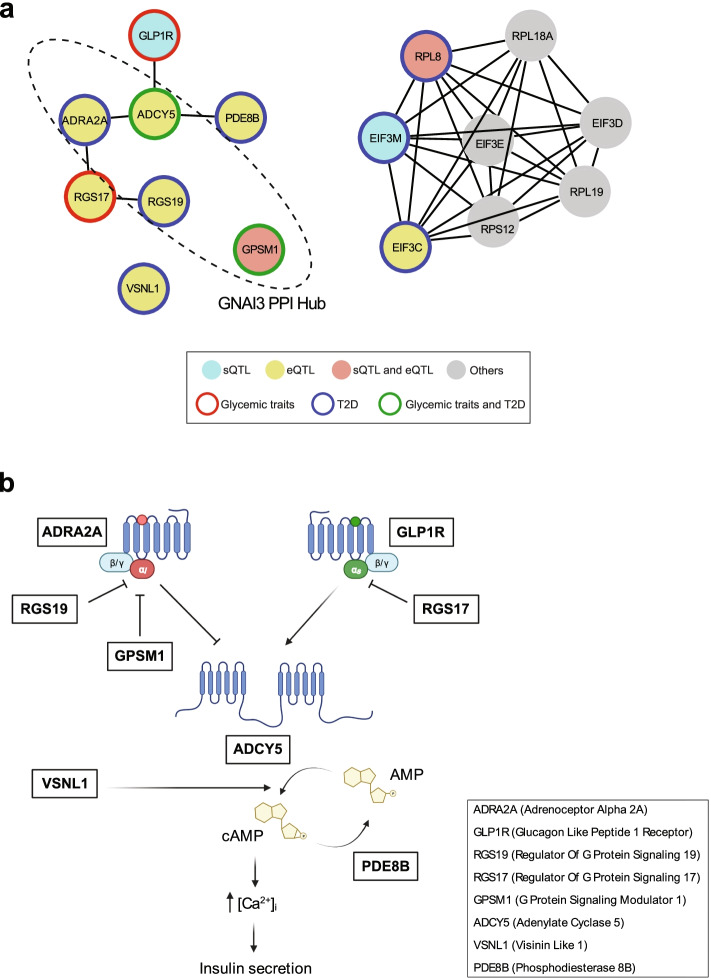
Results: We examine splicing QTLs (sQTLs) in pancreatic islets from 399 human donors and observe that common genetic variation has a widespread influence on the splicing of genes with established roles in islet biology and diabetes. In parallel, we profile expression QTLs (eQTLs) and use transcriptome-wide association as well as genetic co-localization studies to assign islet sQTLs or eQTLs to T2D and T1D susceptibility signals, many of which lack candidate effector genes. This analysis reveals biologically plausible mechanisms, including the association of T2D with an sQTL that creates a nonsense isoform in ERO1B, a regulator of ER-stress and proinsulin biosynthesis. The expanded list of T2D risk effector genes reveals overrepresented pathways, including regulators of G-protein-mediated cAMP production. The analysis of sQTLs also reveals candidate effector genes for T1D susceptibility such as DCLRE1B, a senescence regulator, and lncRNA MEG3.

Conclusions: These data expose widespread effects of common genetic variants on RNA splicing in pancreatic islets. The results support a role for splicing variation in diabetes susceptibility, and offer a new set of genetic targets with potential therapeutic benefit.

Keywords: Beta cells; CTRB2; Diabetes pathophysiology; G-protein signaling; Pancreatic beta-cells; Pancreatic islets; Quantitative trait loci; RNA splicing; Senescence; TWAS; Type 1 diabetes; Type 2 diabetes.


Conflict of interest statement

ALG’s spouse is an employee of Genentech and holds stock options in Roche. JAT is a member of the GSK Human Genetics Advisory Board.

Figures

Fig. 1
Fig. 1
Mapping sQTLs and eQTLs in human pancreatic islets. a Overview of the study design. b Volcano plot showing the reference to alternate allele change in percentage splice index (Delta-PSI) for junctions, and sQTLs -log10 p-values. Orange dots depict sQTLs junctions with q ≤ 0.01. c Classification of sQTLs according to types of splicing events. d–i Selected examples of sGenes with different types of splicing events. An arrow signals the sQTL junction with best p-value, and adjacent boxplots show normalized, batch-corrected junction PSI values stratified by the lead sQTL genotype (IQR and 1.5 × IQR whiskers). Junction PSI values are colored according to the human islet dataset they belong to (see a). All boxplots show sQTLs with permutation p-values significant at FDR ≤ 1%, see Additional file 3: Table S2. j Functional annotations of sGenes. The top panel shows a manually curated list of examples with known functions in islet function and diabetes (see Additional file 4: Table S3); the bottom panel shows enriched annotations using EnrichR and Benjamini–Hochberg-adjusted p-values
Fig. 2.
Fig. 2.
sQTLs and eQTLs are distinct genetic signals. a Overlap of sGenes and eGenes. b For 715 genes that have both eQTLs and sQTLs (overlapping genes in a), the top histogram shows the distribution of the percentage of variants shared between sets of nominally significant eQTLs and sQTLs. The bottom histogram shows the distribution of LD (r2) values between the lead eQTL and sQTL. c RSG1 has a distal eQTL, located in an intron of the FBXO42 gene, and an intronic sQTL, both of which are in low LD (r2=0.25). Boxplots represent RSG1 expression and junction PSI values for both sQTL and eQTL, showing that the lead eQTL rs58158339 is not associated with RSG1 splicing and the sQTL rs2863845 is not associated with expression. Boxplots show normalized, batch-corrected expression or junction PSI values stratified by the genotype of the lead QTL (IQR boxes and 1.5 × IQR whiskers). Individual samples are colored according to the human islet dataset they belong to (see color legend in Fig. 1a). Nominal QTL p-values are provided. d Enrichment of sQTL and eQTL variants in different functional genomic annotations using GREGOR. The x-axis represents GREGOR fold change of observed vs. expected number of SNPs at each functional annotation. The dotted line represents 1.5-fold change. e Percentage of eGenes and Junctions with eQTLs or sQTLs at FDR ≤ 1%, respectively, shared in different number of GTEx tissues. We used significant eQTLs and sQTLs from 47 distinct GTEx V8 release tissues
Fig. 3
Fig. 3
Role of human islet splicing variation in T2D susceptibility. a Quantile-quantile (QQ) plot showing observed T2D association p-values in human islet sQTLs (orange dots) and eQTLs (blue dots) against p-values under the null hypothesis. The grey-shaded region represents 1000 p-value distributions (in the -log10 scale) of random sets of control sQTL variants (see the “Methods” section). Each set of control variants matches the number of islet sQTLs plotted. b Manhattan plot of splicing associations with T2D susceptibility (sTWAS). The y-axis shows -log10 TWAS association p-values. Significant sTWAS associations in known T2D GWAS loci are colored in purple, and in previously unreported loci in orange. c, d Regional T2D GWAS signal plots for PTPN9 and PKLR loci, two known T2D susceptibility regions, which showed significant sTWAS signals in MAN2C1 (c) and SCAMP3 (d) genes, respectively. Both splicing QTL effects in MAN2C1 and SCAMP3 are significant at FDR ≤ 1%; see Additional file 3: Table S2. LocusZoom plots show -log10 T2D association p-values and locations in hg19 genome build. LocusCompare scatter plots show sQTL and T2D GWAS association p-values (-log10 scale), illustrating co-localization of variants for both traits. Variants are colored according to the LD correlation (r2) with the lead GWAS variant of the sTWAS association (purple diamond). Boxplots show normalized, batch-corrected junction PSI values on y-axis stratified by the genotype of the lead GWAS variant from the sTWAS association. Boxplots follow the color-to-batch legend from Fig. 1a. e Known T2D loci with target effector transcripts nominated by sQTLs and eQTLs from this study and/or eQTL maps from the InsPIRE consortium
Fig. 4
Fig. 4
Fine-mapping causal variants for known and novel T2D genetic associations. a Distribution of sQTL causal posterior probabilities (CPP) across different genic and non-genic regions. P-values on top correspond to Mann-Whitney comparisons with non-genic regions. b eQTL causal posterior probabilities across epigenomic annotations. P-values on top correspond to comparisons with credible set variants that fall outside islet epigenomic annotations (closed chomatin regions). c, d For all T2D-associated loci that colocalize with an islet QTL, we examined all fine-mapped variants (99% credible sets in GWAS, GWAScred) and compared the distribution of T2D causal posterior probabilities for variants that are also fine-mapped QTL variants (QTLcred) vs. those that were not fine-mapped QTL variants. Mann-Whitney p-values are provided. Boxplots show IQR without outliers although p-values were calculated using all data points. e, f Integration of T2D GWAS credible set variants with credible sets from colocalizing sQTLs and eQTLs increases fine mapping resolution. Bar plots show the number of independent signals that fall into different bins of number of candidate causal variants before and after restricting for QTL variants. G Fine-mapping an sQTL and T2D association in ERO1B. The splicing QTL effect on ERO1B is significant at FDR ≤ 1%; see Additional file 3: Table S2. The LocusZoom shows T2D association -log10 p-values; credible set variants for GWAS and sQTLs are shown as circles, and other GWAS credible set variants as triangles. The color of dots reflects r2 with the lead GWAS variant (in purple) and includes the best fine-mapped candidate causal sQTL (rs2477599). The bottom inset depicts the alternative splicing event, along with the candidate causal sQTL variant and clipDB RBP binding sites. Boxplots are as described in Figs. 1, 2, and 3.
Fig. 5
Fig. 5
Islet QTLs that co-localize with T2D signals target distinct pathways. a STRING v11.5 was used to analyze 106 genes with sQTLs or eQTLs co-localizing with T2D or glycemic traits, including previously reported eQTLs. We only considered genes with known or presumed protein-coding function, and not exclusively expressed in non-endocrine cells according to single cell RNA-seq. We allowed for inflation of ≤ 5 interactors, and used default (>0.4) confidence scores. Shown are two networks with >3 components, one populated by components of heterotrimeric G protein signaling, and another by genes involved in eIF3 translational initiation. Genes are colored as indicated in the legend; other interactors added through STRING analysis are shaded gray. b Manual curation was used to illustrate the relationship between components of the G protein-mediated insulinotropic pathway targeted by islet QTLs linked to T2D and related traits

References

    1. Mahajan A, Taliun D, Thurner M, Robertson NR, Torres JM, Rayner NW, Payne AJ, Steinthorsdottir V, Scott RA, Grarup N, et al. Fine-mapping type 2 diabetes loci to single-variant resolution using high-density imputation and islet-specific epigenome maps. Nat Genet. 2018;50:1505–1513. doi: 10.1038/s41588-018-0241-6. - DOI - PMC - PubMed
    1. Flannick J, Mercader JM, Fuchsberger C, Udler MS, Mahajan A, Wessel J, Teslovich TM, Caulkins L, Koesterer R, Barajas-Olmos F, et al. Exome sequencing of 20,791 cases of type 2 diabetes and 24,440 controls. Nature. 2019;570:71–76. doi: 10.1038/s41586-019-1231-2. - DOI - PMC - PubMed
    1. Vujkovic M, Keaton JM, Lynch JA, Miller DR, Zhou J, Tcheandjieu C, Huffman JE, Assimes TL, Lorenz K, Zhu X, et al. Discovery of 318 new risk loci for type 2 diabetes and related vascular outcomes among 1.4 million participants in a multi-ancestry meta-analysis. Nat Genet. 2020;52:680–691. doi: 10.1038/s41588-020-0637-y. - DOI - PMC - PubMed
    1. Robertson CC, Inshaw JRJ, Onengut-Gumuscu S, Chen WM, Santa Cruz DF, Yang H, Cutler AJ, Crouch DJM, Farber E, Bridges SL, et al. Fine-mapping, trans-ancestral and genomic analyses identify causal variants, cells, genes and drug targets for type 1 diabetes. Nat Genet. 2021;53:962–971. doi: 10.1038/s41588-021-00880-5. - DOI - PMC - PubMed
    1. Chiou J, Geusz RJ, Okino ML, Han JY, Miller M, Melton R, Beebe E, Benaglio P, Huang S, Korgaonkar K, et al. Interpreting type 1 diabetes risk with genetics and single-cell epigenomics. Nature. 2021;594:398–402. doi: 10.1038/s41586-021-03552-w. - DOI - PMC - PubMed

Publication types

MeSH terms