. 2022 Aug 30:13:930446.
doi: 10.3389/fgene.2022.930446. eCollection 2022.

Predicting prognosis and immune responses in hepatocellular carcinoma based on N7-methylguanosine-related long noncoding RNAs

Affiliations

Predicting prognosis and immune responses in hepatocellular carcinoma based on N7-methylguanosine-related long noncoding RNAs

Yu-Yang Dai et al. Front Genet. .

Abstract

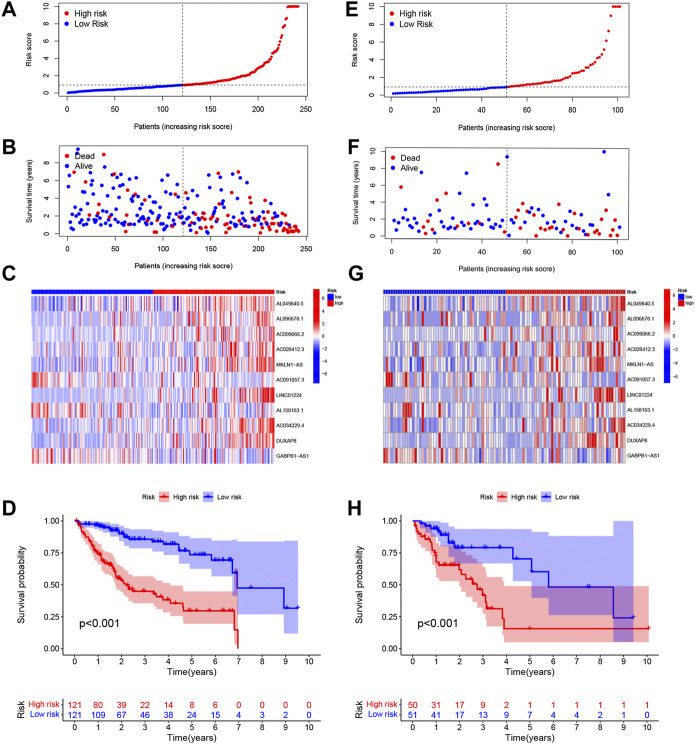
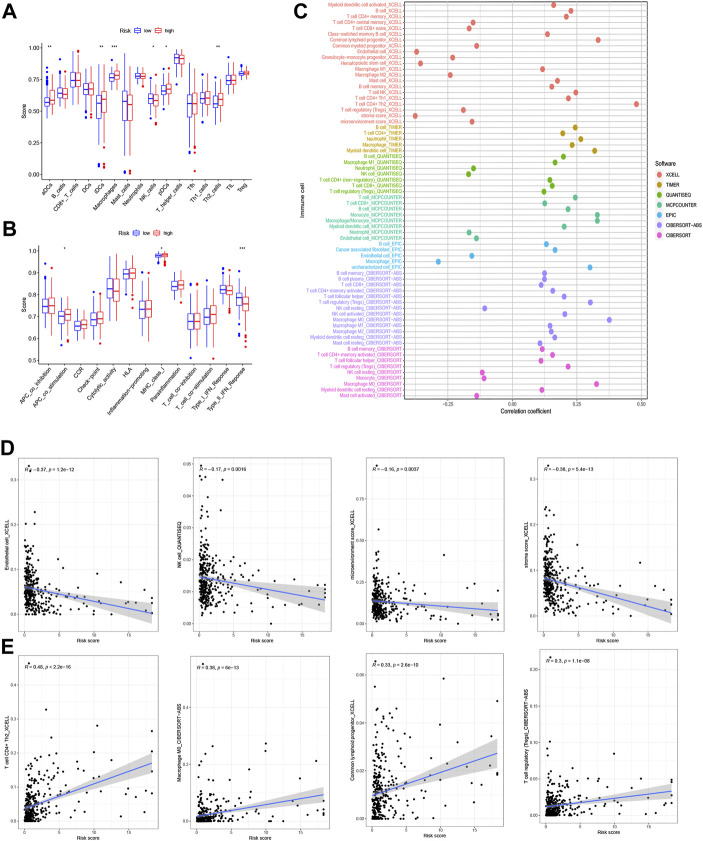
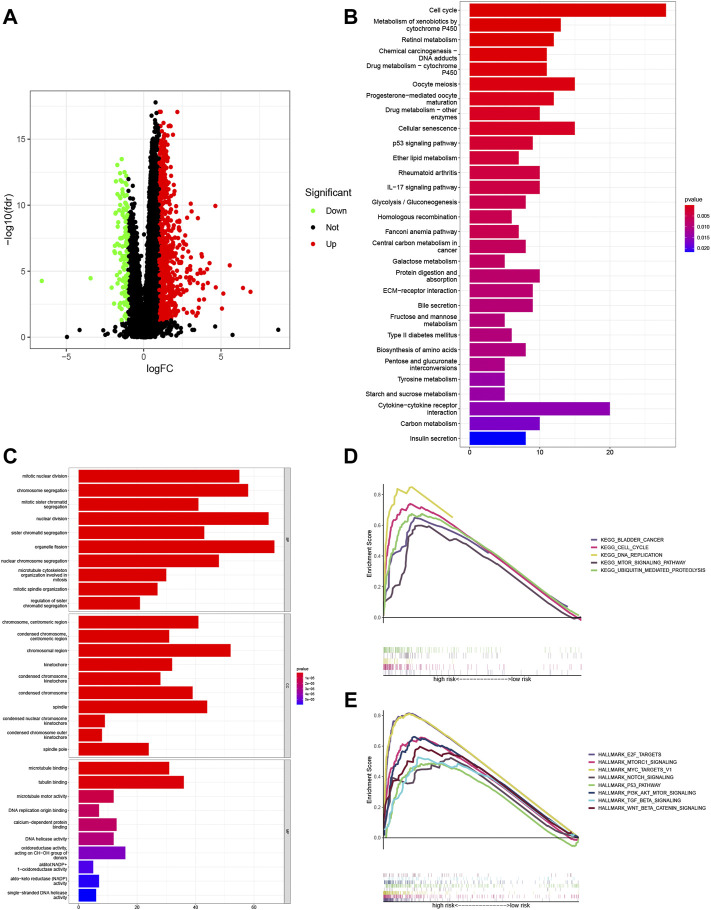
Background: Hepatocellular carcinoma (HCC), which has high rates of recurrence and metastasis and is the main reason and the most common tumor for cancer mortality worldwide, has an unfavorable prognosis. N7-methylguanosine (m7G) modification can affect the formation and development of tumors by affecting gene expression and other biological processes. In addition, many previous studies have confirmed the unique function of long noncoding RNAs (lncRNAs) in tumor progression; however, studies exploring the functions of m7G-related lncRNAs in HCC patients has been limited. Methods: Relevant RNA expression information was acquired from The Cancer Genome Atlas (TCGA, https://portal.gdc.cancer.gov), and m7G-related lncRNAs were identified via gene coexpression analysis. Afterward, univariate Cox regression, least absolute shrinkage and selection operator (LASSO) regression, and multivariate regression analyses were implemented to construct an ideal risk model whose validity was verified using Kaplan-Meier survival, principal component, receiver operating characteristic (ROC) curve, and nomogram analyses. In addition, the potential functions of lncRNAs in the novel signature were explored through Gene Ontology (GO) and Kyoto Encyclopedia of Genes and Genomes (KEGG) analyses and gene set enrichment analysis (GSEA). At last, in both risk groups and subtypes classified based on the expression of the risk-related lncRNAs, we analyzed the immune characteristics and drug sensitivity of patients. Results: After rigorous screening processes, we built a model based on 11 m7G-related lncRNAs for predicting patient overall survival (OS). The results suggested that the survival status of patients with high-risk scores was lower than that of patients with low-risk scores, and a high-risk score was related to malignant clinical features. Cox regression analysis showed that the m7G risk score was an independent prognostic parameter. Moreover, immune cell infiltration and immunotherapy sensitivity differed between the risk groups. Conclusion: The m7G risk score model constructed based on 11 m7G-related lncRNAs can effectively assess the OS of HCC patients and may offer support for making individualized treatment and immunotherapy decisions for HCC patients.

Keywords: N7-methylguanosine; hepatocellular carcinoma; immune responses; lncRNA; prognosis.


Conflict of interest statement

The authors declare that the research was conducted in the absence of any commercial or financial relationships that could be construed as a potential conflict of interest.

Figures

FIGURE 1
FIGURE 1
Construction of the model based on N7-methylguanosine (m7G)-related long noncoding RNAs (lncRNAs) in hepatocellular carcinoma (HCC). (A) Workflow of the study. (B) Prognostic lncRNAs in HCC were selected based on regression coefficient analysis. (C) Least absolute shrinkage and selection operator (LASSO) Cox regression with 10-fold cross-validation was used to determine the optimal factors for the HCC cohort. (D) Multivariate Cox regression analysis was used to identify prognostic m7G-related lncRNAs to construct an m7G-related lncRNA risk model. (E) Correlations between the expression of the differentially expressed lncRNAs and m7G genes in HCC.
FIGURE 2
FIGURE 2
Distributions of the signature risk score, survival status, and expression of relevant long noncoding RNAs (lncRNAs) in the training set (A–C) and the validation set (E–G). Kaplan–Meier survival analysis was used for the training set (D) and testing set (H) analysis.
FIGURE 3
FIGURE 3
Kaplan‐Meier (K-M) survival analysis to determine whether patient overall survival (OS) was correlated with clinical factors, including age (A,B), sex (C,D), grade(E,F), T stage (G,H), and stage (I,J).
FIGURE 4
FIGURE 4
Principal component analysis (PCA) confirms the discriminatory ability of (A) total gene expression profiles, (B) 29 N7-methylguanosine (m7G) genes, (C) m7G-related long noncoding RNAs (lncRNAs), and (D) 11 m7G-related risk lncRNAs.
FIGURE 5
FIGURE 5
Analysis of the N7-methylguanosine (m7G) risk model and other clinical characteristics. Receiver operating characteristic (ROC) curve analysis was performed, and the acreage under the curve (AUC) for 1-, 3-, and 5-year overall survival (OS) was calculated in the training dataset (A) and in the testing dataset (B) to verify the accuracy of the long noncoding RNAs (lncRNA) signature. The AUC values based on the entire set of the risk score combined with other clinicopathological factors for predicting 1- (C), 3- (D), and 5-year (E) OS demonstrated the reliability of the risk model. Risk score distribution was based on patients’ tumor/node/metastasis (TNM) stage (F–H), stage (I), and grade (J).
FIGURE 6
FIGURE 6
Analysis of the independent predictive ability of the risk score and other factors. (A,B) Univariate and multivariate Cox regression analyses were used to determine whether the risk score was an independent factor predicting survival in hepatocellular carcinoma (HCC). (C) Concordance index (CI) values were calculated to assess the independent predictive utility of the factors. (D) A nomogram including the independent prognostic factors stage and risk score was generated to predict the 1-, 3-, and 5-year overall survival (OS). The 1- (E), 2- (F), and 3-year (G) calibration plots are shown.
FIGURE 7
FIGURE 7
Analysis of immune function. (A) Abundances of 22 types of infiltrating immune cells. (B) Relationship between immune scores and a series of immune functions. (C) The relationship between the risk score and immune cell infiltration in hepatocellular carcinoma (HCC) was assessed using the XCELL, TIMER, QUANTISEQ, MCPCOUNTER, EPIC, CIBERSORT−ABS, and CIBERSORT algorithms. (D) Infiltrating immune cells negatively correlated with risk score (endothelial cell, natural killer (NK) cell, microenvironment score, stroma score). (E) Infiltrating immune cells positively correlated with risk score (T cells CD4+ Th2, macrophages M0, common lymphoid progenitor, T cell regulatory).
FIGURE 8
FIGURE 8
Enrichment analyses of the potential functions of the differentially expressed genes (DEGs). (A) Volcano plots showing the relationships of the significant differentially expressed long noncoding RNAs (lncRNAs) with upregulated, downregulated, and nondifferentially expressed genes represented by red, blue, and black, respectively. Underlying pathways and functions of the signature lncRNAs were predicted with Gene Ontology (GO) enrichment analysis (B) and Kyoto Encyclopedia of Genes and Genomes (KEGG) pathway analysis (C). Gene set enrichment analysis (GSEA) of the KEGG pathway terms (D) and HALLMARK pathway analysis (E) further revealed the possible roles of lncRNAs in the signature in the tumor.
FIGURE 9
FIGURE 9
Analysis of gene alterations and their effects based on entire set. Differential gene mutations between the high- (A) and low-risk (B) groups were determined based on the long noncoding RNA (lncRNA) signature. (C) Patient overall survival (OS) is based on tumor mutational burden (TMB). (D) Patient OS over time based on TMB and risk score.
FIGURE 10
FIGURE 10
Identification of candidate drugs based on the N7-methylguanosine (m7G) risk score. (A) Immune checkpoint expression in the whole dataset. (B) Tumor immune dysfunction and exclusion (TIDE) analysis based on the risk score. (C) Analysis of sorafenib sensitivity based on the risk score. (D) Drugs with low IC50 values in the low-risk group. (E) Drugs with low IC50 values in the high-risk group.
FIGURE 11
FIGURE 11
Consensus clustering of prognostic N7-methylguanosine (m7G)-related long noncoding RNAs (lncRNAs) and corresponding analysis. (A) Consensus matrix heatmap with 343 samples divided into Cluster 1 and Cluster 2. Principal component analysis (PCA) (B) and t-distributed stochastic neighbor embedding (t-SNE) analysis (C) were used to confirm the distinction between Cluster 1 and Cluster 2. (D) The Kaplan–Meier (K-M) curve analysis revealed the association between overall survival (OS) and risk score subtype. (E) Differential immune checkpoint gene expression in the two clusters. (F) Immune cell infiltration in the two clusters was assessed using the XCELL, TIMER, QUANTISEQ, MCPCOUNTER, EPIC, CIBERSORT−ABS, and CIBERSORT algorithms.

Similar articles

Cited by

References

    1. Aas P. A., Otterlei M., Falnes P. O., Vagbo C. B., Skorpen F., Akbari M., et al. (2003). Human and bacterial oxidative demethylases repair alkylation damage in both RNA and DNA. Nature 421 (6925), 859–863. 10.1038/nature01363 - DOI - PubMed
    1. Aran D., Hu Z., Butte A. J. (2017). xCell: digitally portraying the tissue cellular heterogeneity landscape. Genome Biol. 18 (1), 220. 10.1186/s13059-017-1349-1 - DOI - PMC - PubMed
    1. Bakhoum S. F., Ngo B., Laughney A. M., Cavallo J. A., Murphy C. J., Ly P., et al. (2018). Chromosomal instability drives metastasis through a cytosolic DNA response. Nature 553 (7689), 467–472. 10.1038/nature25432 - DOI - PMC - PubMed
    1. Becht E., Giraldo N. A., Lacroix L., Buttard B., Elarouci N., Petitprez F., et al. (2016). Estimating the population abundance of tissue-infiltrating immune and stromal cell populations using gene expression. Genome Biol. 17 (1), 218. 10.1186/s13059-016-1070-5 - DOI - PMC - PubMed
    1. Brinkman E. K., van Steensel B. (2019). Rapid quantitative evaluation of CRISPR genome editing by TIDE and TIDER. Methods Mol. Biol. 1961, 29–44. 10.1007/978-1-4939-9170-9_3 - DOI - PubMed

LinkOut - more resources