

Dynamic changes in the transcriptome landscape of Arabidopsis thaliana in response to cold stress
- PMID: 36110360
- PMCID: PMC9468617
- DOI: 10.3389/fpls.2022.983460
Dynamic changes in the transcriptome landscape of Arabidopsis thaliana in response to cold stress
Abstract
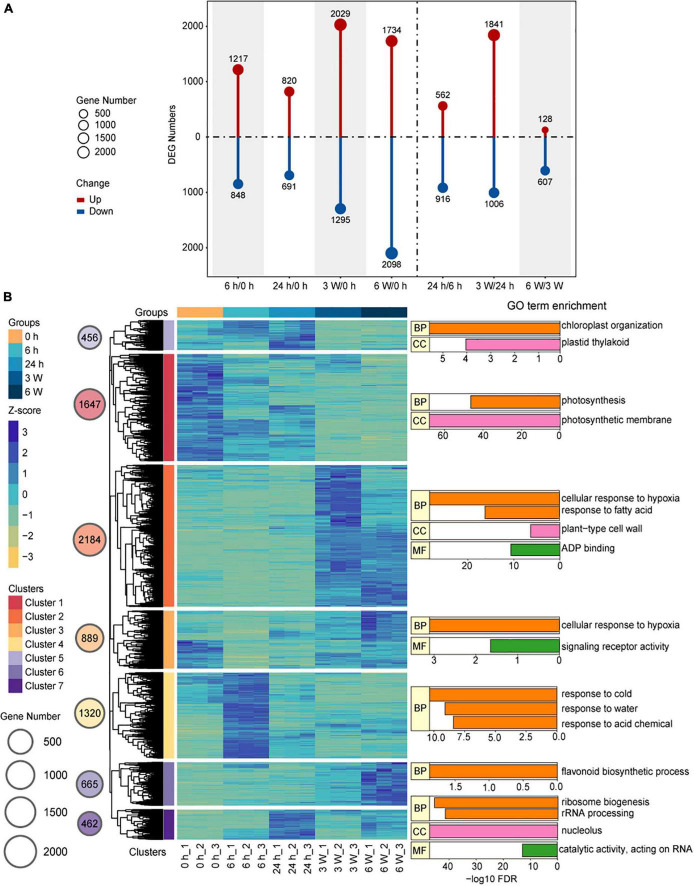
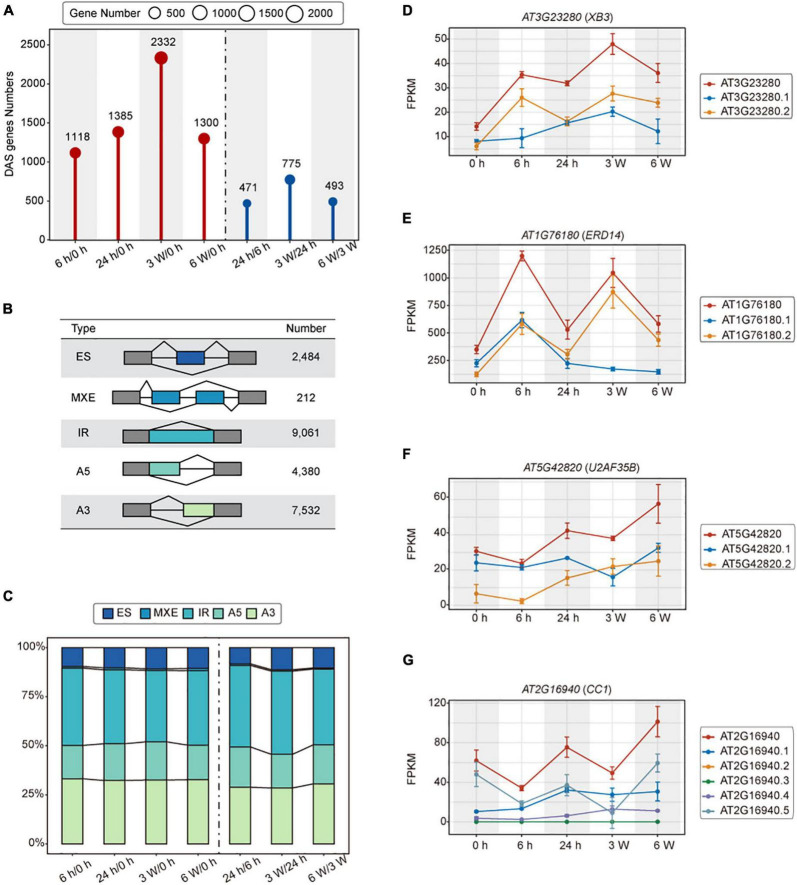
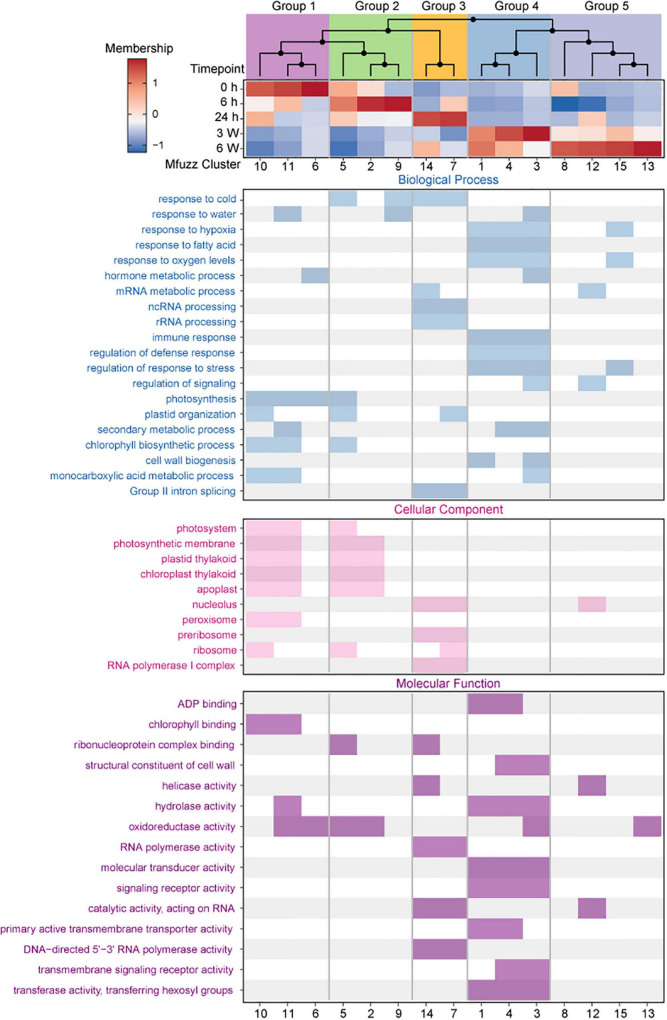
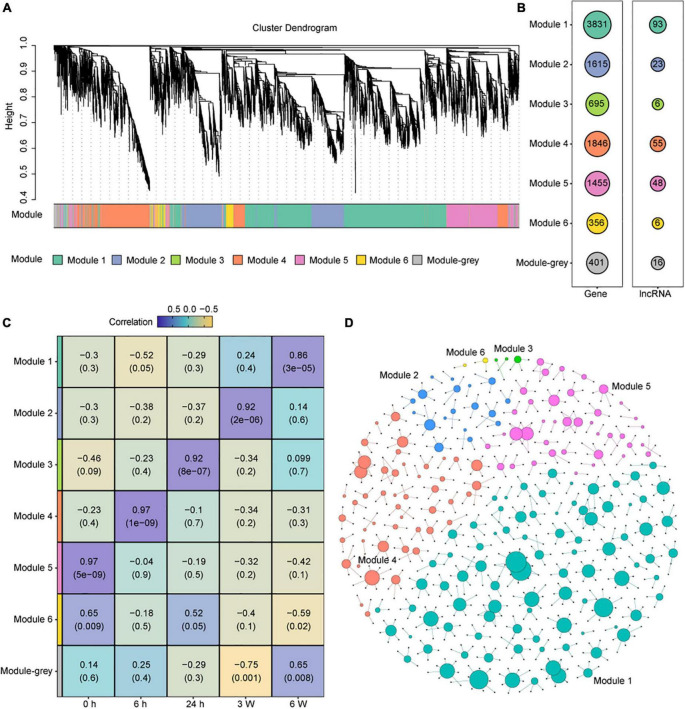
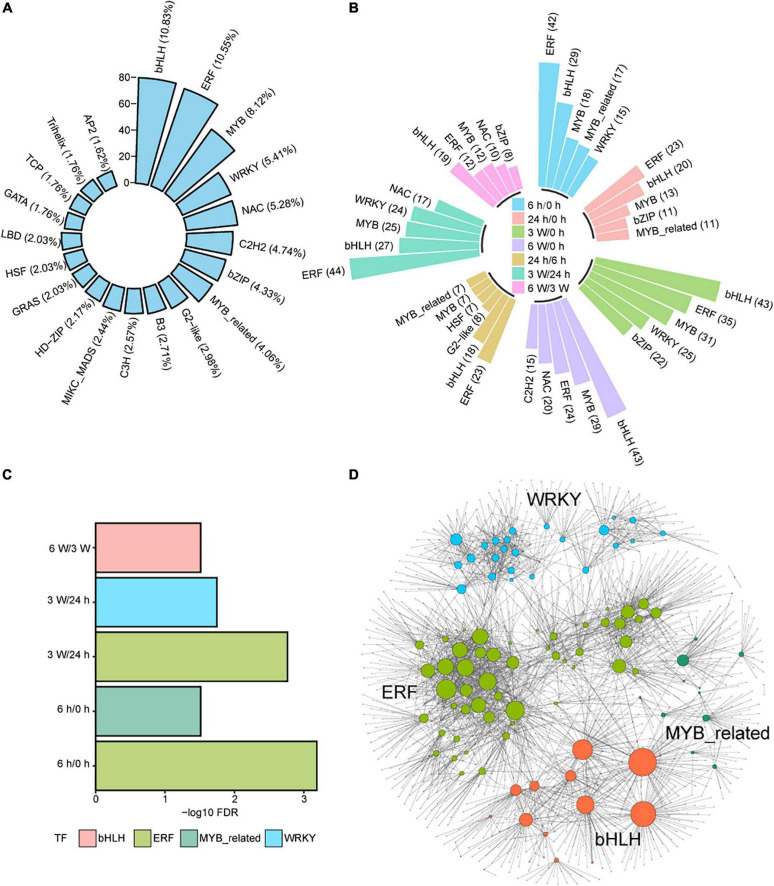
Plants must reprogram gene expression to adapt constantly changing environmental temperatures. With the increased occurrence of extremely low temperatures, the negative effects on plants, especially on growth and development, from cold stress are becoming more and more serious. In this research, strand-specific RNA sequencing (ssRNA-seq) was used to explore the dynamic changes in the transcriptome landscape of Arabidopsis thaliana exposed to cold temperatures (4°C) at different times. In total, 7,623 differentially expressed genes (DEGs) exhibited dynamic temporal changes during the cold treatments. Gene Ontology (GO) and Kyoto Encyclopedia of Genes and Genomes (KEGG) pathway enrichment analysis showed that the DEGs were enriched in cold response, secondary metabolic processes, photosynthesis, glucosinolate biosynthesis, and plant hormone signal transduction pathways. Meanwhile, long non-coding RNAs (lncRNAs) were identified after the assembly of the transcripts, from which 247 differentially expressed lncRNAs (DElncRNAs) and their potential target genes were predicted. 3,621 differentially alternatively spliced (DAS) genes related to RNA splicing and spliceosome were identified, indicating enhanced transcriptome complexity due to the alternative splicing (AS) in the cold. In addition, 739 cold-regulated transcription factors (TFs) belonging to 52 gene families were identified as well. This research analyzed the dynamic changes of the transcriptome landscape in response to cold stress, which reveals more complete transcriptional patterns during short- and long-term cold treatment and provides new insights into functional studies of that how plants are affected by cold stress.
Keywords: Arabidopsis thaliana; alternative splicing; cold stress; dynamic change; long non-coding RNA; ssRNA-seq; transcriptome landscape.
Copyright © 2022 Liu, Cai, Li, Zhang, Shi, Zhao and Yang.
Conflict of interest statement
The authors declare that the research was conducted in the absence of any commercial or financial relationships that could be construed as a potential conflict of interest.
Figures
Similar articles
-
Identification of small RNAs during cold acclimation in Arabidopsis thaliana.BMC Plant Biol. 2020 Jun 29;20(1):298. doi: 10.1186/s12870-020-02511-3. BMC Plant Biol. 2020. PMID: 32600430 Free PMC article.
-
Cold-Dependent Expression and Alternative Splicing of Arabidopsis Long Non-coding RNAs.Front Plant Sci. 2019 Feb 28;10:235. doi: 10.3389/fpls.2019.00235. eCollection 2019. Front Plant Sci. 2019. PMID: 30891054 Free PMC article.
-
Deep sequencing-based characterization of transcriptome of Pyrus ussuriensis in response to cold stress.Gene. 2018 Jun 30;661:109-118. doi: 10.1016/j.gene.2018.03.067. Epub 2018 Mar 23. Gene. 2018. PMID: 29580898
-
De novo transcriptome sequencing and gene expression profiling of Magnolia wufengensis in response to cold stress.BMC Plant Biol. 2019 Jul 18;19(1):321. doi: 10.1186/s12870-019-1933-5. BMC Plant Biol. 2019. PMID: 31319815 Free PMC article.
-
Unique and contrasting effects of light and temperature cues on plant transcriptional programs.Transcription. 2020 Jun-Aug;11(3-4):134-159. doi: 10.1080/21541264.2020.1820299. Epub 2020 Oct 4. Transcription. 2020. PMID: 33016207 Free PMC article. Review.
Cited by
-
Exploration and genetic analyses of canopy leaf pigmentation changes in soybean (Glycine max L.): unveiling a novel phenotype.Theor Appl Genet. 2024 Aug 13;137(9):202. doi: 10.1007/s00122-024-04693-y. Theor Appl Genet. 2024. PMID: 39134894 Free PMC article.
-
The Role of lncRNAs in Pig Muscle in Response to Cold Exposure.Genes (Basel). 2023 Sep 30;14(10):1901. doi: 10.3390/genes14101901. Genes (Basel). 2023. PMID: 37895249 Free PMC article.
-
Variability of plant transcriptomic responses under stress acclimation: a review from high throughput studies.Acta Biochim Pol. 2024 Oct 25;71:13585. doi: 10.3389/abp.2024.13585. eCollection 2024. Acta Biochim Pol. 2024. PMID: 39524930 Free PMC article. Review.
-
Maize transcriptome profiling reveals low temperatures affect photosynthesis during the emergence stage.Front Plant Sci. 2025 Jan 28;16:1527447. doi: 10.3389/fpls.2025.1527447. eCollection 2025. Front Plant Sci. 2025. PMID: 39935955 Free PMC article.
-
Dynamic changes in the transcriptome of tropical region-originated king grasses in response to cold stress.Front Plant Sci. 2025 Feb 18;16:1511466. doi: 10.3389/fpls.2025.1511466. eCollection 2025. Front Plant Sci. 2025. PMID: 40041019 Free PMC article.
References
LinkOut - more resources
Full Text Sources
Research Materials