

Brain disorder prediction with dynamic multivariate spatio-temporal features: Application to Alzheimer's disease and autism spectrum disorder
- PMID: 36110425
- PMCID: PMC9468323
- DOI: 10.3389/fnagi.2022.912895
Brain disorder prediction with dynamic multivariate spatio-temporal features: Application to Alzheimer's disease and autism spectrum disorder
Abstract
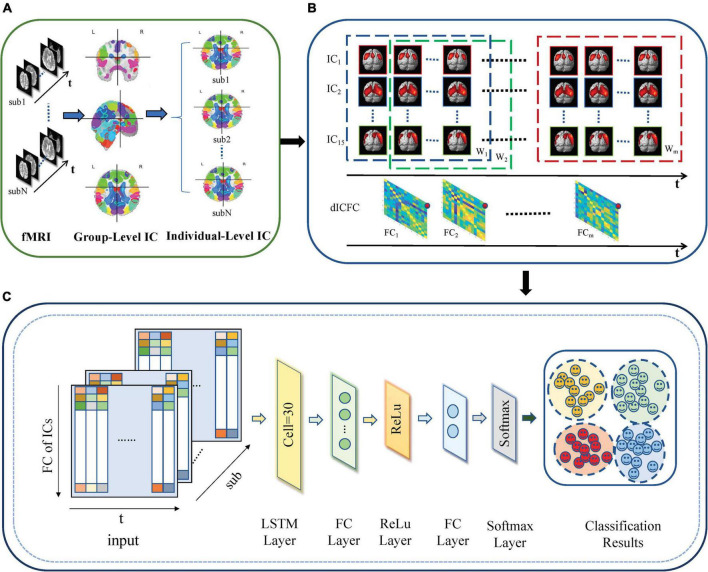
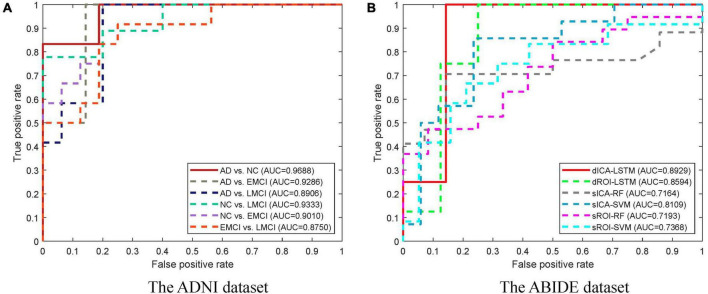
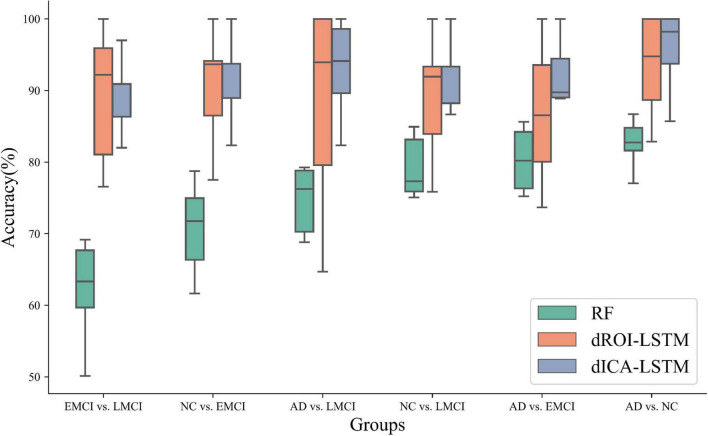
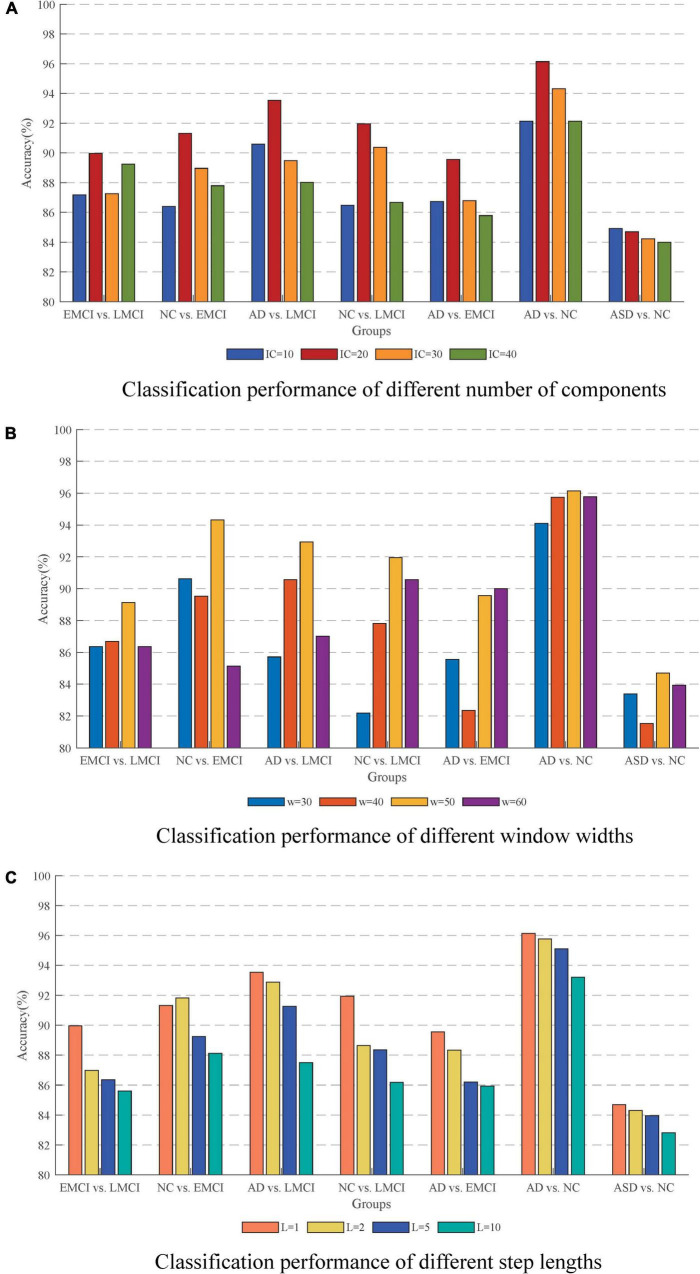
The dynamic functional connectivity (dFC) in functional magnetic resonance imaging (fMRI) is beneficial for the analysis and diagnosis of neurological brain diseases. The dFCs between regions of interest (ROIs) are generally delineated by a specific template and clustered into multiple different states. However, these models inevitably fell into the model-driven self-contained system which ignored the diversity at spatial level and the dynamics at time level of the data. In this study, we proposed a spatial and time domain feature extraction approach for Alzheimer's disease (AD) and autism spectrum disorder (ASD)-assisted diagnosis which exploited the dynamic connectivity among independent functional sub networks in brain. Briefly, independent sub networks were obtained by applying spatial independent component analysis (SICA) to the preprocessed fMRI data. Then, a sliding window approach was used to segment the time series of the spatial components. After that, the functional connections within the window were obtained sequentially. Finally, a temporal signal-sensitive long short-term memory (LSTM) network was used for classification. The experimental results on Alzheimer's Disease Neuroimaging Initiative (ADNI) and Autism Brain Imaging Data Exchange (ABIDE) datasets showed that the proposed method effectively predicted the disease at the early stage and outperformed the existing algorithms. The dFCs between the different components of the brain could be used as biomarkers for the diagnosis of diseases such as AD and ASD, providing a reliable basis for the study of brain connectomics.
Keywords: deep learning; dynamic functional connectivity; fMRI; multivariate; spatio-temporal features.
Copyright © 2022 Qiao, Wang, Liu, Xu and Wang.
Conflict of interest statement
The authors declare that the research was conducted in the absence of any commercial or financial relationships that could be construed as a potential conflict of interest.
Figures
Similar articles
-
Modeling the dynamic brain network representation for autism spectrum disorder diagnosis.Med Biol Eng Comput. 2022 Jul;60(7):1897-1913. doi: 10.1007/s11517-022-02558-4. Epub 2022 May 6. Med Biol Eng Comput. 2022. PMID: 35522357
-
Diagnosis of Autism Spectrum Disorder (ASD) by Dynamic Functional Connectivity Using GNN-LSTM.Sensors (Basel). 2024 Dec 30;25(1):156. doi: 10.3390/s25010156. Sensors (Basel). 2024. PMID: 39796946 Free PMC article.
-
Convolutional Recurrent Neural Network for Dynamic Functional MRI Analysis and Brain Disease Identification.Front Neurosci. 2022 Jul 6;16:933660. doi: 10.3389/fnins.2022.933660. eCollection 2022. Front Neurosci. 2022. PMID: 35873806 Free PMC article.
-
Classification and Prediction of Brain Disorders Using Functional Connectivity: Promising but Challenging.Front Neurosci. 2018 Aug 6;12:525. doi: 10.3389/fnins.2018.00525. eCollection 2018. Front Neurosci. 2018. PMID: 30127711 Free PMC article. Review.
-
AIMAFE: Autism spectrum disorder identification with multi-atlas deep feature representation and ensemble learning.J Neurosci Methods. 2020 Sep 1;343:108840. doi: 10.1016/j.jneumeth.2020.108840. Epub 2020 Jul 9. J Neurosci Methods. 2020. PMID: 32653384 Review.
Cited by
-
Mapping Knowledge Landscapes and Emerging Trends in AI for Dementia Biomarkers: Bibliometric and Visualization Analysis.J Med Internet Res. 2024 Aug 8;26:e57830. doi: 10.2196/57830. J Med Internet Res. 2024. PMID: 39116438 Free PMC article.
-
Spatial-Temporal Characteristics of Brain Activity in Autism Spectrum Disorder Based on Hidden Markov Model and Dynamic Graph Theory: A Resting-State fMRI Study.Brain Sci. 2024 May 17;14(5):507. doi: 10.3390/brainsci14050507. Brain Sci. 2024. PMID: 38790485 Free PMC article.
-
Triple-network analysis of Alzheimer's disease based on the energy landscape.Front Neurosci. 2023 May 23;17:1171549. doi: 10.3389/fnins.2023.1171549. eCollection 2023. Front Neurosci. 2023. PMID: 37287802 Free PMC article.
-
The diagnosis of ASD with MRI: a systematic review and meta-analysis.Transl Psychiatry. 2024 Aug 2;14(1):318. doi: 10.1038/s41398-024-03024-5. Transl Psychiatry. 2024. PMID: 39095368 Free PMC article.
References
-
- Association A. P. (2013). Diagnostic and Statistical Manual of Mental Disorders (5th ed.). Washington, DC: American Psychiatric Association.
-
- Association A. S. (2015). 2015 Alzheimer’s disease facts and figures. Alzheimers Dement. 11 332–384. - PubMed
-
- Atila O., Sengur A. (2021). Attention guided 3D CNN-LSTM model for accurate speech based emotion recognition. Appl. Acoust. 182:108260. 10.1016/j.apacoust.2021.108260 - DOI
LinkOut - more resources
Full Text Sources