. 2022 Aug 30:13:927419.
doi: 10.3389/fphar.2022.927419. eCollection 2022.

Akebia saponin D protects hippocampal neurogenesis from microglia-mediated inflammation and ameliorates depressive-like behaviors and cognitive impairment in mice through the PI3K-Akt pathway

Affiliations

Akebia saponin D protects hippocampal neurogenesis from microglia-mediated inflammation and ameliorates depressive-like behaviors and cognitive impairment in mice through the PI3K-Akt pathway

Qin Liu et al. Front Pharmacol. .

Abstract

Given the ability of akebia saponin D (ASD) to protect various types of stem cells, in the present study, we hypothesized that ASD could promote the proliferation, differentiation, and survival of neural stem/precursor cells (NSPCs), even in a microglia-mediated inflammatory environment, thereby mitigating inflammation-related neuropsychopathology. We established a mouse model of chronic neuroinflammation by exposing animals to low-dose lipopolysaccharide (LPS, 0.25 mg/kg/d) for 14 days. The results showed that chronic exposure to LPS strikingly reduced hippocampal levels of PI3K and pAkt and neurogenesis in mice. In the presen of a microglia-mediated inflammatory niche, the PI3K-Akt signaling in cultured NSPCs was inhibited, promoting their apoptosis and differentiation into astrocytes, while decreasing neurogenesis. Conversely, ASD strongly increased the levels of PI3K and pAkt and stimulated NSPC proliferation, survival and neuronal differentiation in the microglia-mediated inflammatory niche in vitro and in vivo. ASD also restored the synaptic function of hippocampal neurons and ameliorated depressive- and anxiety-like behaviors and cognitive impairment in mice chronically exposed to LPS. The results from network pharmacology analysis showed that the PI3K-AKT pathway is one of the targets of ASD to against major depressive disorder (MDD), anxiety and Alzheimer's disease (AD). And the results from molecular docking based on computer modeling showed that ASD is bound to the interaction interface of the PI3K and AKT. The PI3K-Akt inhibitor LY294002 blocked the therapeutic effects of ASD in vitro and in vivo. These results suggested that ASD protects NSPCs from the microglia-mediated inflammatory niche, promoting their proliferation, survival and neuronal differentiation, as well as ameliorating depressive- and anxiety-like behaviors and cognitive impairment by activating the PI3K-AKT pathway. Our work suggests the potential of ASD for treating Alzheimer's disease, depression and other cognitive disorders involving impaired neurogenesis by microglia-mediated inflammation.

Keywords: PI3K-Akt signaling pathway; akebia saponin D; cognitive impairment; depression; microglia; neural stem/precursor cell; neurogenesis; neuroinflammation.


Conflict of interest statement

The authors declare that the research was conducted in the absence of any commercial or financial relationships that could be construed as a potential conflict of interest.

Figures

FIGURE 1
FIGURE 1
Effects of ASD on NSPC proliferation, survival and neuronal differentiation in the presence or absence of a microglia-mediated inflammatory niche. (A), Scheme describing the experimental evaluation of the effects of akebia saponin D (ASD) on survival of neurospheres in the presence or absence of an inflammatory niche. Microglia were treated with phosphate-buffered saline (PBS) or lipopolysaccharide (LPS) for 24 h, and the microglia-conditioned medium (M-CM) was collected. Neural stem/precursor cells (NSPCs) were treated with different concentrations of ASD (0, 10, 50, or 100 μM) in the presence of PBS-M-CM or LPS-M-CM. Brain-derived neurotrophic factor (BDNF) at 50 ng/ml was used as control. NSPC proliferation was measured after 4 days in culture; differentiation, after 5 days; and survival, after 7 days. (B), Micrographs and quantification of neurosphere size under different treatment conditions. Scale bar, 100 μm. (C), Micrographs and quantification of pleiotropic NSPC differentiation under different treatment conditions. Astrocytes were labeled with antibody against GFAP (green); neurons, with antibody against microtubule-associated protein 2 (MAP2) (red). Scale bar, 50 μm. (D), Micrographs and quantification of NSPC survival under different treatment conditions. Surviving NSPCs were labeled with BrdU (green). Scale bar, 20 μm. Results for each group were averaged from 5 micrographs (40×) from each of 4-6 slides. Data are mean ± standard error of the mean (SEM). *p < 0.05, **p < 0.01 vs. control microglia conditioned medium (PBS-M-CM), #p < 0.05, ##p < 0.01, ###p < 0.001 vs. LPS-treated microglia conditioned medium (LPS-M-CM) by two-way ANOVA with Tukey’s multiple-comparisons test.
FIGURE 2
FIGURE 2
ASD protects NSPCs from the microglia-mediated inflammatory niche by activating the PI3K-AKT pathway. (A), Western blotting showing activation of the PI3K-AKT pathway in NSPCs after ASD treatment (100 μM) in the presence of PBS-M-CM or LPS-M-CM. Levels of PI3K and AKT were normalized to those of β-actin, and levels of phospho-AKT (p-AKT) were normalized to those of AKT. Ctrl, control without ASD. (B), Micrographs and quantification of neurosphere size, showing that the PI3K-AKT pathway inhibitor LY294002 blocked the effects of ASD on neurosphere proliferation in the presence of PBS-M-CM or LPS-M-CM. Scale bar, 100 μm. (C), Micrographs and quantification of the percentage of MAP2+ cells, showing that LY294002 also blocked the effects of ASD on neurogenesis in the presence of PBS-M-CM or LPS-M-CM. Astrocytes were labeled with antibody against GFAP (green); neurons, with antibody against MAP2 (red). Scale bar, 50 μm. (D), Micrographs and quantification of the percentage of BrdU + cells, showing that LY294002 blocked the effects of ASD on NSPC survival in the presence of LPS-M-CM. Surviving NSPCs were labeled with BrdU (green). Scale bar, 20 μm. Results for each group were averaged from 5 micrographs (40×) from each of 4-6 slides. Data are mean ± standard error of the mean (SEM), *p < 0.05, **p < 0.01, ***p < 0.001 vs. control microglia conditioned medium (PBS-M-CM), #p < 0.05, ##p < 0.01, ###p < 0.001 vs. LPS-treated microglia conditioned medium (LPS-M-CM), &p < 0.05, &&p < 0.01 vs. ASD + PBS-treated microglia conditioned medium (ASD + PBS-M-CM), @p < 0.05 vs. ASD + LPS-treated microglia conditioned medium (ASD + LPS-M-CM) by two-way ANOVA with Tukey’s multiple-comparisons test.
FIGURE 3
FIGURE 3
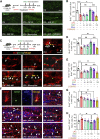
ASD activates the PI3K-Akt pathway in hippocampus of mice chronically exposed to LPS. (A), Scheme of the experimental procedure. ASD, akebia saponin D; DMSO, dimethyl sulphoxide; ELISA, enzyme-linked immunosorbent assay; EPMT, elevated plus maze test; FST, forced swimming test; IHC, immunocytochemistry; LPS, lipopolysaccharide; Mino, minocycline; NORT, novel object recognition test; SPT, sucrose preference test; WB, western blotting. (B,C), Western blotting shows the levels of PI3K and pAkt in the hippocampus of mice treated with saline (Ctrl) or lipopolysaccharide (LPS), then with akebia saponin D (ASD), minocycline (Mino) or PI3K-Akt inhibitor (LY294002). Levels of PI3K were normalized to those of β-actin, and levels of pAkt were normalized to those of Akt. Data are mean ± standard error of the mean (SEM) (n = 4), ***p < 0.001 vs. Ctrl group, #p < 0.05, ##p < 0.01, ###p < 0.001 vs. LPS group, &&&p < 0.001 vs. ASD (100 mg/kg) + LPS group based on one-way ANOVA with Tukey’s multiple-comparisons test.
FIGURE 4
FIGURE 4
Effects of ASD on NSPC proliferation and differentiation in dentate gyrus of mice chronically exposed to LPS. (A), Timeline for detecting proliferation of neural stem/progenitor cells (NSPCs) based on immunofluorescence micrographs of BrdU + cells in dentate gyrus (DG) of mice. Proliferating NSPCs were labeled using 5′-bromo-2′deoxyuridine (BrdU) (green). Scale bar, 100 μm. (B), Quantification of hippocampal BrdU + cells. Five mice from each group were examined, and five hippocampal micrographs (40×) from each animal were quantified. (C), Timeline for evaluating NSPC differentiation based on immunofluorescence micrographs of BrdU + -DCX + cells in dentate gyrus (DG) of mice. Proliferating NSPCs were labelled with BrdU (green); immature neurons, with antibody against doublecortin (DCX); and newborn neurons differentiated from NSPCs, with both BrdU and anti-DCX antibody (white arrowheads). Scale bar, 100 μm. (D), Quantification of the hippocampal BrdU + -DCX + cells in each slice. (E), Quantification of the percentage of total BrdU + cells in the DG that were BrdU + -DCX+. (F), Immunofluorescence micrographs of BrdU + -GFAP + cells in the DG. Proliferating NSPCs were labelled with BrdU (green); astrocytes, with antibody against GFAP; and newborn astrocytes differentiated from NSPCs, with BrdU and anti-GFAP antibody (white arrowheads). Scale bar, 100 μm. (G), Quantification of hippocampal BrdU + -GFAP + cells in each slice. (H), Quantification of the percentage of total BrdU + cells in the DG that were BrdU + -GFAP+. Five mice from each group were examined, and five hippocampal micrographs (40×) from each animal were quantified. Each dot in the bar graph represents the average of all micrographs for each mouse. Data are mean ± standard error of the mean (SEM) (n = 5), *p < 0.05, ***p < 0.001 vs. Ctrl group, #p < 0.05, ##p < 0.01, ###p < 0.001 vs. LPS group, &&p < 0.01, &&&p < 0.001 vs. ASD (100 mg/kg) + LPS group by one-way ANOVA with Tukey’s multiple-comparisons test. Each dot in the bar graph represents the average of all micrographs for each mouse.
FIGURE 5
FIGURE 5
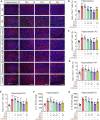
Effects of ASD on survival and maturation of newborn neurons in dentate gyrus of mice chronically exposed to LPS. (A), Timeline for evaluating newborn neuron survival and maturation based on immunofluorescence micrographs of BrdU + -NeuN + cells in the dentate gyrus of mice. Surviving cells were labelled with BrdU (green); mature neurons, with antibody against neuron-specific nucleoprotein (NeuN); and mature neurons differentiated from NSPCs, with both BrdU and anti-NeuN antibody (white arrowheads). Scale bar, 100 μm. (B), Quantification of hippocampal BrdU + cells in each slice. (C), Quantification of hippocampal BrdU + -NeuN + cells in each slice. (D), Quantification of the percentage of total BrdU + cells in DG that were BrdU + -NeuN+. Five mice from each group were examined, and five hippocampal micrographs (40×) from each animal were quantified. Each dot in the bar graph represents the average of all micrographs for each mouse. Data are mean ± standard error of the mean (SEM) (n = 5), **p < 0.01, ***p < 0.001 vs. Ctrl group, ##p < 0.01, ###p < 0.001 vs. LPS group, &p < 0.05, &&&p < 0.001 vs. ASD (100 mg/kg) + LPS group by one-way ANOVA with Tukey’s multiple-comparisons test.
FIGURE 6
FIGURE 6
Effects of ASD on synaptic function in hippocampus of mice chronically exposed to LPS. (A,B), Western blotting shows the levels of GluA1 and GluA2 in the hippocampus of mice treated with saline (Ctrl) or lipopolysaccharide (LPS), then with akebia saponin D (ASD), minocycline (Mino) or PI3K-Akt inhibitor (LY294002). Levels of GluA1 and GluA2 were normalized to those of β-actin. Figures 6A,B share the same β-actin. Data are mean ± standard error of the mean (SEM) (n = 4), *p < 0.05, ***p < 0.001 vs. Ctrl group, #p < 0.05, ###p < 0.001 vs. LPS group, &p < 0.05 vs. ASD (100 mg/kg) + LPS group based on one-way ANOVA with Tukey’s multiple-comparisons test.
FIGURE 7
FIGURE 7
Effects of ASD on microglia, astrocyte numbers and IL-1β levels in neurogenic niche of mice chronically exposed to LPS. (A), Representative fluorescence micrographs showing the morphology and density of microglia in the hippocampus of mice treated with saline (Ctrl) or lipopolysaccharide (LPS), followed by akebia saponin D (ASD) or minocycline. Microglia were labeled with antibody against ionized calcium binding adapter molecule 1 (Iba1) (red) and nuclei, with 4’,6-diamidino-2-phenylindole (DAPI) (blue). Scale bar, 100 μm. (B–E), Quantification of the percentages of total area containing Iba1+ cells in hippocampal CA3 (C), CA1 (D) and dentate gyrus (DG) (E) for evaluating changes in the morphology and density of microglia. Five mice from each group were examined, and five hippocampal micrographs (40×) from each animal were quantified. Each dot in the bar graph represents the average of all micrographs for each mouse. (F,G), Quantification of the concentration of IL-1β in hippocampus and hippocampal DG as an index of neuroinflammation. Data are mean ± standard error of the mean (SEM) (n = 5), *p < 0.05, **p < 0.01, ***p < 0.001 vs. Ctrl group, #p < 0.05, ##p < 0.01, ###p < 0.001 vs. LPS group by one-way ANOVA with Tukey’s multiple-comparisons test.
FIGURE 8
FIGURE 8
Effects of ASD on depressive-like behaviors of mice chronically exposed to LPS in the presence or absence of PI3K-Akt inhibitor. (A), Changes in sucrose preference of individual saline-treated (Ctrl) or lipopolysaccharide (LPS)-treated mice, before treatment (day 0) and afterward (day 14). (B), Changes in sucrose preference following treatment with akebia saponin D (ASD), minocycline (Mino) or PI3K-Akt inhibitor (LY294002) for 14 days. (C–E), Effects of ASD on immobility time and latency in the forced swimming test. Data are mean ± standard error of the mean (SEM) (n = 8-11). Panel (A): ***p < 0.001 vs. basal (0-days) by a paired Student’s t test for. Panels (B), (D) and (E): *p < 0.05, ***p < 0.001 vs. Ctrl group, ##p < 0.01, ###p < 0.001 vs. LPS group, &&p < 0.01, &&&p < 0.001 vs. ASD (100 mg/kg) + LPS group by one-way ANOVA with Tukey’s multiple-comparisons test.
FIGURE 9
FIGURE 9
Effects of ASD on anxiety-like behaviors of mice chronically exposed to LPS in the presence or absence of PI3K-Akt inhibitor. (A), Scheme describing the experimental evaluation of anxiety-like behaviors of mice using the elevated plus maze test, and the heatmap of mouse behavior in this test. (B,C), Changes in open-arm entries and time in open-arms in mice treated with saline (Ctrl) or lipopolysaccharide (LPS), followed by akebia saponin D (ASD), minocycline (Mino) or PI3K-Akt inhibitor (LY294002) for 14 days. Data are mean ± standard error of the mean (SEM) (n = 8-11). *p < 0.05, ***p < 0.001 vs. Ctrl group, ##p < 0.01, ###p < 0.001 vs. LPS group, &p < 0.05, &&&p < 0.001 vs. ASD (100 mg/kg) + LPS group by one-way ANOVA with Tukey’s multiple-comparisons test.
FIGURE 10
FIGURE 10
Effects of ASD on cognitive impairment of mice chronically exposed to LPS in the presence or absence of PI3K-Akt inhibitor. (A), Scheme describing the experimental evaluation of mice using the novel object recognition test, and heatmap of mouse behavior in this test. (B), Mice showed a preference for the novel item, regardless of whether it replaced the familiar object on the right or left. (C), Comparison of preference for the novel or familiar object. (D), Scheme describing the experimental evaluation of learning and memory using the Morris water maze test. (E), Morris water maze latency of mice treated with saline (Ctrl) or lipopolysaccharide (LPS), followed by akebia saponin D (ASD), minocycline or PI3K-Akt inhibitor (LY294002). Data are mean ± standard error of the mean (SEM) (n = 8-11). Panels (B) and (C): *p < 0.05, ***p < 0.001 vs. left (B) or novel (C) by a paired Student’s t-test. Panel (E): *p < 0.05, **p < 0.01, ***p < 0.001 vs. Ctrl group, #p < 0.05, ##p < 0.01, ###p < 0.001 vs. LPS group, &&p < 0.01, &&&p < 0.001 vs. ASD (100 mg/kg) + LPS group by one-way ANOVA with Tukey’s multiple-comparisons test.
FIGURE 11
FIGURE 11
Pharmacological mechanisms of ASD against disorders involving impaired neurogenesis. (A), Venn diagram summarizing the intersection targets of the akebia saponin D (ASD), major depressive disorder (MDD), anxiety and Alzheimer’s disease (AD). (B), KEGG analysis of key targets of ASD in treatment of MDD, anxiety and AD. Bubble plot of top 20 KEGG pathways. (C,D), Molecular docking diagram of ASD (green) to target PI3K (C) and Akt (D). The yellow lines represent the hydrogen bond interaction force, which is the main force promoting molecule binding with the active site. The blue positions indicate the amino acid residues of the receptors (PI3K/AKT).
FIGURE 12
FIGURE 12
Schematic diagram of how akebia saponin D may protect hippocampal neurogenesis. Akebia saponin D activates the PI3K-Akt pathway to protect NSPCs from the microglia-mediated inflammatory niche, promoting their proliferation, survival and neuronal differentiation, as well as ameliorating depressive- and anxiety-like behaviors and cognitive impairment.

Similar articles

Cited by

References

    1. Alavi S., Darharaj M., Bilehsavar S. H., Amini M., Zafarghandi M. B. S., Berenji V., et al. (2021). Successful use of minocycline for the treatment of methamphetamine-induced psychosis and cognitive impairments: An open-label case series. Clin. Neuropharmacol. 44, 126–131. 10.1097/WNF.0000000000000460 - DOI - PubMed
    1. Anacker C., Hen R. (2017). Adult hippocampal neurogenesis and cognitive flexibility - linking memory and mood. Nat. Rev. Neurosci. 18, 335–346. 10.1038/nrn.2017.45 - DOI - PMC - PubMed
    1. Araki T., Ikegaya Y., Koyama R. (2021). The effects of microglia- and astrocyte-derived factors on neurogenesis in health and disease. Eur. J. Neurosci. 54, 5880–5901. 10.1111/ejn.14969 - DOI - PMC - PubMed
    1. Babcock K. R., Page J. S., Fallon J. R., Webb A. E. (2021). Adult hippocampal neurogenesis in aging and Alzheimer's disease. Stem Cell. Rep. 16, 681–693. 10.1016/j.stemcr.2021.01.019 - DOI - PMC - PubMed
    1. Bassani T. B., Bonato J. M., Machado M. M. F., Cóppola-Segovia V., Moura E. L. R., Zanata S. M., et al. (2018). Decrease in adult neurogenesis and neuroinflammation are involved in spatial memory impairment in the streptozotocin-induced model of sporadic Alzheimer's disease in rats. Mol. Neurobiol. 55, 4280–4296. 10.1007/s12035-017-0645-9 - DOI - PubMed

LinkOut - more resources