. 2022 Aug 30:13:999470.
doi: 10.3389/fimmu.2022.999470. eCollection 2022.

CRISPR/Cas9 based blockade of IL-10 signaling impairs lipid and tissue homeostasis to accelerate atherosclerosis

Affiliations

CRISPR/Cas9 based blockade of IL-10 signaling impairs lipid and tissue homeostasis to accelerate atherosclerosis

Haozhe Shi et al. Front Immunol. .

Abstract

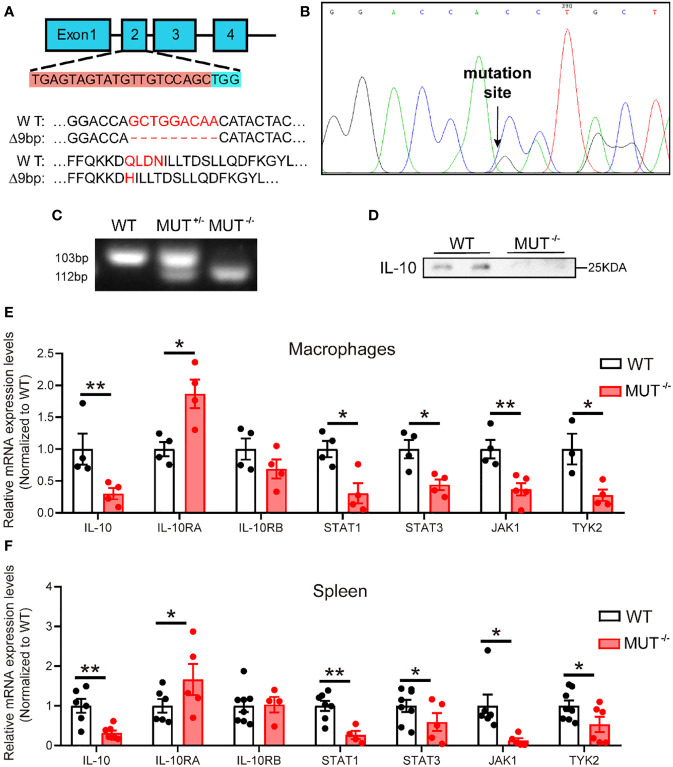
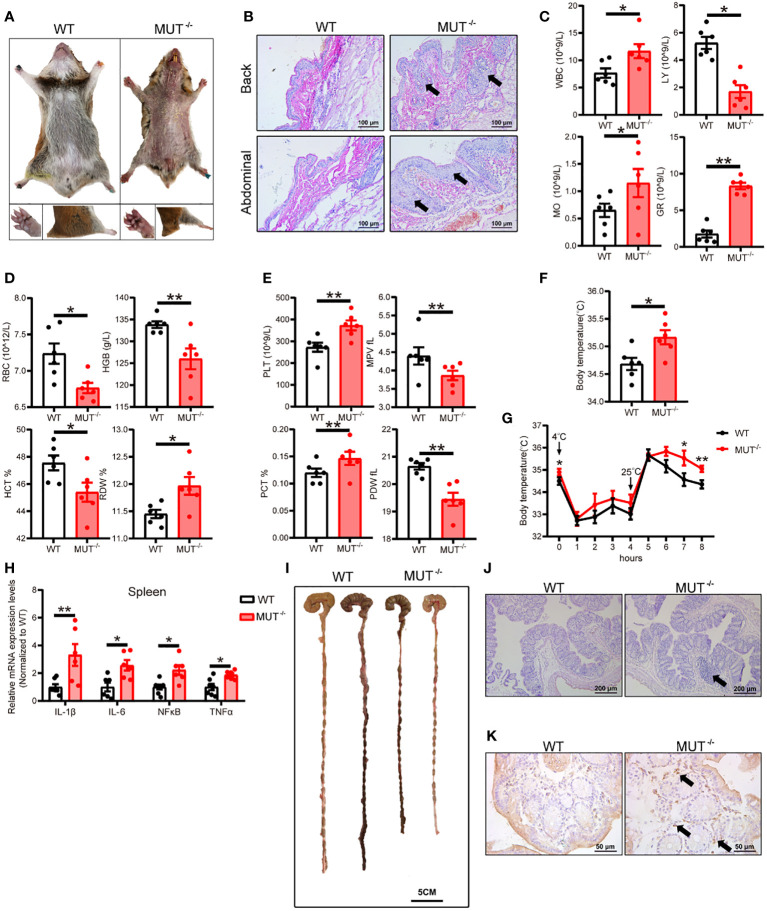
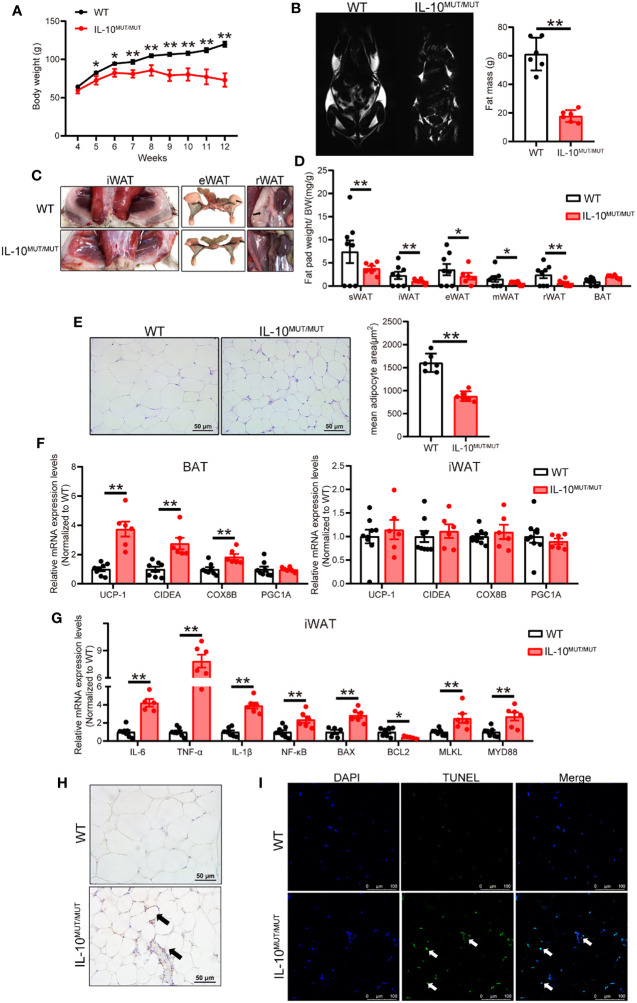
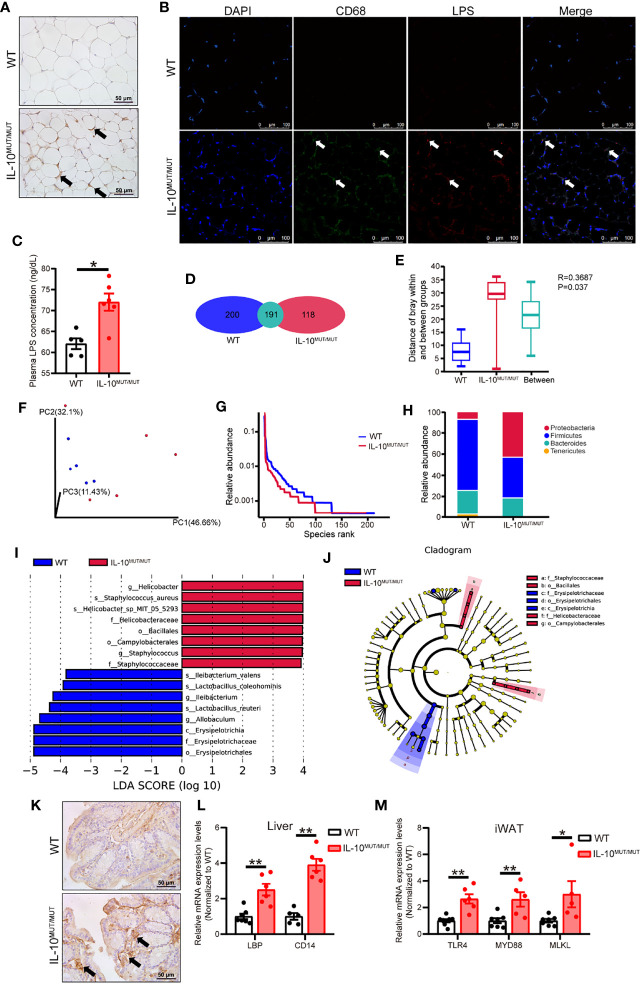
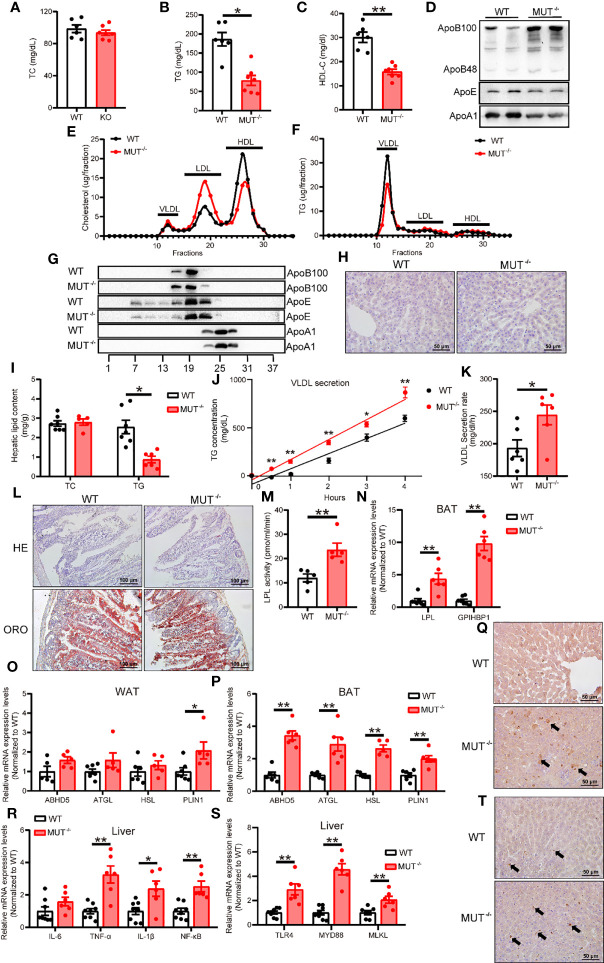
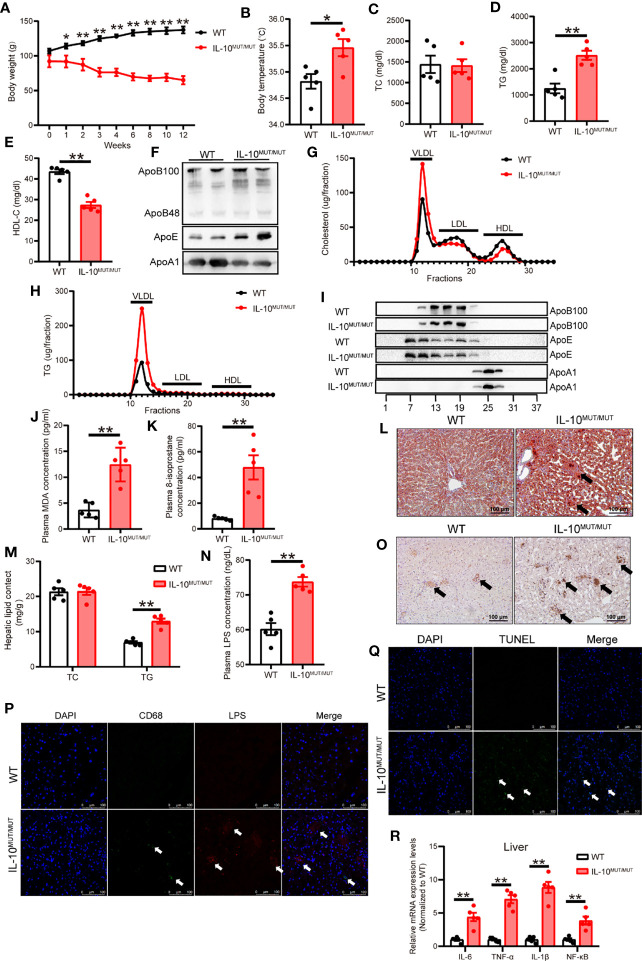
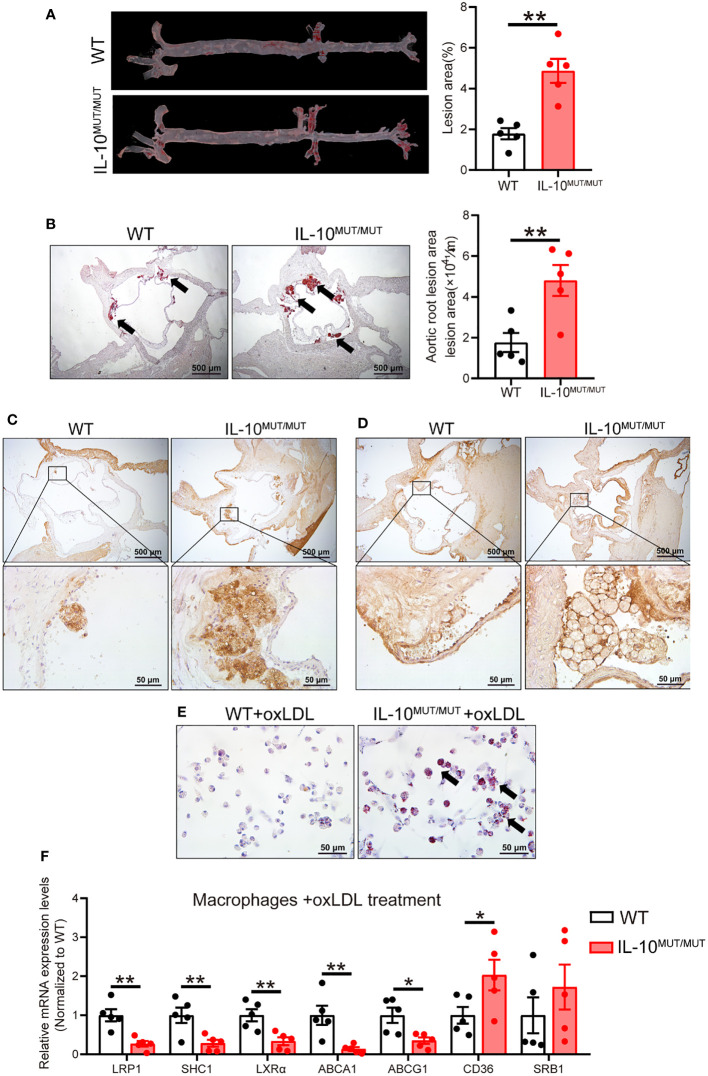
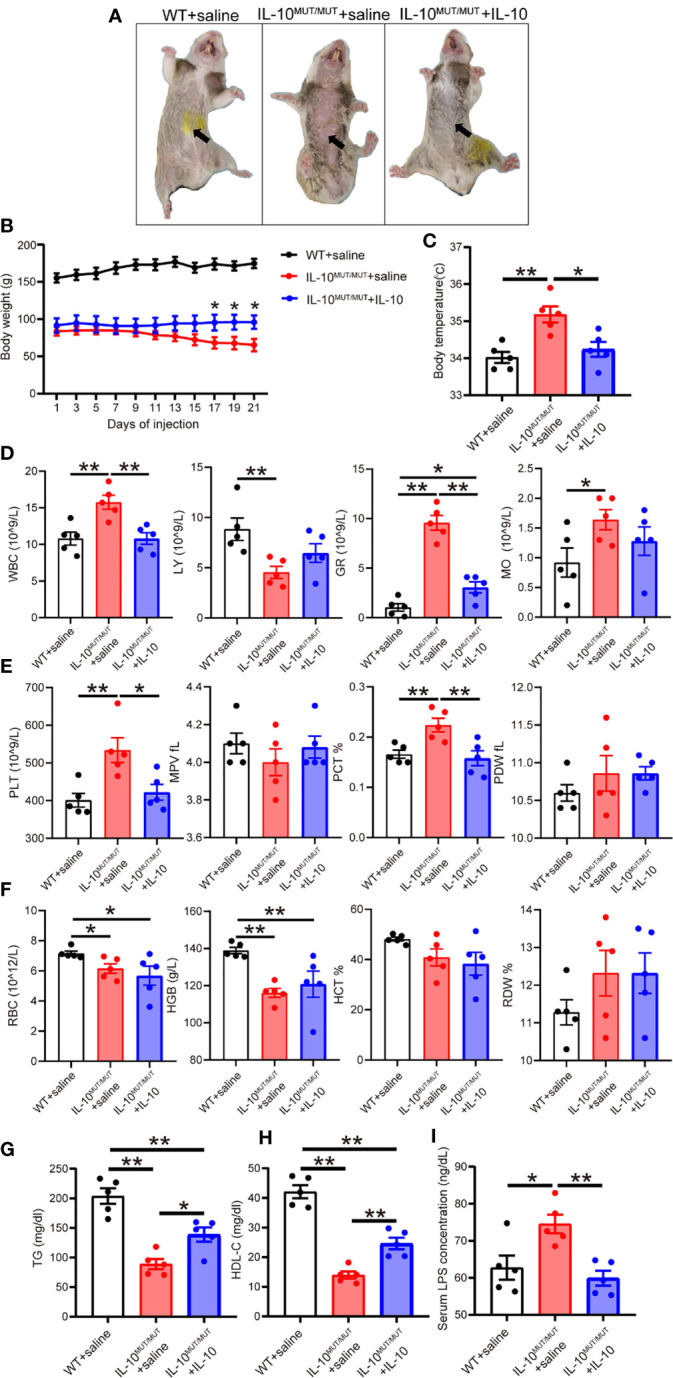
Interleukin-10 (IL-10) is a widely recognized immunosuppressive factor. Although the concept that IL-10 executes an anti-inflammatory role is accepted, the relationship between IL-10 and atherosclerosis is still unclear, thus limiting the application of IL-10-based therapies for this disease. Emerging evidence suggests that IL-10 also plays a key role in energy metabolism and regulation of gut microbiota; however, whether IL-10 can affect atherosclerotic lesion development by integrating lipid and tissue homeostasis has not been investigated. In the present study, we developed a human-like hamster model deficient in IL-10 using CRISPR/Cas9 technology. Our results showed that loss of IL-10 changed the gut microbiota in hamsters on chow diet, leading to an increase in lipopolysaccharide (LPS) production and elevated concentration of LPS in plasma. These changes were associated with systemic inflammation, lipodystrophy, and dyslipidemia. Upon high cholesterol/high fat diet feeding, IL-10-deficient hamsters exhibited abnormal distribution of triglyceride and cholesterol in lipoprotein particles, impaired lipid transport in macrophages and aggravated atherosclerosis. These findings show that silencing IL-10 signaling in hamsters promotes atherosclerosis by affecting lipid and tissue homeostasis through a gut microbiota/adipose tissue/liver axis.

Keywords: CRISPR/Cas9; Syrian golden hamster; atherosclerosis; gut microbiota; interleukin-10.


Conflict of interest statement

The authors declare that the research was conducted in the absence of any commercial or financial relationships that could be construed as a potential conflict of interest.

Figures

Figure 1
Figure 1
Generation and characterization of IL-10 mutant hamster model using CRISPR/Cas9 gene editing system. (A) Schematic of targeting the exon 2 of hamster IL-10 gene. The sgRNA and PAM sequences (TGG) are highlighted with orange and blue background, respectively. Mismatched nucleotide bases and amino acids are marked in red. (B) Sequencing of CRISPR/Cas9-edited IL-10 locus in Founder. Double peaks appeared at the mutation site. (C) Genotyping of F2 generations from wild type (WT), heterozygous (IL-10WT/MUT), and homozygous (IL-10MUT/MUT) IL-10 mutant hamsters. (D) Representative Western blot of plasma IL-10 from 3-month-old male WT and IL-10MUT/MUT hamsters on chow diet. (E and F) mRNA expression levels of genes involved in IL-10 signaling pathway in macrophages (E) and spleen (F) were determined by real-time PCR (n=4~7/group). All data were expressed as means ± SEM, *p<0.05; **p<0.01.
Figure 2
Figure 2
IL-10MUT/MUT hamsters on a regular chow diet exhibited severe spontaneous systemic inflammation. (A) Representative images of 3-months old male WT and IL-10MUT/MUT hamsters on chow diet. (B) Skin at the Back and abdominal areas of WT and IL-10MUT/MUT hamsters was stained with HE. Bars: 100 μm; arrows indicate immune cell infiltration. (C, D and E) The blood biochemical characteristics of WT and IL-10MUT/MUT hamsters (n=6/group). (F) Body temperature of WT and IL-10MUT/MUT hamsters (n=6/group). (G) Body temperature curve of WT and IL-10MUT/MUT hamsters exposed to different stimuli (n=6/group). (H) Expression levels of proinflammatory markers in spleen were determined by real-time PCR (n=6/group). (I) Representative images of colon tissue from WT and IL-10MUT/MUT hamsters. Bars: 5 cm. (J) Morphological analysis of colons stained with HE for WT and IL-10MUT/MUT hamsters. Bars: 500 μm; arrows indicate immune cell infiltration (K) Immunohistochemistry of CD68 in the colons from WT and IL-10MUT/MUT hamsters. Bars: 50 μm; arrows indicate positive staining. All data were expressed as means ± SEM, *p<0.05; **p<0.01.
Figure 3
Figure 3
IL-10 deficiency caused severe white adipose tissue (WAT) dystrophy in chow-fed hamsters. (A) Body weight curve of WT and IL-10MUT/MUT hamsters on chow diet (n=6/group). (B) Representative MRI images and total fat mass analyzed by MRI of 3-month-old male WT and IL-10MUT/MUT hamsters (n=6/group). (C) Representative images of iWAT, eWAT and rWAT from WT and IL-10MUT/MUT hamsters. Arrows indicate WAT. (D) Analysis of the ratio of fat weight and body weight for different types of adipose tissues from 3-months old WT and IL-10MUT/MUT hamsters (n=6~8/group). (E) Representative images of iWAT (left) and quantification of adipocyte area (right) (n=6/group). (F) Expression levels of genes regulating thermogenesis in BAT (left) and iWAT (right) were determined by real-time PCR (n=5~7/group). (G) Expression levels of genes involved in inflammation and apoptosis in iWAT were determined by real-time PCR (n=5~7/group). (H) Immunohistochemistry of CD68 in the iWAT from WT and IL-10MUT/MUT hamsters. Bars: 50 μm; arrows indicate positive staining. (I) TUNEL staining (green) in the iWAT from WT (top) and IL-10MUT/MUT (bottom) hamsters. Nuclei were stained with DAPI (blue). Bars: 100 μm; white arrows indicate positive staining.All date were expressed as means ± SEM, *p<0.05; **p<0.01.
Figure 4
Figure 4
Loss of IL-10 disrupted the profile and products of gut microbiota in IL-10MUT/MUT hamsters on chow diet. (A) Immunohistochemistry of LPS in the iWAT from WT and IL-10MUT/MUT hamsters. Bars: 50 μm; arrows indicate positive staining. (B) Cryo-sections of iWAT from WT (top) and IL-10MUT/MUT (bottom) hamsters were double-stained with CD68 (green) and LPS (red) antibodies. Nuclei were stained with DAPI (blue). Bars: 100 μm; white arrows indicate positive staining. (C) Plasma LPS levels were determined from WT and IL-10MUT/MUT hamsters (n=5/group). (D) Analysis of the total number of OTUs present in WT hamsters (bule), IL-10MUT/MUT hamsters (red) or overlap in both groups (Cyan). (E) Boxplots depicting differences in gut microbiota diversity in WT hamsters, IL-10MUT/MUT hamsters and both the two groups. (F) Weighted Unifrac distance based analysis of PCoA. WT group was shown in blue, while the IL-10MUT/MUT group was indicated in red. (G) Analysis of Rank abundance curves in WT and IL-10MUT/MUT hamsters. The x-axis indicates the order number ranked by the OTUs abundance and Y-axis shows the relative abundance of OTUs. (H) The relative abundance of top 4 species at the levels of phylum in WT and IL-10MUT/MUT hamsters. (I) LEfSe comparison of the gut microbiota between WT (bule) and IL-10MUT/MUT (red) hamsters. LDA score >3 are shown. The length of the bar represents the LDA score. (J) LEfSe analysis of cladogram of significant changes at all taxonomic levels in WT and IL-10MUT/MUT hamsters. The diameter of each circle is proportional to its abundance. (K) Immunohistochemistry of LPS in the colon from WT (left) and IL-10MUT/MUT (right) hamsters. Bars: 50 μm; arrows indicate positive staining. (L) Expression levels of LBP and CD14 in liver were determined by real-time PCR (n=5/group). (M) Expression levels of TLR4, MYD88 and MLKL in iWAT were determined by real-time PCR (n=5/group). All date were expressed as means ± SEM, *p<0.05; **p<0.01.
Figure 5
Figure 5
Chow-fed IL-10MUT/MUT hamsters displayed abnormal lipid metabolism. (A, B and C) Determination of plasma TC (A), TG (B) and HDL-C (C) from 3-month old WT and IL-10MUT/MUT hamsters on chow diet after overnight fasting (n=6~7/group). (D) Representative Western blots of plasma ApoB, ApoE and ApoA1 from WT and IL-10MUT/MUT hamsters. (E, F) Pooled plasma from the two groups were analyzed by FPLC. Triglyceride (E) and cholesterol (F) contents in different fractions of pooled plasma from WT and IL-10MUT/MUT hamsters were measured (n = 6/group). (G) Representative Western blots of ApoB, ApoE and ApoA1 in different fractions of pooled plasma from WT and IL-10MUT/MUT hamsters as described in Figures 5E, F . (H) Cryo-sectionings of liver tissues were stained with oil red O. Bars: 50 μm. (I) Hepatic TC and TG contents were measured and normalized to liver weight (n=6~7/group). (J, K) VLDL secretion was analyzed in hamsters after intraperitoneal injection P-407 (1500 mg/kg, n=6/group). (L) HE and Oil red O stainings of intestinal tissues of WT and IL-10MUT/MUT hamsters 4 h after oral gavage of olive oil (10 ml/kg body weight). (M) Measurement of plasma LPL activities were in WT and IL-10MUT/MUT hamsters. (N) Expression levels of LPL and GPIHBP1 in BAT were determined by real-time PCR (n=5/group). (O, P) Expression levels of genes involved in lipolysis in WAT (O) and BAT (P) were determined by real-time PCR (n=5/group). (Q) Immunohistochemistry of LPS in the liver from WT (top) and IL-10MUT/MUT (bottom) hamsters. Bars: 50 μm; arrows indicate positive staining. (R) Expression levels of TLR4, MYD88 and MLKL in liver were determined by real-time PCR (n=6~7/group). (S) Expression levels of inflammatory factors in liver were determined by real-time PCR (n=6/group). (T) Immunohistochemistry of CD68 in the liver from WT (top) and IL-10MUT/MUT (bottom) hamsters. Bars: 50 μm; arrows indicate positive staining. All date were expressed as means ± SEM, *p<0.05; **p<0.01.
Figure 6
Figure 6
Dyslipidemia was aggravated in IL-10MUT/MUT hamsters on HFD. (A) Body weight curve of WT and IL-10MUT/MUT hamsters on HFD for 12 weeks (n=5/group). (B) Body temperature of WT and IL-10MUT/MUT hamsters on HFD (n=5/group). (C, D and E) Plasma TC (C), TG (D) and HDL-C (E) from WT and IL-10MUT/MUT hamsters on HFD (n=5/group). (F) Representative Western blots of plasma ApoB, ApoE and ApoA1 from WT and IL-10MUT/MUT hamsters on HFD. (G, H) Pooled plasma from the two groups were analyzed by FPLC. Triglyceride (E) and cholesterol (F) contents in different fractions of pooled plasma from WT and IL-10MUT/MUT hamsters on HFD (n = 6/group). (I) Representative Western blots of ApoB (top), ApoE (middle) and ApoA1 (bottom) in different fractions. (J, K) Plasma MDA (J) and 8-isoprostane (K) concentration from WT and IL-10MUT/MUT hamsters on HFD (n=5/group). (L) Oil red O stainings of liver tissue of WT and IL-10MUT/MUT hamsters on HFD. Bars: 50 μm. Arrows indicate lipid accumulation. (M) Hepatic TC and TG contents were measured in HFD-fed animals. (n=6~7/group). (N) Plasma LPS levels from WT and IL-10MUT/MUT hamsters on HFD (n=5/group). All values are means ± SEM, **, p<0.01. (O) Immunohistochemistry of CD68 in the liver from WT (left) and IL-10MUT/MUT (right) hamsters on HFD. Bars: 50 μm; arrows indicate positive stainings. (P) Cryo-sections of liver from WT (top) and IL-10MUT/MUT (bottom) hamsters on HFD were double-stained with CD68 (green) and LPS (red) antibodies. Nuclei were stained with DAPI (blue). Bars: 100 μm; white arrows indicate positive stainings. (Q) TUNEL staining (green) in the iWAT from WT (top) and IL-10MUT/MUT (bottom) hamsters on HFD. Nuclei were stained with DAPI (blue). Bars: 100 μm; white arrows indicate positive stainings. (R) Expression levels of inflammatory factors in liver were determined by real-time PCR (n=5/group). All values are means ± SEM, **p<0.01. All date were expressed as means ± SEM, *p<0.05; **p<0.01.
Figure 7
Figure 7
IL-10 deficiency accelerated atherosclerotic development in HFD-fed hamsters. (A, B) Analysis of atherosclerotic lesions in whole aorta (A) and sectioned aortic roots (B). Representative images were shown in left panel and quantification was analyzed in right panel (n=5/group). Arrows indicate ORO-positive lesions. (C, D) Immunohistochemistry of CD68 (C) and LPS (D) in aortic roots from WT and IL-10MUT/MUT hamsters on HFD. Bars: 500 μm (top) and 50 μm (bottom). (E) Representative photomicrographs of macrophages stained with ORO. Bars: 50 μm. Arrows indicate ORO positive cells. (F) Expression levels of genes involved in lipid uptake and RCT were determined by real-time PCR (n=5/group). All date were expressed as means ± SEM, *p<0.05; **p<0.01.
Figure 8
Figure 8
Short-term injection of rhIL-10 corrected the abnormal phenotypes of IL-10MUT/MUT hamsters on chow diet. (A) Representative images of WT hamsters injected with saline (WT + saline), IL-10MUT/MUT hamsters injected with saline (IL-10MUT/MUT + saline) and IL-10MUT/MUT hamsters intraperitoneally injected with rhIL-10 for 21 days (1 μg/kg/day, IL-10MUT/MUT + IL-10). (B) Body weight curve of WT + saline, IL-10MUT/MUT + saline and IL-10MUT/MUT + IL-10 hamsters (n=5/group). (C) Body temperature of WT + saline, IL-10MUT/MUT + saline and IL-10MUT/MUT + IL-10 hamsters on day 21 after injection (n=5/group). (D, E and F) The blood biochemical characteristics of WT + saline, IL-10MUT/MUT + saline and IL-10MUT/MUT + IL-10 hamsters on day 21 after rhIL-10 injection (n=5/group). (G, H) Plasma TG (G) and HDL-C (H) from WT + saline, IL-10MUT/MUT + saline and IL-10MUT/MUT + IL-10 hamsters on day 21 after injection (n=5/group). (I) Plasma LPS level from WT + saline, IL-10MUT/MUT + saline and IL-10MUT/MUT + IL-10 hamsters on day 21 after injection (n=5/group). All date were expressed as means ± SEM, *p<0.05; **p<0.01.

Similar articles

Cited by

References

    1. Wolf D, Ley K. Immunity and inflammation in atherosclerosis. Circ Res (2019) 124(2):315–27. doi: 10.1161/CIRCRESAHA.118.313591 - DOI - PMC - PubMed
    1. Libby P. Inflammation in atherosclerosis. Nature (2002) 420(6917):868–74. doi: 10.1038/nature01323 - DOI - PubMed
    1. Arnett DK, Blumenthal RS, Albert MA, Buroker AB, Goldberger ZD, Hahn EJ, et al. . 2019 ACC/AHA guideline on the primary prevention of cardiovascular disease: A report of the American college of Cardiology/American heart association task force on clinical practice guidelines. Circulation (2019) 140(11):e596–646. doi: 10.1161/CIR.0000000000000725 - DOI - PMC - PubMed
    1. Ouyang W, O'Garra A. IL-10 family cytokines IL-10 and IL-22: from basic science to clinical translation. Immunity (2019) 50(4):871–91. doi: 10.1016/j.immuni.2019.03.020 - DOI - PubMed
    1. Zhu L, Shi T, Zhong C, Wang Y, Chang M, Liu X, et al. . IL-10 and IL-10 receptor mutations in very early onset inflammatory bowel disease. Gastroenterol Res (2017) 10(2):65–9. doi: 10.14740/gr740w - DOI - PMC - PubMed

Publication types