. 2022 Aug 30:13:913275.
doi: 10.3389/fimmu.2022.913275. eCollection 2022.

RelB contributes to the survival, migration and lymphomagenesis of B cells with constitutively active CD40 signaling

Affiliations

RelB contributes to the survival, migration and lymphomagenesis of B cells with constitutively active CD40 signaling

Laura B Kuhn et al. Front Immunol. .

Abstract

Activation of CD40-signaling contributes to the initiation, progression and drug resistance of B cell lymphomas. We contributed to this knowledge by showing that constitutive CD40-signaling in B cells induces B cell hyperplasia and finally B cell lymphoma development in transgenic mice. CD40 activates, among others, the non-canonical NF-ĸB signaling, which is constitutively activated in several human B cell lymphomas and is therefore presumed to contribute to lymphopathogenesis. This prompted us to study the regulatory role of the non-canonical NF-ĸB transcription factor RelB in lymphomagenesis. To this end, we crossed mice expressing a constitutively active CD40 receptor in B cells with conditional RelB-KO mice. Ablation of RelB attenuated pre-malignant B cell expansion, and resulted in an impaired survival and activation of long-term CD40-stimulated B cells. Furthermore, we found that hyperactivation of non-canonical NF-кB signaling enhances the retention of B cells in the follicles of secondary lymphoid organs. RNA-Seq-analysis revealed that several genes involved in B-cell migration, survival, proliferation and cytokine signaling govern the transcriptional differences modulated by the ablation of RelB in long-term CD40-stimulated B cells. Inactivation of RelB did not abrogate lymphoma development. However, lymphomas occurred with a lower incidence and had a longer latency period. In summary, our data suggest that RelB, although it is not strictly required for malignant transformation, accelerates the lymphomagenesis of long-term CD40-stimulated B cells by regulating genes involved in migration, survival and cytokine signaling.

Keywords: B cell lymphoma; CD40; IL9R; LILRB4; RelB; migration; non-canonical NF-ĸB-signaling; transgenic mice.


Conflict of interest statement

The authors declare that the research was conducted in the absence of any commercial or financial relationships that could be construed as a potential conflict of interest.

Figures
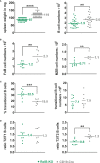
Figure 1
Figure 1
Slightly reduced B cell numbers in the spleen of RelB-KO mice: (A) Splenic weight and splenic B cell numbers (CD19+) of RelB-KO and CD19-Cre mice (controls). N≥ 24 mice. (B) Total numbers of MZB (CD21highCD23low) and FoB (CD21intCD23high) cells gated as indicated in Suppl. Figure 3B. N≥ 6 mice. (A, B) Unpaired two-tailed t-test was performed. Due to their log-normal distribution the values were logarithmized before statistical analyses. (C) Percentages and total numbers of B220+AA4.1+ transitional B cells N≥ 8 mice. Statistical analyses were conducted with an unpaired two-tailed t-test with Welch´s correction for the percentages, and with an unpaired two-tailed t-test after logarithmic transformation for cell numbers. (D) Ratio of the percentages of T2 to T1 and T3 to T2 cells in each mouse. N≥ 8 mice. Unpaired two-tailed t-test was performed. Dots represent values from individual mice, and the lines and numbers indicate the means. ** P<0.01, *** P<0.001, **** P<0.0001.
Figure 2
Figure 2
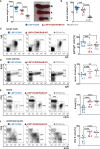
Inactivation of RelB in LMP1/CD40 mice leads to reduced B cell numbers in secondary lymphoid organs: (A) Splenic weight and size of the indicated genotypes. N≥21. (B) Splenic B cell numbers in the indicated genotypes. N≥17. (C) Percentages of IgM+IgD+ B cells in inguinal lymphnodes. FACS plots are pre-gated on live lymphocytes. LMP1/CD40 N=7; LMP1/CD40//RelB-KO N=10; CD19-Cre N=14. (D) Percentages of recirculating B cells in the BM. FACS plots are pre-gated on live lymphocytes. Recirculating B cells were determined as IgM+B220high. LMP1/CD40 N=7; LMP1/CD40//RelB-KO N=6; CD19-Cre N=8. (E) Percentages of B cells (CD19+) and T cells (CD3+) in the blood. Plots are pre-gated on live lymphocytes. The graph compiles the percentages of CD19+ B cells from different independent experiments. LMP1/CD40 N=9; LMP1/CD40//RelB-KO N=11; CD19-Cre N=10. (F) Percentages of B1a (B220lowCD5+) and B2 (B220+CD5) cells in the peritoneal lavage. FACS plots are pre-gated on live lymphocytes. The graph compiles the percentages of B1a cells. LMP1/CD40 N=6; LMP1/CD40//RelB-KO N=6; CD19-Cre N=9. (A–F) Due to their lognormal distribution values were logarithmized before statistical analysis with an ordinary one-way ANOVA, Tukey´s multiple comparisons test with * P<0.05, ** P<0.01, *** P<0.001, **** P<0.0001. (A–F) Symbols represent values from individual mice, and the lines and numbers indicate the means.
Figure 3
Figure 3
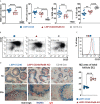
CD21highCD23low cells are still expanded in RelB-deficient LMP1/CD40 mice: (A) Total cell numbers and percentages of FoB and MZB cells in the spleen. N≥13 individual mice per genotype. Ordinary one-way ANOVA with Tukey’s multiple comparison was performed with * P<0.05, ** P<0.01, *** P<0.001, **** P<0.0001. Values were logarithmized before statistical analysis. Symbols represent values from individual mice, and the lines indicate the means. (B) Representative FACS plots to differentiate MZB (CD21highCD23low) and FoB (CD21+CD23+) cells. FACS plots are pre-gated on live B220+ lymphocytes. (C) Overlay of the CD21 surface expression of splenic B lymphocytes from mice with the indicated genotypes. (D) Splenic sections from the indicated genotypes were stained with an anti-IgM (red) antibody to detect B cells and an anti-Moma-1 (blue) antibody to visualize metallophilic macrophages lining the Marginal Zone sinus. One representative experiment is shown; N=3 independent experiments. The graph depicts the percentages of the marginal zone area within the total follicle area from the indicated genotypes. Areas were determined in 7 different follicles using ImageJ as described in Materials and Methods. Supplementary Figure 7 shows an example of MZ zone delineation. Unpaired two-tailed t test was performed with **** P<0.0001.
Figure 4
Figure 4
Impaired survival and activation of CD40-stimulated B cells in the absence of RelB: (A) Splenic B cells from mice with the indicated genotypes were cultured for up to 5 days in vitro. On days 0, 3 and 5, the percentage of live cells (TO-PRO-3) was determined by FACS. N=5 independent experiments. An ordinary two-way ANOVA, Tukey´s multiple comparisons test was performed. (B) Splenic B cells from the indicated genotypes were stimulated for 3 days with an agonistic anti-CD40 antibody or BAFF or were kept unstimulated. Indicated are the percentages of live cells (TO-PRO-3). The graph compiles the percentages of live cells on day 0 and day 3 from N=7 (anti-CD40) and N≥3 (BAFF) independent experiments. Statistical analysis was performed with an ordinary two-way ANOVA, Sidak´s multiple comparisons test. (C) Surface expression of the indicated activation markers was determined by FACS. For each marker, one representative histogram overlay is shown. The histograms are pre-gated on live lymphocytes and CD19+ cells. The graphs summarize the mean fluorescence intensities (MFI) of the indicated surface markers in the indicated genotypes from N≥5 independent experiments. The average of the MFI of the controls was used to normalize each sample. Due to their log normal distribution, values were logarithmized before calculating the statistics with an ordinary one-way ANOVA with Tukey’s multiple comparison. P-values in (A–C) * P<0.05, ** P<0.01, *** P<0.001, **** P<0.0001. (B, C) Symbols represent values from individual mice, and the lines or bars indicate means.
Figure 5
Figure 5
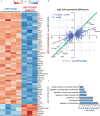
The non-canonical NF-ĸB pathway regulates genes involved in B cell survival, migration and cytokine signaling: RNA-Seq analysis was performed in two rounds. In round 1, the RNA expression profile of splenic B cells from N=4 LMP1/CD40 and N=3 LMP1/CD40//RelB-KO mice was compared, whereas in round 2, the differences in the expression profiles of N=4 LMP1/CD40 and N=4 CD19-Cre mice were examined. (A) The heat map shows the most significant differentially expressed genes between RelB-deficient and proficient LMP1/CD40 expressing B cells. The genes indicated in red were further analyzed. (B) Comparison of differentially expressed genes between RelB-proficient vs deficient LMP1/CD40 cells and LMP1/CD40 vs CD19-Cre cells. log2-fold differential gene expression values of all commonly expressed genes of both RNAseq analyses are plotted. A cut off at padj < 0.05 for differentially expressed genes was applied to the data from the LMP1/CD40 vs CD19-Cre analysis. Top hits are additionally marked with gene names. The resulting 2670 shared genes strongly correlated (p<0.0001) in differential expression values, the R2 value of the fitted linear regression trendline (blue, with 95% confidence intervals dotted) was added. Genes located along the green line show similar log2-fold expression differences in both RNAseq analyses. Strikingly, RelB-dependent genes with the highest log2-fold changes are located along this diagonal. (C) A gene ontology overrepresentation test was performed with the top 528 differentially regulated genes between LMP1/CD40 and LMP1/CD40//RelB-KO mice (from Suppl. Excel Table 1) using the online tool at [http://pantherdb.org/]. In the graph, a selection of the most significantly overrepresented GO terms for biological processes is depicted.
Figure 6
Figure 6
Lilrb4a and Il9r are differentially expressed at the RNA and protein level in RelB-proficient in comparison to RelB-deficient LMP1/CD40 expressing B cells: (A, B) The amount of mRNA of the indicated genes was determined in splenic B cells from LMP1/CD40 (blue), LMP1/CD40//RelB-KO (red) and control (CD19-Cre, grey) mice by qRT-PCR. Due to their log normal distribution, expression values of Ackr3, Lilrb4a and Il-9R were logarithmized before statistical analysis by an ordinary one-way ANOVA, Tukey´s multiple comparisons test. Ackr3 N≥4; Cnr1 N≥4; Lilrb4a N≥3; IL-9R N≥3 independent RNA preparations. (C) The histogram overlays show the surface expression of LILRB4 and IL-9R in the indicated genotypes. The histograms are pre-gated on live lymphocytes and CD19+ cells. The graphs give the summary of MFIs from independent experiments. LILRB4 N≥6; IL-9R N≥4. Ordinary one-way ANOVA with Tukey’s multiple comparison was performed. (A–C) P-values in * P<0.05, ** P<0.01, *** P<0.001, **** P<0.0001. Symbols represent values from individual mice, and the lines indicate means. n.s. = not significant.
Figure 7
Figure 7
RelB-dependent upregulation of LILRB4 and IL-9R upon CD40-stimulation: (A) MACS purified B cells were cultured in the presence of an agonistic anti-CD40 antibody or were left unstimulated for two days. The surface expression of LILRB4 and IL-9R was determined by FACS. Representative histogram overlays of unstimulated and CD40-stimulated B cells from RelB-KO and CD19-Cre control mice are shown. The histograms are pre-gated on live cells. The graphs compile the values of N=6 independent experiments. For normalization, the individual values were divided by the average of the unstimulated controls. Due to their log-normal distributions, values were logarithmically transformed before statistical analysis with an ordinary two-way ANOVA, Tukey´s multiple comparisons test. (B) The proliferation of splenic B cells isolated from mice with the indicated genotypes was analyzed after CSFE staining. In the upper row, splenic B cells were cultured with and without IL9 stimulation for three days. In the lower row, cells were additionally stimulated with CD40. Representative histogram overlays of the CFSE staining of stimulated and unstimulated B cells from the indicated genotypes are shown. The histograms are pre-gated on live cells. The graphs compile the division rates in the individual samples from N=4 (LMP1/CD40; LMP1/CD40//RelB-KO) and N=6 (RelB-KO; CD19-Cre) mice. Statistics were calculated by an ordinary two-way ANOVA, Tukey´s multiple comparisons test. (C) Representative FACS plot for the detection of IL-9 producing T cells. The FACS plot shows an overlay of CD4+ T cells stained with an anti-IL-9 antibody (red) or the corresponding isotype control (black) in the indicated genotypes (control: CD19-Cre). The gates for IL-9 positive cells was set according to the isotype control. The graph compiles the percentages of IL-9+CD4+ T cells from N=3 independent experiments. Ordinary one-way ANOVA with Tukey’s multiple comparison was performed. (A–C) p-values are indicated as * P<0.05, ** P<0.01, *** P<0.001, **** P<0.0001. Dots represent values from individual mice, and the lines indicate means. n.s. = not significant.
Figure 8
Figure 8
Inactivation of RelB reduces the lymphoma incidence in LMP1/CD40 mice: (A) The graph depicts the splenic weights of LMP1/CD40, LMP1/CD40//RelB-KO and CD19-Cre control mice at different ages. (B, C) Splenic B and T cell numbers of mice with the indicated genotypes with different ages. (A–C) Values were log-normal distributed and were therefore logarithmized before statistics was calculated with an ordinary two-way ANOVA, Tukey´s multiple comparisons test N≥6 (D) Representative FACS plots of the splenic CD21/CD23 B cell populations from aged mice with the indicated genotypes. The mice were at an approximate age of 1 year. FACS plots are pre-gated on live lymphocytes and CD19+ B cells. (E) The graph compiles the percentages of the CD21lowCD23low B cell population in mice with the genotypes and age as indicated. An ordinary two-way ANOVA, Tukey´s multiple comparisons test was used in statistical analysis. N≥4. (A–C, E) P values are indicated as * P<0.05, ** P<0.01, *** P<0.001, **** P<0.0001. Symbols represent values from individual mice, and the lines indicate means. (F) Monoclonal B cell populations were determined by Southern blot analysis using a radioactive JH probe as shown in (Supplementary Figure 14). The graph compiles the results of individual mice. Black dots indicate individual mice analyzed at the indicated time point. Mice were analyzed when they showed signs of disease, had a clearly palpatable splenomegaly or reached an age of 19 months. For statistical analysis a log-rank (Mantle Cox) test was performed.

Similar articles

Cited by

References

    1. Sun SC. The non-canonical NF-kappaB pathway in immunity and inflammation. Nat Rev Immunol (2017) 17(9):545–58. doi: 10.1038/nri.2017.52 - DOI - PMC - PubMed
    1. Taniguchi K, Karin M. NF-kappaB, inflammation, immunity and cancer: coming of age. Nat Rev Immunol (2018) 18(5):309–24. doi: 10.1038/nri.2017.142 - DOI - PubMed
    1. Yu L, Li L, Medeiros LJ, Young KH. NF-kappaB signaling pathway and its potential as a target for therapy in lymphoid neoplasms. Blood Rev (2017) 31(2):77–92. doi: 10.1016/j.blre.2016.10.001 - DOI - PMC - PubMed
    1. Weih F, Carrasco D, Durham SK, Barton DS, Rizzo CA, Ryseck RP, et al. . Multiorgan inflammation and hematopoietic abnormalities in mice with a targeted disruption of RelB, a member of the NF-kappa B/Rel family. Cell (1995) 80(2):331–40. doi: 10.1016/0092-8674(95)90416-6 - DOI - PubMed
    1. Weih DS, Yilmaz ZB, Weih F. Essential role of RelB in germinal center and marginal zone formation and proper expression of homing chemokines. J Immunol (2001) 167(4):1909–19. doi: 10.4049/jimmunol.167.4.1909 - DOI - PubMed