. 2022 Aug 30:12:959806.
doi: 10.3389/fonc.2022.959806. eCollection 2022.

Endocytosis of the thrombopoietin receptor Mpl regulates megakaryocyte and erythroid maturation in mice

Affiliations

Endocytosis of the thrombopoietin receptor Mpl regulates megakaryocyte and erythroid maturation in mice

Nathan Eaton et al. Front Oncol. .

Abstract

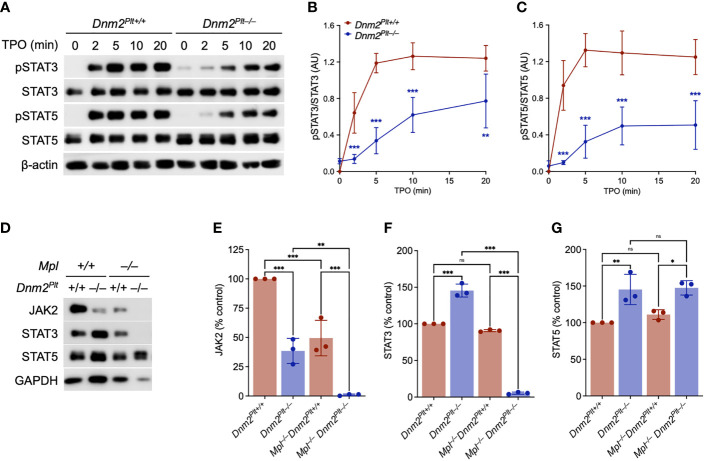
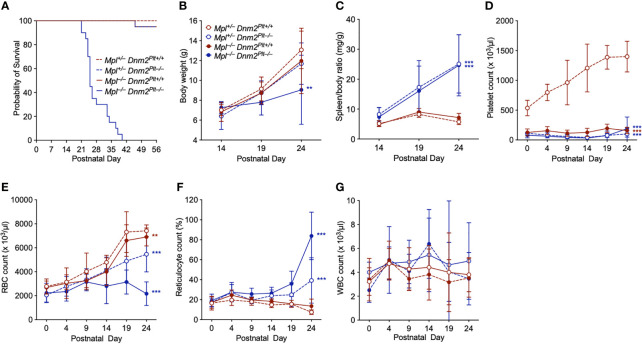
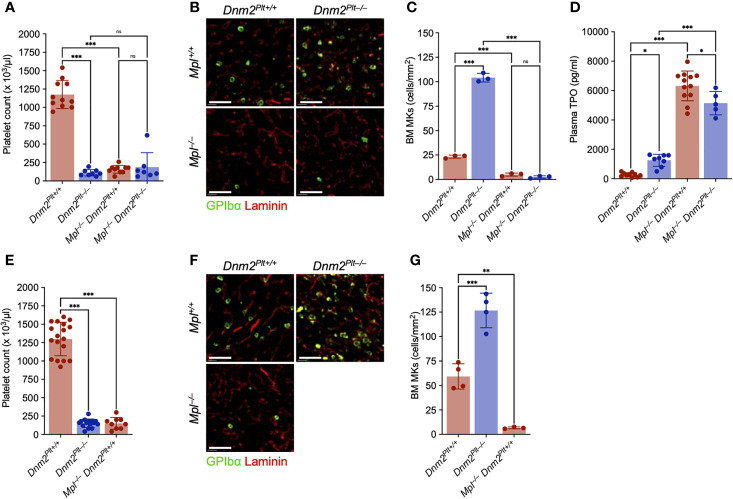
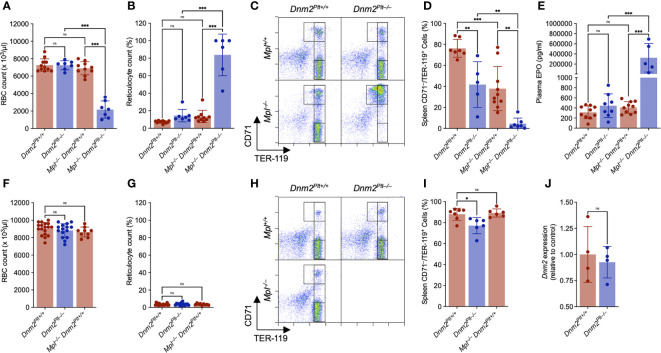
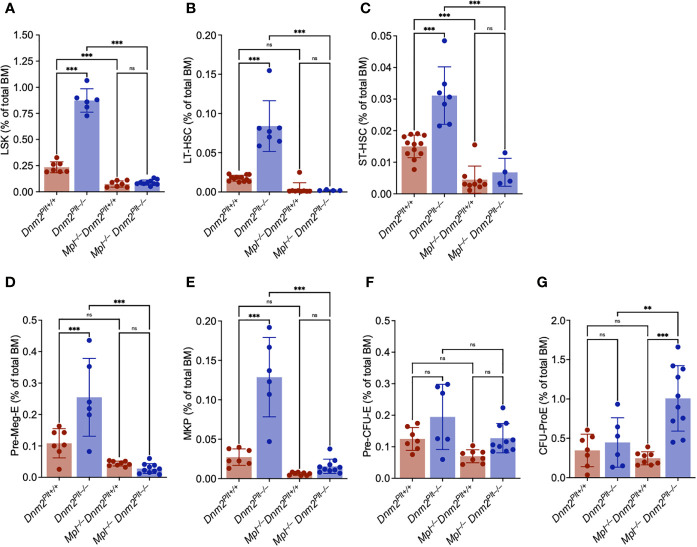
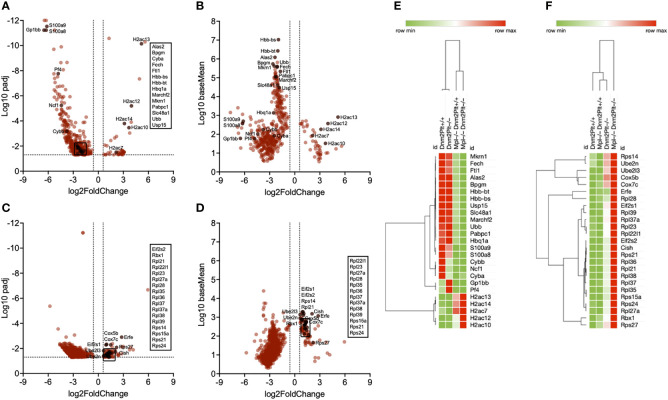
Dnm2fl/fl Pf4-Cre (Dnm2Plt-/- ) mice lacking the endocytic GTPase dynamin 2 (DNM2) in platelets and megakaryocytes (MKs) develop hallmarks of myelofibrosis. At the cellular level, the tyrosine kinase JAK2 is constitutively active but decreased in expression in Dnm2Plt-/- platelets. Additionally, Dnm2Plt-/- platelets cannot endocytose the thrombopoietin (TPO) receptor Mpl, leading to elevated circulating TPO levels. Here, we assessed whether the hyperproliferative phenotype of Dnm2Plt-/- mice was due to JAK2 constitutive activation or to elevated circulating TPO levels. In unstimulated Dnm2Plt-/- platelets, STAT3 and, to a lower extent, STAT5 were phosphorylated, but their phosphorylation was slowed and diminished upon TPO stimulation. We further crossed Dnm2Plt-/- mice in the Mpl-/- background to generate Mpl-/-Dnm2Plt-/- mice lacking Mpl ubiquitously and DNM2 in platelets and MKs. Mpl-/- Dnm2Plt-/- platelets had severely reduced JAK2 and STAT3 but normal STAT5 expression. Mpl-/- Dnm2Plt-/- mice had severely reduced bone marrow MK and hematopoietic stem and progenitor cell numbers. Additionally, Mpl-/- Dnm2Plt-/- mice had severe erythroblast (EB) maturation defects, decreased expression of hemoglobin and heme homeostasis genes and increased expression of ribosome biogenesis and protein translation genes in spleen EBs, and developed anemia with grossly elevated plasma erythropoietin (EPO) levels, leading to early fatality by postnatal day 25. Mpl-/- Dnm2Plt+/+ mice had impaired EB development at three weeks of age, which normalized with adulthood. Together, the data shows that DNM2-dependent Mpl-mediated endocytosis in platelets and MKs is required for steady-state hematopoiesis and provides novel insights into a developmentally controlled role for Mpl in normal erythropoiesis, regulating hemoglobin and heme production.

Keywords: dnm2; erythropoiesis; hematopoiesis; megakaryopoeiesis; mpl.


Conflict of interest statement

The authors declare that the research was conducted in the absence of any commercial or financial relationships that could be construed as a potential conflict of interest.

Figures

Figure 1
Figure 1
JAK2-STAT signaling defects in Dnm2Plt–/– platelets. (A) Dnm2Plt+/+ and Dnm2Plt–/– platelets were activated with 50 ng/ml TPO for 10 min at 37°C, lysed, subjected to SDS-PAGE, and probed for total and phosphorylated STAT3 (pSTAT3; Tyr705), total and phosphorylated STAT5 (pSTAT5; Tyr694 in STAT5A, Tyr699 in STAT5B), and β-actin as loading control, as indicated. Densitometry analysis of STAT3 (B) and STAT5 (C) phosphorylation. Results represent mean ± SD of 4 independent experiments and are compared statistically by two-way ANOVA (**,P <.01; ***, P <.001). (D) Platelet lysates of Dnm2Plt+/+ , Dnm2Plt–/– , Mpl–/– Dnm2Plt+/+ , and Mpl–/– Dnm2Plt–/– mice at P24 corresponding to 2 µg of protein were subjected to SDS-PAGE and probed for JAK2, STAT3, STAT5, and GAPDH as loading control, as indicated. Results are representative of 3 independent experiments. Densitometry analysis of JAK2 (E), STAT3 (F), and STAT5 (G) expression. Results represent mean ± SD of 3 independent experiments and are compared statistically by one-way ANOVA (ns, not significant, *P <.05; **P <.01; ***P <.001).
Figure 2
Figure 2
Mpl–/– Dnm2Plt–/– mice exhibit early lethality, failure to thrive, splenomegaly, and severe anemia. (A) Survival of Mpl+/– Dnm2Plt+/+ , Mpl+/– Dnm2Plt–/– , Mpl–/– Dnm2Plt+/+ , and Mpl–/– Dnm2Plt–/– littermates. Results are estimated using the Kaplan-Meier method and are compared statistically using the Log-rank test (n = 20 mice in each group: ***, Log-rank P <.001). Body weights (B) and spleen/body ratio (C) at P14, P19, and P24. Platelet (D), RBC (E), reticulocyte (F), and WBC (G) counts from birth (P0) to postnatal day 24 (P24). Results represent mean ± SD of 5-19 independent experiments and are compared statistically by two-way ANOVA (**P <.01; ***P <.001).
Figure 3
Figure 3
The MK hyperplasia of Dnm2Plt–/– mice requires Mpl expression. Platelet count at P24 (A) and P56 (E). Results represent mean ± SD of 7-13 independent experiments and are compared statistically by one-way ANOVA (ns, not significant, ***, P <.001). Seven-µm frozen bone marrow sections of Dnm2Plt+/+ , Dnm2Plt–/– , Mpl–/– Dnm2Plt+/+ , and Mpl–/– Dnm2Plt–/– mice at P24 (B) and P56 (F) were probed for resident MKs (GPIbα, green) and bone marrow vasculature (laminin, red). Sections shown are representative of 3-4 mice in each genotype. Scale bars represent 150 µm. Bone marrow MK numbers at P24 (C) and P56 (G). Results represent mean ± SD of 3-4 independent experiments and are compared statistically by one-way ANOVA (ns, not significant, **P <.01; ***P <.001). (D) Plasma TPO levels at P24. Results represent mean ± SD of 5-16 independent experiments and are compared statistically by one-way ANOVA (*P <.05; **P <.01; ***P <.001).
Figure 4
Figure 4
Mpl–/– Dnm2Plt–/– mice exhibit impaired erythroid development at P24. RBC count at P24 (A) and P56 (F). Reticulocyte count at P24 (B) and P56 (G). Results represent mean ± SD of 4-18 independent experiments and are compared statistically by one-way ANOVA (ns, not significant, ***P <.001). Flow cytometry profiles of spleen EBs at P24 (C) and P56 (H) using the erythroid markers CD71 and TER-119. Data shown are representative of 3-13 mice in each genotype. Percentage of mature spleen CD71low/TER-119high EBs at P24 (D) and P56 (I). Results represent mean ± SD of 5-10 independent experiments and are compared statistically by one-way ANOVA (ns, not significant, *P <.05; **P <.01; ***P <.001). Plasma EPO levels at P24 (E). Results represent mean ± SD of 5-15 independent experiments and are compared statistically by one-way ANOVA (ns, not significant, ***P <.001). (J) Genomic Dnm2 expression in isolated spleen CD71high EBs was evaluated by qPCR and normalized to Dnm2Plt+/+ cells. Results represent mean ± SD of 4 independent experiments and are compared statistically by Student’s t-test. (ns, not significant).
Figure 5
Figure 5
The increased HSPC expansion of Dnm2Plt–/– mice requires Mpl expression. Frequency of bone marrow Lin/Sca1+/Kit+ (LSK) (A), long-term (LT)-HSC (B), short-term (ST)-HSC (C), Pre-Meg-E (D), MK progenitor (MKP) (E), Pre-CFU-E (F), and CFU-ProE (G) in Dnm2Plt+/+ , Dnm2Plt–/– , Mpl–/– Dnm2Plt+/+ , and Mpl–/– Dnm2Plt–/– mice at P24. Results represent mean ± SD of 4-12 independent experiments and are compared statistically by one-way ANOVA (**P <.01; ***P <.001). ns, not significant.
Figure 6
Figure 6
Transcriptional profiling of spleen EBs in Dnm2Plt+/+ , Dnm2Plt–/– , Mpl–/– Dnm2Plt+/+ , and Mpl–/– Dnm2Plt–/– mice. Volcano plots showing genes differentially expressed in EBs of Mpl–/– Dnm2Plt+/+ + Mpl–/– Dnm2Plt–/– versus Dnm2Plt+/+ + Dnm2Plt–/– mice (Mpl effect), displayed as adjusted P-value (A) and baseMean (B). Volcano plots showing genes differentially expressed in EBs of Dnm2Plt–/– + Mpl–/– Dnm2Plt–/– versus Dnm2Plt+/+ + Mpl–/– Dnm2Plt+/+ mice (DNM2 effect), displayed as adjusted P-value (C) and baseMean (D). The log2FoldChange indicates the mean expression level change for each gene. Dashed lines indicate fold changes of -1.5 and 1.5 (x-axis) and adjusted P-value of.05 (y-axis). Each dot denotes one gene. Heat maps showing relevant genes identified using the Mpl (E) and DNM2 (F) effects in all four groups.

Similar articles

References

    1. Kaushansky K, Lok S, Holly RD, Broudy VC, Lin N, Bailey MC, et al. . Promotion of megakaryocyte progenitor expansion and differentiation by the c-mpl ligand thrombopoietin. Nature (1994) 369(6481):568–71. doi: 10.1038/369568a0 - DOI - PubMed
    1. Lok S, Kaushansky K, Holly RD, Kuijper JL, Lofton-Day CE, Oort PJ, et al. . Cloning and expression of murine thrombopoietin cDNA and stimulation of platelet production. Vivo Nature (1994) 369(6481):565–8. doi: 10.1038/369565a0 - DOI - PubMed
    1. de Sauvage FJ, Hass PE, Spencer SD, Malloy BE, Gurney AL, Spencer SA, et al. . Stimulation of megakaryocytopoiesis and thrombopoiesis by the c-mpl ligand. Nature (1994) 369(6481):533–8. doi: 10.1038/369533a0 - DOI - PubMed
    1. Kimura S, Roberts AW, Metcalf D, Alexander WS. Hematopoietic stem cell deficiencies in mice lacking c-mpl, the receptor for thrombopoietin. Proc Natl Acad Sci U S A (1998) 95(3):1195–200. doi: 10.1073/pnas.95.3.1195 - DOI - PMC - PubMed
    1. Qian H, Buza-Vidas N, Hyland CD, Jensen CT, Antonchuk J, Mansson R, et al. . Critical role of thrombopoietin in maintaining adult quiescent hematopoietic stem cells. Cell Stem Cell (2007) 1(6):671–84. doi: 10.1016/j.stem.2007.10.008 - DOI - PubMed