

Publication trends and hotspots of drug resistance in colorectal cancer during 2002-2021: A bibliometric and visualized analysis
- PMID: 36110958
- PMCID: PMC9469653
- DOI: 10.3389/fonc.2022.947658
Publication trends and hotspots of drug resistance in colorectal cancer during 2002-2021: A bibliometric and visualized analysis
Abstract
Background: Chemotherapy, radiotherapy, targeted therapy and immunotherapy have demonstrated expected clinical efficacy, while drug resistance remains the predominant limiting factor to therapeutic failure in patients with colorectal cancer (CRC). Although there have been numerous basic and clinical studies on CRC resistance in recent years, few publications utilized the bibliometric method to evaluate this field. The objective of current study was to provide a comprehensive analysis of the current state and changing trends of drug resistance in CRC over the past 20 years.
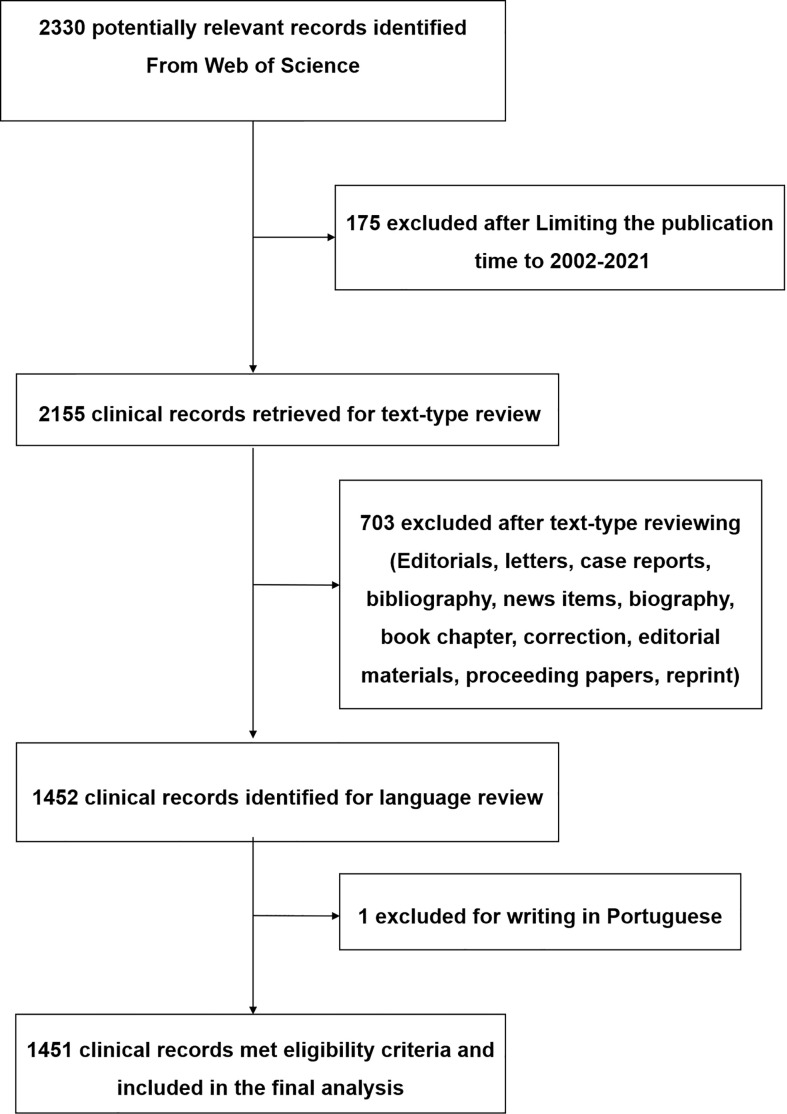
Methods: The Web of Science Core Collection (WOSCC) was utilized to extracted all studies regarding drug resistance in CRC during 2002-2021. CiteSpace and online platform of bibliometrics were used to evaluate the contributions of various countries/regions, institutions, authors and journals in this field. Moreover, the recent research hotspots and promising future trends were identified through keywords analysis by CiteSpace and VOSviewer.
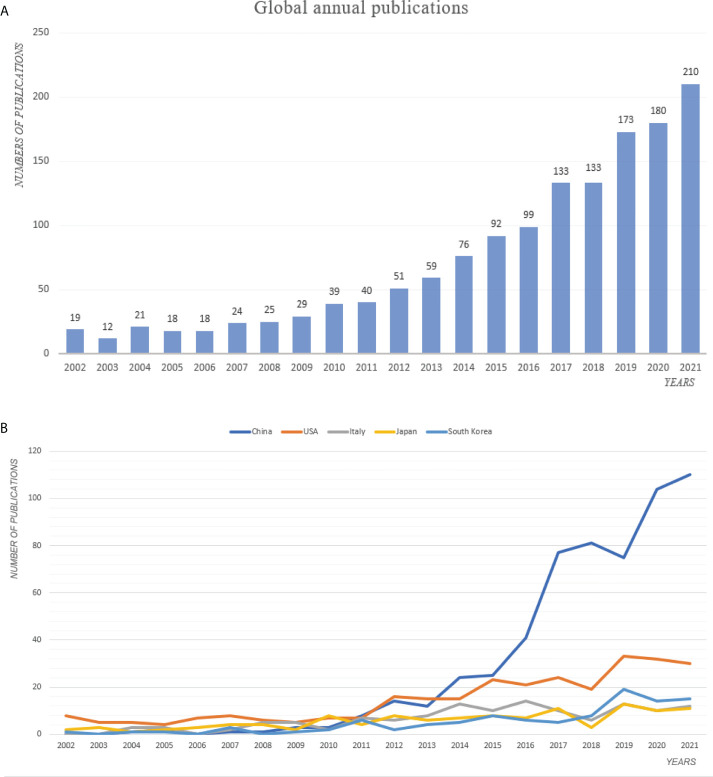
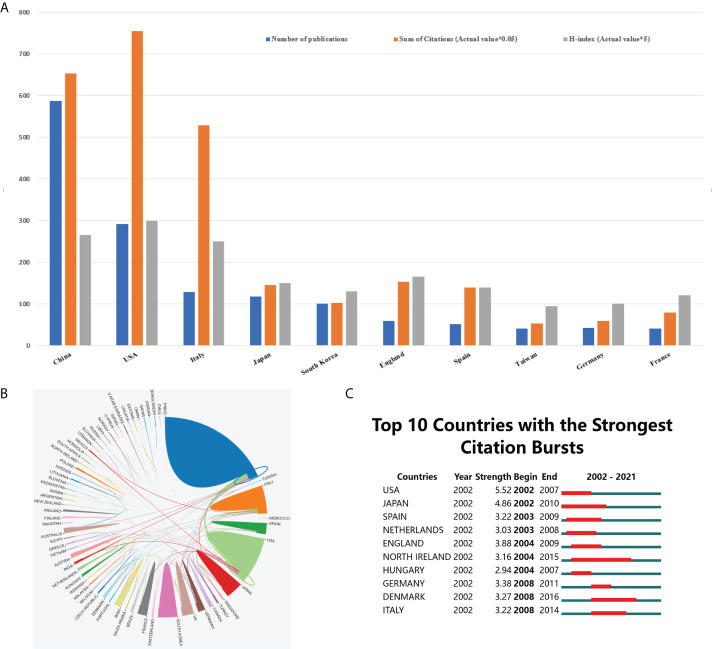
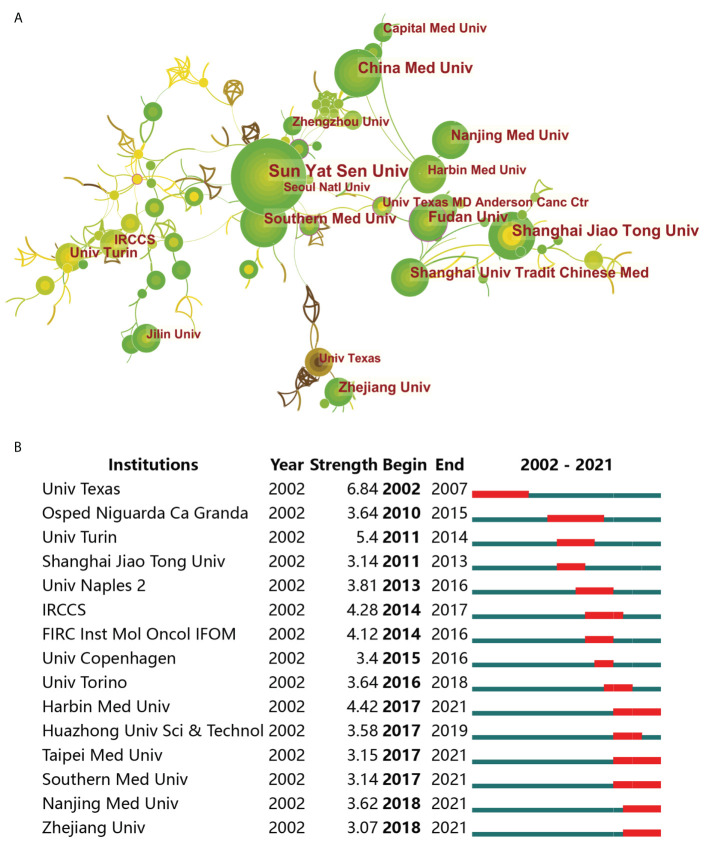
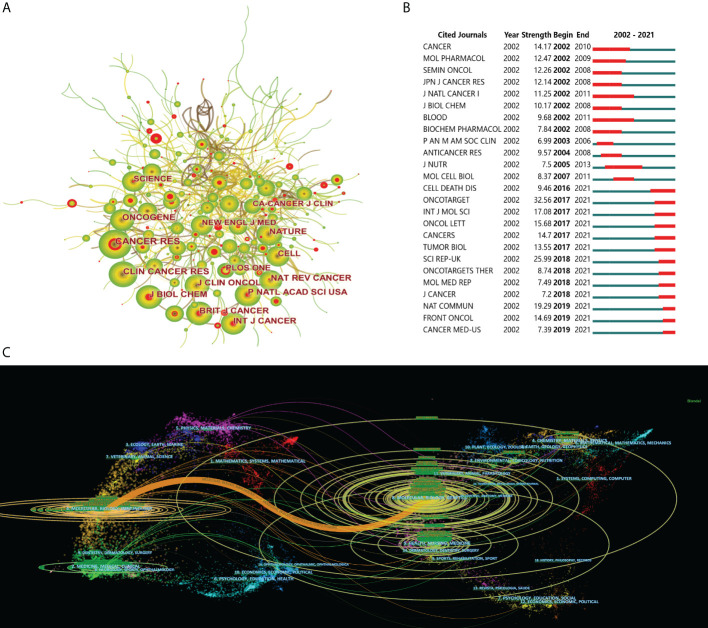
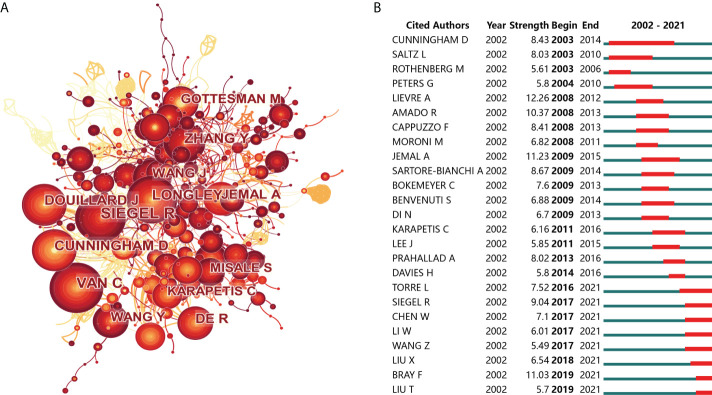
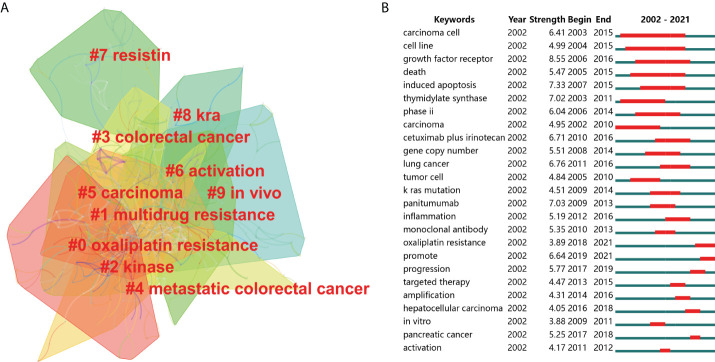
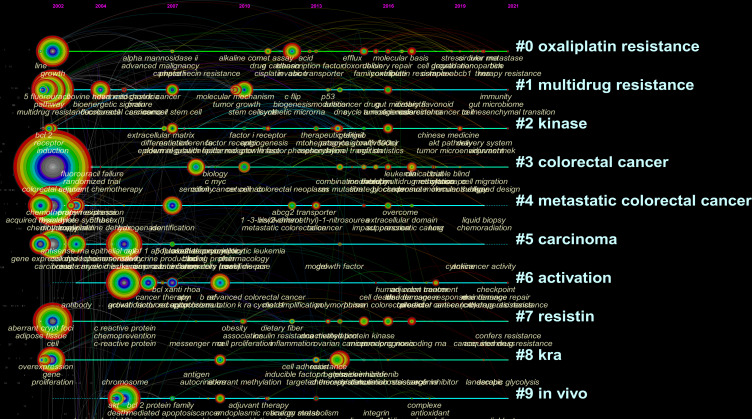
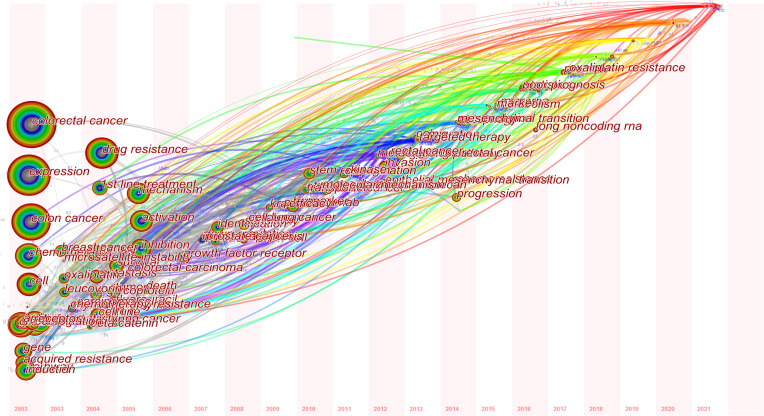
Results: 1451 related publications from 2002 to 2021 in total were identified and collected. The number of global publications in this field has increased annually. China and the USA occupied the top two places with respect to the number of publications, contributing more than 60% of global publications. Sun Yat-sen University and Oncotarget were the institution and journal which published the most papers, respectively. Bardelli A from Italy was the most prolific writer and had the highest H-index. Keywords burst analysis identified that "Growth factor receptor", "induced apoptosis" and "panitumumab" were the ones with higher burst strength in the early stage of this field. Analysis of keyword emergence time showed that "oxaliplatin resistance", "MicroRNA" and "epithelial mesenchymal transition (EMT)" were the keywords with later average appearing year (AAY).
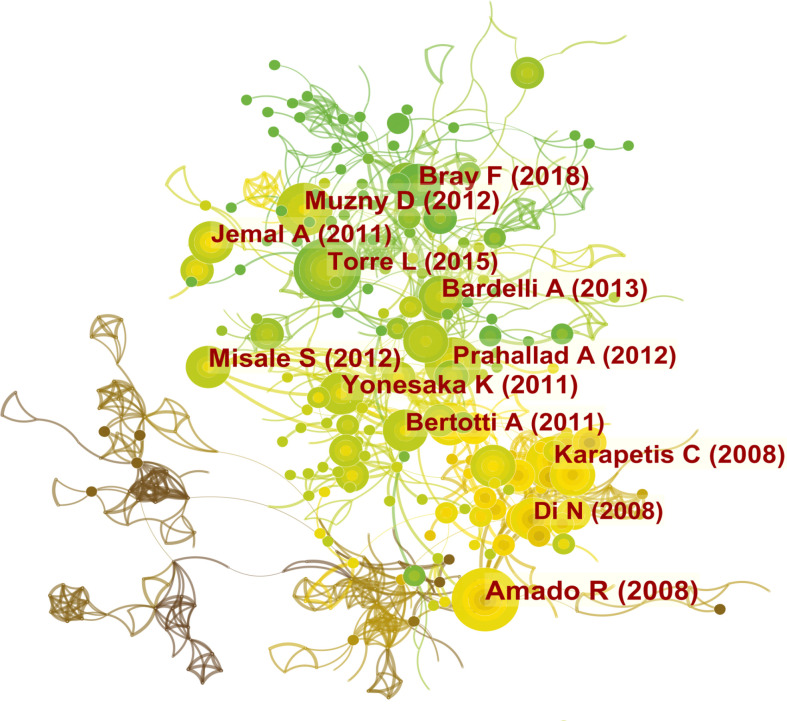
Conclusions: The number of publications and research interest on drug resistance in CRC have been increasing annually. The USA and China were the main driver and professor Bardelli A was the most outstanding researcher in this field. Previous studies have mainly concentrated on growth factor receptor and induced apoptosis. Oxaliplatin resistance, microRNA and EMT as recently appeared frontiers of research that should be closely tracked in the future.
Keywords: EMT; bibliometric analysis; colorectal cancer; drug resistance; microRNA.
Copyright © 2022 Zhao, Jiao, Ma, Yan, Li, Hu, Li and Du.
Conflict of interest statement
The authors declare that the research was conducted in the absence of any commercial or financial relationships that could be construed as a potential conflict of interest.
Figures
Similar articles
-
Global Research Trends and Hotspots of Autophagy in Colorectal Cancer: A 20-year Bibliometric Analysis Based on Web of Science.Front Biosci (Landmark Ed). 2022 Sep 29;27(9):272. doi: 10.31083/j.fbl2709272. Front Biosci (Landmark Ed). 2022. PMID: 36224016
-
Publication trends and hotspots of colorectal adenoma during 2002-2022: a bibliometric and visualized analysis.Front Oncol. 2023 Jul 10;13:1142703. doi: 10.3389/fonc.2023.1142703. eCollection 2023. Front Oncol. 2023. PMID: 37492472 Free PMC article.
-
Research trends on the relationship between gut microbiota and colorectal cancer: A bibliometric analysis.Front Cell Infect Microbiol. 2023 Jan 9;12:1027448. doi: 10.3389/fcimb.2022.1027448. eCollection 2022. Front Cell Infect Microbiol. 2023. PMID: 36699721 Free PMC article.
-
Bibliometric study of immunotherapy for hepatocellular carcinoma.Front Immunol. 2023 Aug 4;14:1210802. doi: 10.3389/fimmu.2023.1210802. eCollection 2023. Front Immunol. 2023. PMID: 37600802 Free PMC article. Review.
-
Bibliometric analysis of preoperative radiotherapy for locally advanced rectal cancer: evolution and future.Front Med (Lausanne). 2025 Feb 17;12:1518640. doi: 10.3389/fmed.2025.1518640. eCollection 2025. Front Med (Lausanne). 2025. PMID: 40034388 Free PMC article.
Cited by
-
Global Research Hotspots and Trends in Advances of the Ilizarov Technique: A Bibliometric Mapping.Orthop Surg. 2025 Mar;17(3):663-676. doi: 10.1111/os.14325. Epub 2025 Jan 29. Orthop Surg. 2025. PMID: 39887641 Free PMC article. Review.
-
Synergistic Mechanisms of Selected Polyphenols in Overcoming Chemoresistance and Enhancing Chemosensitivity in Colorectal Cancer.Antioxidants (Basel). 2024 Jul 7;13(7):815. doi: 10.3390/antiox13070815. Antioxidants (Basel). 2024. PMID: 39061884 Free PMC article. Review.
-
Evolutionary trend analysis and knowledge structure mapping of endothelial dysfunction in sepsis: a bibliometrics study.World J Emerg Med. 2024;15(5):386-396. doi: 10.5847/wjem.j.1920-8642.2024.083. World J Emerg Med. 2024. PMID: 39290606 Free PMC article.
-
Bibliometric analysis of hot literature on neural circuit research.Ibrain. 2023 Dec 21;10(1):69-82. doi: 10.1002/ibra.12144. eCollection 2024 Spring. Ibrain. 2023. PMID: 38682019 Free PMC article. Review.
-
Global trends and prospects related to macrophage in chronic kidney disease: a bibliometric analysis.Ren Fail. 2024 Dec;46(2):2423846. doi: 10.1080/0886022X.2024.2423846. Epub 2024 Nov 21. Ren Fail. 2024. PMID: 39572163 Free PMC article.
References
LinkOut - more resources
Full Text Sources
Miscellaneous