. 2022 Aug 30:12:974257.
doi: 10.3389/fonc.2022.974257. eCollection 2022.

MRI radiomics predicts progression-free survival in prostate cancer

Affiliations

MRI radiomics predicts progression-free survival in prostate cancer

Yushan Jia et al. Front Oncol. .

Erratum in

Abstract

Objective: To assess the predictive value of magnetic resonance imaging (MRI) radiomics for progression-free survival (PFS) in patients with prostate cancer (PCa).

Methods: 191 patients with prostate cancer confirmed by puncture biopsy or surgical pathology were included in this retrospective study, including 133 in the training group and 58 in the validation group. All patients underwent T2WI and DWI serial scans. Three radiomics models were constructed using univariate logistic regression and Gradient Boosting Decision Tree(GBDT) for feature screening, followed by Cox risk regression to construct a mixed model combining radiomics features and clinicopathological risk factors and to draw a nomogram. The performance of the models was evaluated by receiver operating characteristic curve (ROC), calibration curve and decision curve analysis. The Kaplan-Meier method was applied for survival analysis.

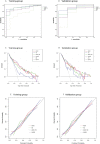
Results: Compared with the radiomics model, the hybrid model consisting of a combination of radiomics features and clinical data performed the best in predicting PFS in PCa patients, with AUCs of 0.926 and 0.917 in the training and validation groups, respectively. Decision curve analysis showed that the radiomics nomogram had good clinical application and the calibration curve proved to have good stability. Survival curves showed that PFS was shorter in the high-risk group than in the low-risk group.

Conclusion: The hybrid model constructed from radiomics and clinical data showed excellent performance in predicting PFS in prostate cancer patients. The nomogram provides a non-invasive diagnostic tool for risk stratification of clinical patients.

Keywords: magnetic resonance imaging; predictions; progression-free survival; prostate cancer; radiomics.


Conflict of interest statement

Author SQ and JR were employed by GE Healthcare. The remaining authors declare that the research was conducted in the absence of any commercial or financial relationships that could be construed as a potential conflict of interest.

Figures

Figure 1
Figure 1
Patient selection flow chart. Includes exclusion criteria and grouping.
Figure 2
Figure 2
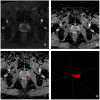
Schematic diagram of the ROI outline. (A) is the T2WI sequence with PCa in the left peripheral band, (B) is the ADC sequence with the cancer foci showing low signal, (C) is the ROI outline, (D) is the generated ROI.
Figure 3
Figure 3
ROC curves, decision curve analysis, calibration curves for different models in the training and validation groups. The ROC curves for the four models in the training and validation groups are shown in (A, B). The decision curves for the four models in the training and validation groups are shown in (C, D). The calibration curves for the four models are shown in (E, F).
Figure 4
Figure 4
Rad score chart for training and validation groups. (A, B) show the distribution of radiomics scores for the training and validation groups respectively. The pink bars represent the radiomics scores of patients who did not experience disease progression, while the blue bars represent the radiomics scores of patients who experienced disease progression.
Figure 5
Figure 5
Radiology nomogram. The radiology nomogram prediction model predicts the probability of progression in patients with PCa. How to use: (1) locate the patient’s radiomic score, PSA level, clinical T-stage, Gleason score, number of tumor and then draw a straight line on the top dot axis to obtain the corresponding score; (2) sum the scores obtained (3) find the final sum on the total point axis and draw a straight line down to assess the risk of progression in patients with prostate cancer.
Figure 6
Figure 6
Kaplan-Meier analysis. (A) is the training group and (B) is the validation group.

Similar articles

Cited by

References

    1. Sung H, Ferlay J, Siegel RL, Laversanne M, Soerjomataram I, Jemal A, et al. . Global cancer statistics 2020: GLOBOCAN estimates of incidence and mortality worldwide for 36 cancers in 185 countries. CA Cancer J Clin (2021) 71(3):209–49. doi: 10.3322/caac.21660 - DOI - PubMed
    1. Dy GW, Gore JL, Forouzanfar MH, Naghavi M, Fitzmaurice C. Global burden of urologic cancers, 1990-2013. Eur Urol (2017) 71(3):437–46. doi: 10.1016/j.eururo.2016.10.008 - DOI - PubMed
    1. Chen W, Zheng R, Baade PD, Zhang S, Zeng H, Bray F, et al. . Cancer statistics in China, 2015. CA Cancer J Clin (2016) 66(2):115–32. doi: 10.3322/caac.21338 - DOI - PubMed
    1. Liu Z, Jiang Y, Fang Q, Yuan H, Cai N, Suo C, et al. . Future of cancer incidence in Shanghai, China: Predicting the burden upon the ageing population. Cancer Epidemiol (2019) 60:8–15. doi: 10.1016/j.canep.2019.03.004 - DOI - PubMed
    1. Shin S, Saito E, Sawada N, Ishihara J, Takachi R, Nanri A, et al. . Dietary patterns and prostate cancer risk in Japanese: The Japan public health center-based prospective study (JPHC study). Cancer Causes Control (2018) 29(6):589–600. doi: 10.1007/s10552-018-1030-3 - DOI - PubMed

LinkOut - more resources