. 2022 Aug 29:21:294-306.
doi: 10.1016/j.reth.2022.08.001. eCollection 2022 Dec.

Appropriate pore size for bone formation potential of porous collagen type I-based recombinant peptide

Affiliations

Appropriate pore size for bone formation potential of porous collagen type I-based recombinant peptide

Shoji Yamahara et al. Regen Ther. .

Abstract

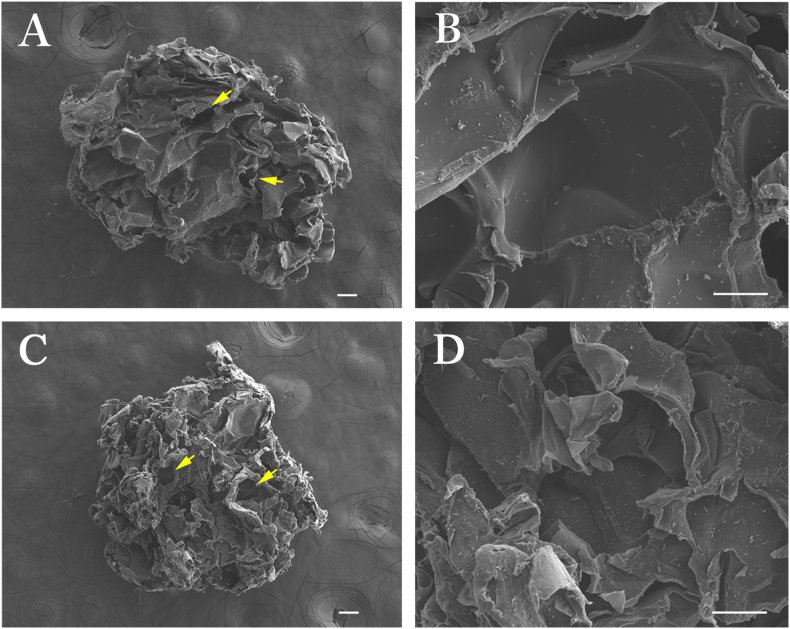
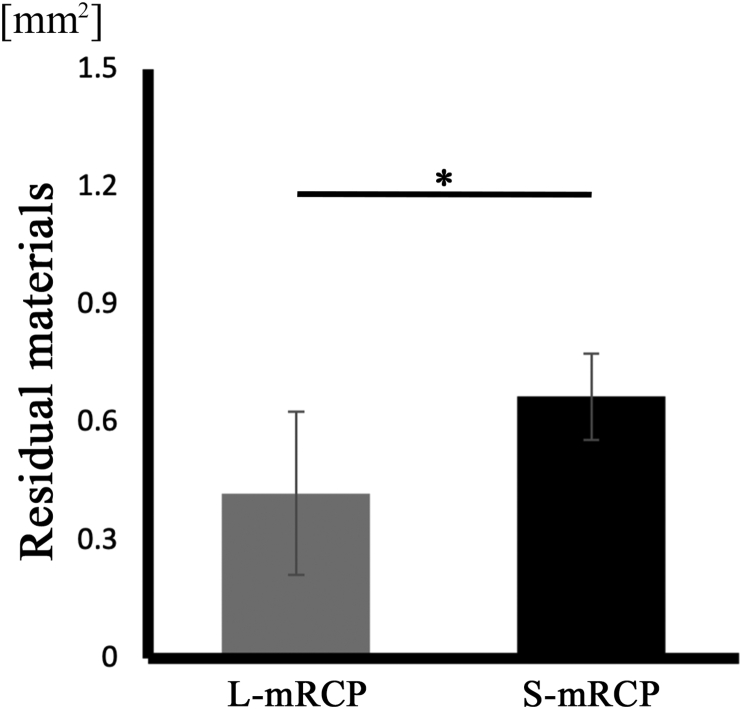
Introduction: In this study, we developed porous medium cross-linked recombinant collagen peptide (mRCP) with two different ranges of interconnected pore sizes, Small-mRCP (S-mRCP) with a range of 100-300 μm and Large-mRCP (L-mRCP) with a range of 200-500 μm, to compare the effect of pore size on bone regeneration in a calvarial bone defect.

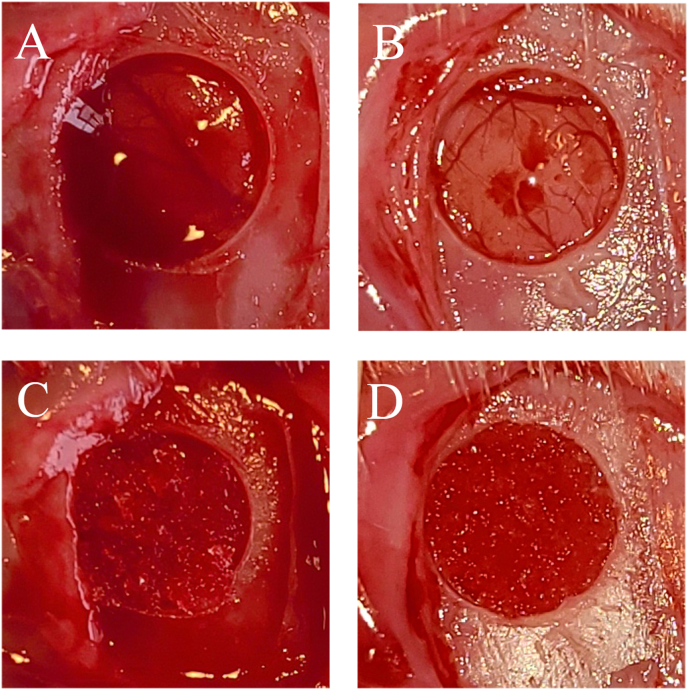
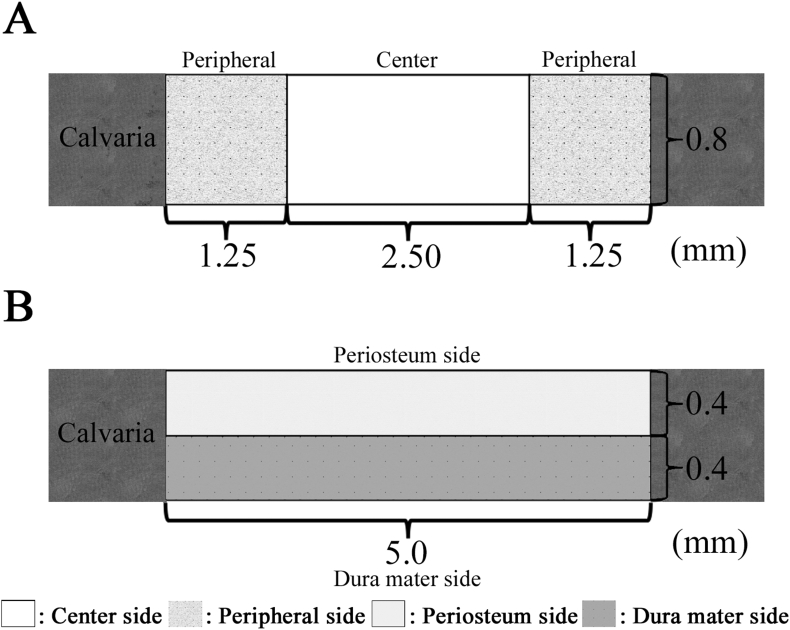
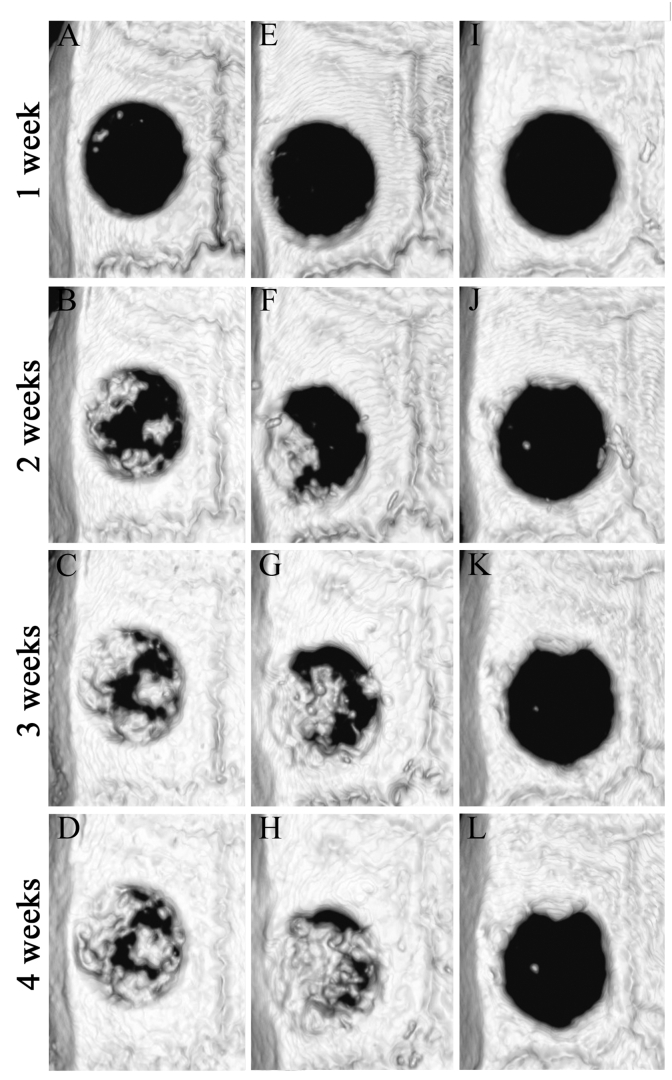
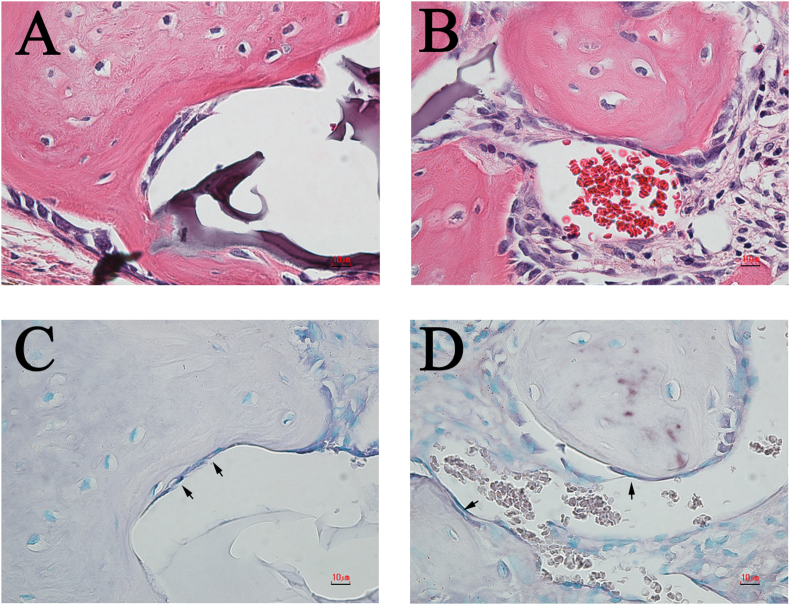
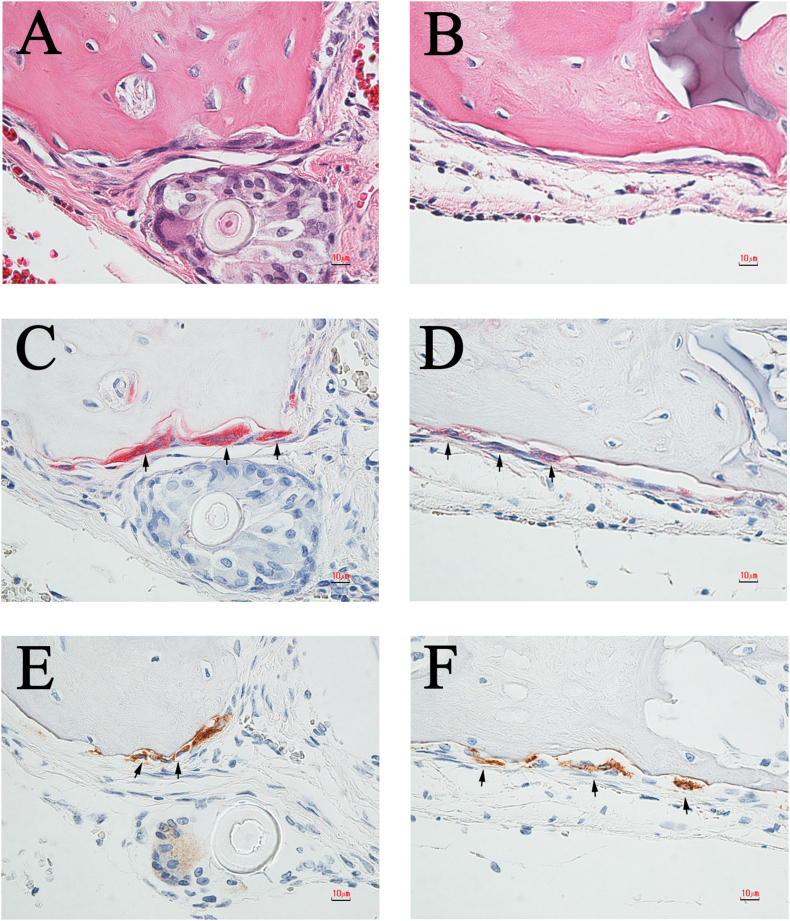
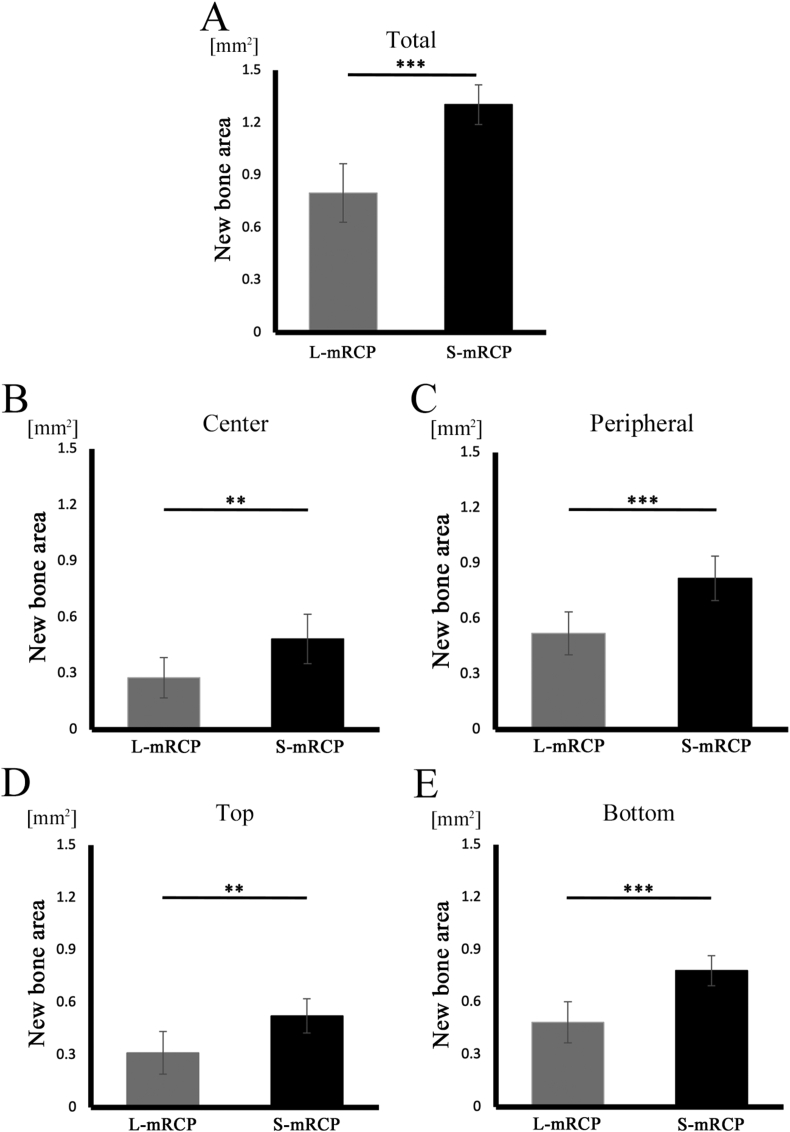
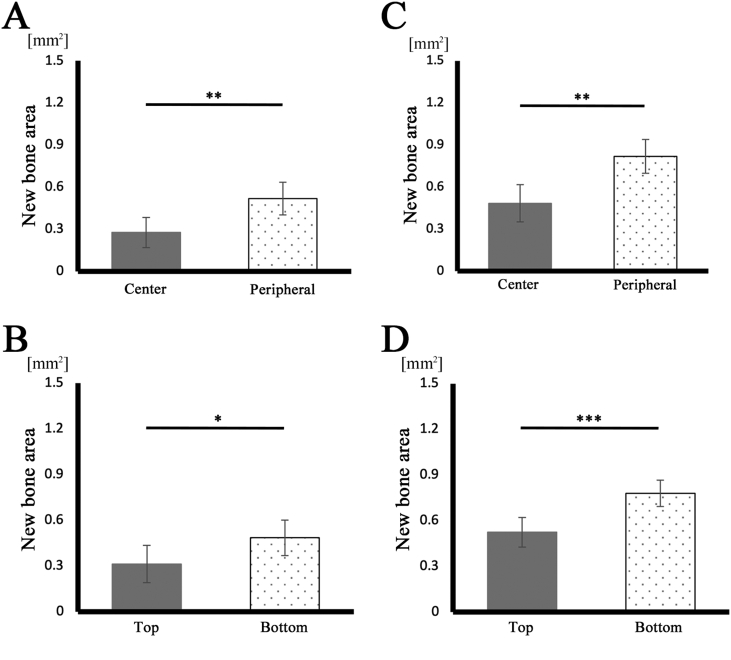
Methods: Calvarial bone defects were created in Sprague-Dawley rats through a surgical procedure. The rats were divided into 2 groups: S-mRCP implanted group and L-mRCP implanted group. The newly formed bone volume and bone mineral density (BMD) was evaluated by micro-computed tomography (micro-CT) immediately after implantation and at 1, 2, 3, and 4 weeks after implantation. In addition, histological analyses were carried out with hematoxylin and eosin (H&E) staining at 4 weeks after implantation to measure the newly formed bone area between each group in the entire defect, as well as the central side, the two peripheral sides (right and left), the periosteal (top) side and the dura matter (bottom) side of the defect.

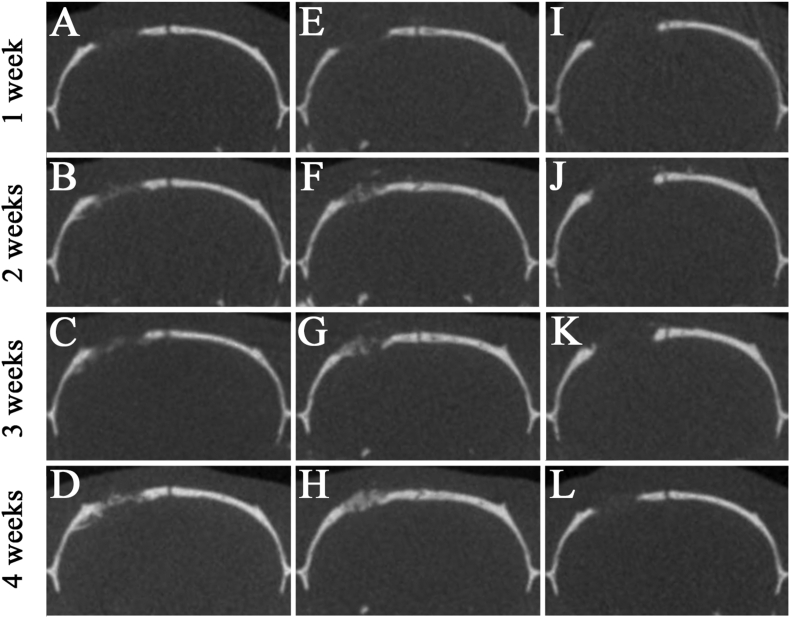
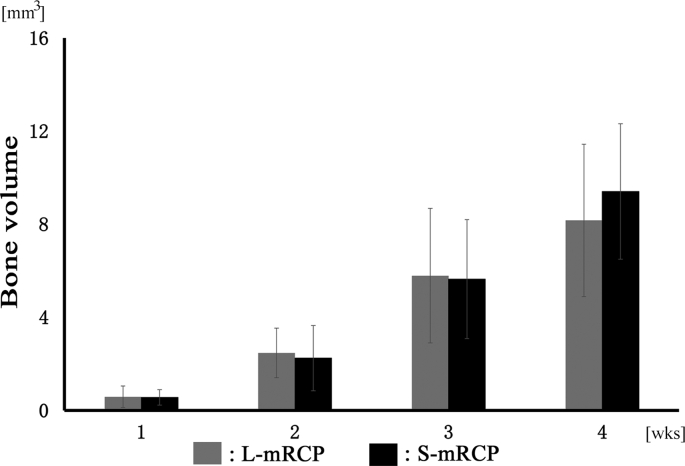
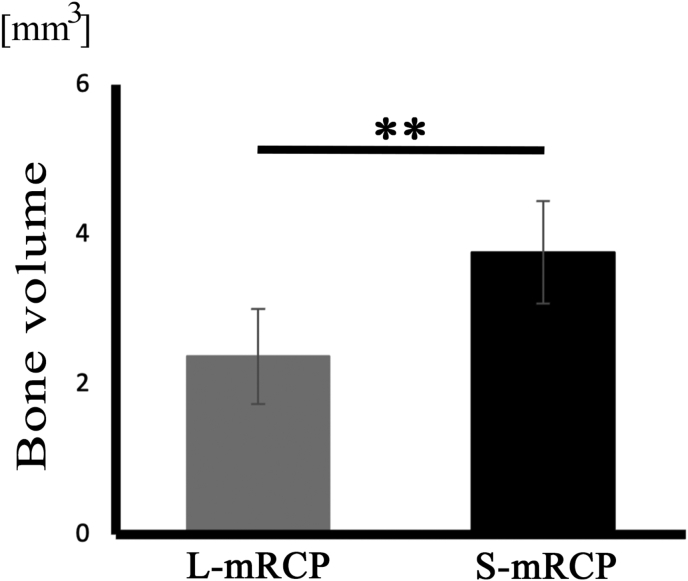
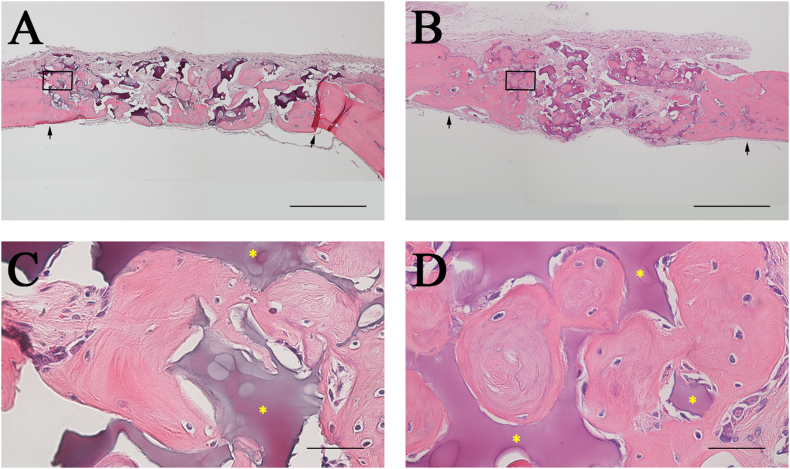
Results: Micro-CT analysis showed no significant differences in the amount of bone volume between the S-mRCP and L-mRCP implanted groups at 1, 2, 3 and 4 weeks after implantation. BMD was equivalent to that of the adjacent native calvaria bone at 4 weeks after implantation. H&E images showed that the newly formed bone area in the entire defect was significantly larger in the S-mRCP implanted group than in the L-mRCP implanted group. Furthermore, the amount of newly formed bone area in all sides of the defect was significantly more in the S-mRCP implanted group than in the L-mRCP implanted group.

Conclusion: These results indicate that the smaller pore size range of 100-300 μm is appropriate for mRCP in bone regeneration.

Keywords: ALP, alkaline phosphatase; BMD, bone mineral density; Bone reconstruction; Bone substitute; CSD, critical-size defect; Calvaria; DHT, dehydothermal treatment; H&E, hematoxylin and eosin; Interconnected pore; Pore size; RCP, recombinant collagen peptide; RGD, arginyl- glycyl- aspartic acid; ROIs, regions of interest; Recombinant human collagen peptide; SD, standard deviation; TRAP, tartrate-resistant acid phosphatase; mRCP, medium-cross-linked RCP; micro-CT, micro-computed tomography.


Conflict of interest statement

This work was supported by the joint research expenses with 10.13039/501100013899FUJIFILM Corporation. Taku Wakita, Takahiro Hiratsuka are employees of FUJIFILM Corporation.

Figures

Fig. 1
Fig. 1
Field-emission electron probe microanalyzer images of the cross sections of the two types of mRCP. L-mRCP and S-mRCP were prepared with a pore size of 200–500 μm, and 100–300 μm, respectively. L-mRCP at × 40 (A) and at × 300 (B) magnification and S-mRCP at × 40 (C) and × 300 (D) magnification. Scale bar represents 100 μm. Yellow arrows indicate interconnected pores.
Fig. 2
Fig. 2
Gross appearance of the 5-mm diameter bone defect made with a trephine bur in the left calvaria bone of a Sprague–Dawley rat in the (A) L-mRCP and (B) S-mRCP implanted groups. Aspect of the bone defect filled with 3 mg of (C) L-mRCP and (D) S-mRCP.
Fig. 3
Fig. 3
Schematic representation of the rat calvarial critical-sized bone defect and histomorphometric analyses. (A) The amount of newly formed bone was calculated based on the defect width and the bone fill measurements in the peripheral area (1.25 mm × 0.8 mm) of both the sides (1.25 mm × 0.8 mm × 2) and the central area (2.5 mm × 0.8 mm). (B) The level of bone union was calculated based on the defect width and the bone fill measurements in the bottom side (dura matter side, 5.0 mm × 0.4 mm) and the top side (periosteal side, 5.0 mm × 0.4 mm).
Fig. 4
Fig. 4
Micro-CT images of the calvarial bone in the coronal plane at 1, 2, 3, and 4 weeks after implantation. (A–D) L-mRCP implanted group. (E–H) S-mRCP implanted group. (I–L) Control group.
Fig. 5
Fig. 5
Micro-CT analysis of L-mRCP and S-mRCP implanted into the calvarial bone defect for comparison of bone volume. The plots are showing the quantitative comparison of the radio-opaque areas recorded between the L-mRCP implanted group (n = 6) and the S-mRCP implanted group (n = 6) from the whole defects at week 1, 2, 3, and 4, respectively.
Fig. 6
Fig. 6
Comparison of the amount of bone formation after implantation of L-mRCP and S-mRCP into the calvarial bone defect. The graph shows the bone volume of newly formed bone in the L-mRCP implanted group (n = 6) and the S-mRCP implanted group (n = 6) in the 1week interval between the 3rd and 4th week after implantation. ∗∗P < 0.01. The bars and error bars in the graph represent the mean and standard deviation (SD), respectively.
Fig. 7
Fig. 7
Axial volume-rendered images within the calvaria bone defects obtained from 3D reconstructed micro-CT images at 1, 2, 3, and 4 weeks after implantation. (A–D) L-mRCP implanted group. (E–H) S-mRCP implanted group, and (I–L) control group.
Fig. 8
Fig. 8
Histological appearance of the calvaria bone after 4 weeks of implantation with S-mRCP and L-mRCP . Coronal plane sections were stained with hematoxylin and eosin (H&E) at 4 weeks after L-mRCP (A) and S-mRCP (B) were implanted into the calvarial bone defect. The pink-stained structure in the defect indicates newly formed bone and the purple-stained structure indicates the mRCP implant (×40). (C and D) Higher magnification (×600) of the framed area in A and B. Scale bars represent 1 mm (A and B) and 50 μm (C and D). The arrows indicate the boundary between the implanted site and the native calvarial bone.
Fig. 9
Fig. 9
Representative high-magnification (×600) images of H&E- and ALP-stained sections of the L-mRCP and S-mRCP implanted groups after 4 weeks of implantation. (A) H&E-stained section of L-mRCP implanted group at 4 weeks post-implantation. (C) Same area in (A) showing osteoblast staining with ALP (B) H&E-stained section of S-mRCP implanted group at 4 weeks post-implantation. (D) Same area in (B) showing osteoblast staining with ALP. Scale bars represent 10 μm. Arrows indicate osteoblasts.
Fig. 10
Fig. 10
Representative high-magnification (×600) images of H&E, TRAP and cathepsin K-stained sections of the L-mRCP and S-mRCP implanted groups. (A) H&E-stained section of the L-mRCP implanted group at 4 weeks post-implantation. (C) Osteoclasts were stained with TRAP at 4 weeks post-implantation. The image shows the area in A. (E) Osteoclasts were also stained with cathepsin K at 4 weeks post-implantation. The image shows the area in (A) and (C). (B) H&E-stained section of S-mRCP implanted group at 4 weeks post-implantation. (D) Osteoclasts were stained with TRAP at 4 weeks post-implantation. The image shows the area in B. (F) Osteoclasts were also stained with cathepsin K at 4 weeks post-implantation. The image shows the area in B. Scale bars represent 10 μm. Arrows indicate osteoclasts.
Fig. 11
Fig. 11
Amount of residual L-mRCP and S-mRCP after 4 weeks of implantation. ∗P < 0.05. The graph shows the mean with SD (n = 3/group).
Fig. 12
Fig. 12
Comparison of the newly formed bone area in the L-mRCP and the S-mRCP implanted groups at different locations in the defect site 4 weeks after implantation. (A) The entire bone defect (5.0 mm × 0.8 mm), (B) central bone defect (2.5 mm × 0.8 mm), (C) peripheral bone defect on both sides (1.25 mm × 0.8 mm × 2), (D) top side (5.0 mm × 0.4 mm), and (E) bottom side (5.0 mm × 0.4 mm) were measured from the entire calvarial bone defect using ImageJ software. ∗∗∗P < 0.001, ∗∗P < 0.01. The graphs show the mean value with the corresponding SD (n = 3/group).
Fig. 13
Fig. 13
Comparison of the newly formed bone area between different sites in the bone defect after 4 weeks of implantation with L-mRCP or S-mRCP. (A) The bone area of the peripheral bone defect on both sides (1.25 mm × 0.8 mm × 2) and the central bone defect (2.5 mm × 0.8 mm) were measured from the entire calvarial bone defect using ImageJ software after 4 weeks of implantation with L-mRCP. (B) The bone area of the bottom and top side (5.0 mm × 0.4 mm) of the entire calvarial bone defect (5.0 mm × 0.8 mm) were measured using ImageJ software after 4 weeks of implantation with L-mRCP. (C) The bone area of the peripheral bone defect on both sides (1.25 mm × 0.8 mm × 2) and the central bone defect (2.5 mm × 0.8 mm) were measured from the entire calvarial bone defect using ImageJ software after 4 weeks of implantation with S-mRCP. (D) The bone area of the bottom side and top side (5.0 mm × 0.4 mm) of the entire calvarial bone defect (5.0 mm × 0.4 mm) were measured using ImageJ software after 4 weeks of implantation with S-mRCP. ∗∗∗P < 0.001, ∗∗P < 0.01, ∗P < 0.05. The graphs show the mean with SD (n = 3/group).

Similar articles

Cited by

References

    1. Ali S.A., Mossey P., Gillgrass T. A study model based photographic method for assessment of surgical treatment outcome in unilateral cleft lip and palate patients. Eur J Orthod. 2006;28:366–372. doi: 10.1093/ejo/cjl004. - DOI - PubMed
    1. Bajaj A.K., Wongworawat A.A., Punjabi A. Management of alveolar clefts. J Craniofac Surg. 2003;14:840. - PubMed
    1. Raposo-Amaral C.E., Denadai R., Alonso N. Three-dimensional changes of maxilla after secondary alveolar cleft repair: differences between rhBMP-2 and autologous iliac crest bone grafting. Plast Reconstr Surg Glob Open. 2015;3:e451. doi: 10.1097/GOX.0000000000000417. - DOI - PMC - PubMed
    1. Shirani G., Abbasi A.J., Mohebbi S.Z. Need for revision surgery after alveolar cleft repair. J Craniofac Surg. 2012;23:378–381. doi: 10.1097/SCS.0b013e318240fe7f. - DOI - PubMed
    1. Forte A.J.V., da Silva Freitas R., Alonso N. Use of three-dimensional computed tomography to classify filling of alveolar bone grafting. Plast Surg Int. 2012;2012 doi: 10.1155/2012/259419. - DOI - PMC - PubMed

LinkOut - more resources