. 2022 Aug;10(16):894.
doi: 10.21037/atm-22-3787.

Mechanism of the Huangguoshu waterfall forest environment's promotive effect on human health in Guizhou, China

Affiliations

Mechanism of the Huangguoshu waterfall forest environment's promotive effect on human health in Guizhou, China

Zixin Zhu et al. Ann Transl Med. 2022 Aug.

Abstract

Background: The aim of this study was to investigate the specific mechanisms underlying the human health-promoting effects of the forest environment at Huangguoshu Falls, Guizhou, China.

Methods: Ninety-five participants were recruited and an eye tracker was used to record fixation and sweep indices. A questionnaire was also used to evaluate the effects of different subject environments on human emotions, perceived recovery and preferences. Thereafter, 24 participants with chronic fatigue syndrome (CFS) were recruited and the participants' fatigue and stress-related scale indices and inflammatory factor levels were examined. Serum metabolites of the participants under different time waterfall forest interventions were detected by ultra performance liquid chromatography-quadrupole-time of flight mass spectrometry (UHPLC-Q/TOF-MS).

Results: Eye tracking paradigm analysis showed that the "waterfall" element was the most interesting element for participants and that the "charm" of the waterfall forest environment could be well perceived by participants. Scores on the Fatigue Scale, Anxiety Scale and Depression Scale decreased as the duration of treatment in the waterfall forest environment increased. Levels of inflammatory factors decreased after treatment in the waterfall forest environment. At the same time the level of antioxidants, represented by L-ascorbic acid, increased significantly.

Conclusions: The charm of the Huangguoshu waterfall scenery could be perceived by the participants and have a positive modulating effect on mood and cognitive function. In addition, the unique mixture of negative oxygen ions in this environment can increase the content of endogenous antioxidants and balance the metabolism of choline and amino acids.

Keywords: Huangguoshu waterfall; chronic fatigue syndrome (CFS); healing environment; natural therapy; waterfall forest environment.


Conflict of interest statement

Conflicts of Interest: All authors have completed the ICMJE uniform disclosure form (available at https://atm.amegroups.com/article/view/10.21037/atm-22-3787/coif). The authors have no conflicts of interest to declare.

Figures

Figure 1
Figure 1
Panoramic view of the 3 different research sites. (A) Waterfall forest environment, (B) park grass environment, (C) urban street environment.
Figure 2
Figure 2
The detailed daily schedule.
Figure 3
Figure 3
Environmental evaluation indicators for short-term visits to the waterfall forests environment. AOI, area of interest; POMS, profile of mood states; PRS, perceived restorative scale.
Figure 4
Figure 4
Eye movement diagram of the waterfall forest environment by using fixation heat map (A) and fixation trajectory map (B), and eye movement diagram of the park grass environment by using fixation heat map (C) and fixation trajectory map (D), and eye movement diagram of the urban street environment by using fixation heat map (E) and fixation trajectory map (F).
Figure 5
Figure 5
Three landscape environments with different AOI divisions. (A,D) Waterfall forest environment, (B,E) park grass environment, and (C,F) urban street environment. *, P<0.05 and **, P<0.01 indicate significant difference between other group and baseline; #, P<0.05 and ##, P<0.01 indicated that there were significant differences between the Waterfall and other groups. AOI, area of interest; T-A, tension-anxiety; A-H, anger-hostility; F, fatigue; D, depression; C, confusion; V, vigor.
Figure 6
Figure 6
Changes in POMS scores in different environments. (A) T-A for tension scale, (B) A-H for anger, (C) F for fatigue, (D) D for depression, (E) C for confusion, and (F) V for vigor. *, P<0.05 and **, P<0.01 indicate significant differences between groups compared with baseline; #, P<0.05 and ##, P<0.01 indicate significant differences between groups compared with the waterfall group. POMS, profile of mood states; T-A, tension-anxiety; A-H, anger-hostility; F, fatigue; D, depression; C, confusion; V, vigor.
Figure 7
Figure 7
Changes in mood scales in the 2 groups of participants at different intervention times. (A) HAMA and (B) HAMD. *, P<0.05 and **, P<0.01 indicate a significant difference between day 0 and day 3; #, P<0.05 and ##, P<0.01 indicate a significant difference between day 0 and day 7. HAMA, Hamilton Anxiety Scale; HAMD, Hamilton Depression Scale.
Figure 8
Figure 8
Changes in fatigue scale scores in the 2 groups of participants at different intervention times. (A) FS-14 somatic fatigue score and (B) FS-14 mental fatigue scores. FS, fatigue scale. **, P<0.01 indicate significant difference between other group and baseline; ##, P<0.01 indicated significant differences between the Waterfall and other groups.
Figure 9
Figure 9
Evaluation of cognitive function in the 2 groups of participants at different intervention times. (A) PASAT correct and (B) PASAT attempts. *, P<0.05 indicate significant difference between other group and baseline; #, P<0.05 indicated significant differences between the Waterfall and other groups. PASAT, paced auditory serial addition task.
Figure 10
Figure 10
Changes in serum neurotransmitter levels in the 2 groups of participants at different intervention times. (A) Changes in cortisol and (B) 5-HT levels. **, P<0.01 indicate significant difference between other group and baseline; #, P<0.05 indicated significant differences between the Waterfall and other groups. CORT, cortisol; 5-HT, 5-hydroxytryptophan.
Figure 11
Figure 11
Changes in physiological indicators in two groups of participants at different intervention times. **, P<0.01 indicate significant difference between other group and baseline; #, P<0.05 indicated significant differences between the Waterfall and other groups. UA, uric acid; GLU, glucose; CHO, cholesterol; TG, triglyceride.
Figure 12
Figure 12
Changes in (anti) oxidants in the 2 groups of participants at different intervention times. *, P<0.05 and **, P<0.01 indicate significant difference between other group and baseline; #, P<0.05 and ##, P<0.01 indicated that there were significant differences between the Waterfall and other groups. GSH-Px, glutathione peroxidase; SOD, superoxide dismutase; MDA, malonaldehyde.
Figure 13
Figure 13
Changes in inflammatory factors in the 2 groups of participants at different intervention times. *, P<0.05 and **, P<0.01 indicate significant difference between other group and baseline; #, P<0.05 and ##, P<0.01 indicated that there were significant differences between the Waterfall and other groups. IL, immunoglobulin; TNF, tumor necrosis factor.
Figure 14
Figure 14
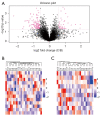
Differential metabolite detection results of group A vs. B. (A) Volcano plot, (B) positive ion pattern clustering analysis plot, and (C) negative ion pattern clustering analysis plot. Black: the overlap of the metabolites of the two groups of samples; Red: the metabolites of the two groups of samples.
Figure 15
Figure 15
Differential metabolite detection results of group A vs. C. (A) Volcano plot, (B) positive ion pattern clustering analysis plot, and (C) negative ion pattern clustering analysis plot. Black: the overlap of the metabolites of the two groups of samples; Red: the metabolites of the two groups of samples.
Figure 16
Figure 16
Differential metabolite detection results of group B vs. C. (A) Volcano plot, (B) positive ion pattern clustering analysis plot, and (C) negative ion pattern clustering analysis plot. Black: the overlap of the metabolites of the two groups of samples; Red: the metabolites of the two groups of samples.
Figure 17
Figure 17
Analysis of KEGG pathway enrichment at different intervention times. KEGG, Kyoto Encyclopedia of Genes and Genomes.

Similar articles

References

    1. Cai W, Zhang C, Zhang S, et al. The 2021 China report of the Lancet Countdown on health and climate change: seizing the window of opportunity. Lancet Public Health 2021;6:e932-47. 10.1016/S2468-2667(21)00209-7 - DOI - PubMed
    1. Romanello M, van Daalen K, Anto JM, et al. Tracking progress on health and climate change in Europe. Lancet Public Health 2021;6:e858-65. 10.1016/S2468-2667(21)00207-3 - DOI - PubMed
    1. Kimura T, Yamada T, Hirokawa Y, et al. Brief and Indirect Exposure to Natural Environment Restores the Directed Attention for the Task. Front Psychol 2021;12:619347. 10.3389/fpsyg.2021.619347 - DOI - PMC - PubMed
    1. Wichrowski MJ, Corcoran JR, Haas F, et al. Effects of Biophilic Nature Imagery on Indexes of Satisfaction in Medically Complex Physical Rehabilitation Patients: An Exploratory Study. HERD 2021;14:288-304. 10.1177/19375867211004241 - DOI - PubMed
    1. Shuda Q, Bougoulias ME, Kass R. Effect of nature exposure on perceived and physiologic stress: A systematic review. Complement Ther Med 2020;53:102514. 10.1016/j.ctim.2020.102514 - DOI - PubMed