. 2022 Oct 15;135(20):jcs260042.
doi: 10.1242/jcs.260042. Epub 2022 Oct 20.

MLL regulates the actin cytoskeleton and cell migration by stabilising Rho GTPases via the expression of RhoGDI1

Affiliations

MLL regulates the actin cytoskeleton and cell migration by stabilising Rho GTPases via the expression of RhoGDI1

Akash Chinchole et al. J Cell Sci. .

Abstract

Attainment of proper cell shape and the regulation of cell migration are essential processes in the development of an organism. The mixed lineage leukemia (MLL or KMT2A) protein, a histone 3 lysine 4 (H3K4) methyltransferase, plays a critical role in cell-fate decisions during skeletal development and haematopoiesis in higher vertebrates. Rho GTPases - RhoA, Rac1 and CDC42 - are small G proteins that regulate various key cellular processes, such as actin cytoskeleton formation, the maintenance of cell shape and cell migration. Here, we report that MLL regulates the homeostasis of these small Rho GTPases. Loss of MLL resulted in an abnormal cell shape and a disrupted actin cytoskeleton, which lead to diminished cell spreading and migration. MLL depletion affected the stability and activity of Rho GTPases in a SET domain-dependent manner, but these Rho GTPases were not direct transcriptional targets of MLL. Instead, MLL regulated the transcript levels of their chaperone protein RhoGDI1 (also known as ARHGDIA). Using MDA-MB-231, a triple-negative breast cancer cell line with high RhoGDI1 expression, we show that MLL depletion or inhibition by small molecules reduces tumour progression in nude mice. Our studies highlight the central regulatory role of MLL in Rho/Rac/CDC42 signalling pathways. This article has an associated First Person interview with the first author of the paper.

Keywords: Cell migration; Cell shape; H3K4 methylation; MLL; Rho GTPases; RhoGDI1.


Conflict of interest statement

Competing interests The authors declare no competing or financial interests.

Figures

Fig. 1
Fig. 1. Loss of MLL affects cell shape and actin cytoskeleton.
(A) U2OS cells, treated with control siRNA, MLL siRNA#1 and MLL siRNA#2 for 72 h were lysed and immunoblotted. Blots were probed with anti-MLL and anti-α-tubulin antibody as indicated. The MLL/tubulin ratios are indicated. (B,C) Control and MLL siRNA-treated U2OS cells were fixed and used for immunofluorescence (IF). Cells were stained using anti-α-tubulin (B, green) antibody or rhodamine-conjugated phalloidin (C, green). The nucleus was stained using DAPI (blue). White arrows in C, panels e,e′ indicate small protrusions and those in panels h,h′ indicate spine-like actin-rich filopodia. Panels c,f,i,c′,f′,i′ show magnified views of the boxed regions in panels b,e,h,b′,e′,h′, respectively. Scale bars: 10 µm. (D,E) Shape of the cells (D) or number of stress fibres in cells (E) treated with different siRNAs from (C) were quantified from three independent experiments as shown. Data represents mean±s.d. ****P<0.0001, one-way ANOVA with Dunnett’s multiple comparisons test. F-actin, filamentous actin; Cntl, control; M#1, MLL siRNA#1; M#2, MLL siRNA#2.
Fig. 2
Fig. 2. Depletion of MLL alters cell spreading and cell migration.
(A) Representative IF images of U2OS cells, treated with control or MLL siRNA#1 for 72 h, and plated on fibronectin-coated coverslips for 4 h. Phalloidin (green) and DAPI (blue) staining is shown. Scale bars: 10 µm. (B–D) Quantifications of area of spread (B), circularity (C) and aspect ratio (D) of control or MLL siRNA-treated cells. Data are represented as violin plot with all the data points and the median. ****P<0.0001, ***P<0.0004 (Student’s unpaired two-tailed t-test; n=40 cells and N=2 experiments). (E) Immunoblotting of lysates from U2OS cells treated with two different MLL shRNAs, probed with anti-MLL and anti-tubulin antibodies, is shown. The MLL/tubulin ratios are indicated. (F) U2OS cells were treated with control or MLL shRNA#1 for 48 h and transwell migration (Boyden chamber) assay was performed. Bright-field images show migrated cells upon treatment with the indicated shRNAs. Scale bars: 50 µm. (G,H) Quantifications for the number of U2OS (G) and MDA-MB-231 (H) cells migrated per field. Data are represented as mean±s.d. **P=0.0046, ***P=0.0006 (G); ****P<0.0001 (H) (one-way ANOVA with Dunnett’s multiple comparisons test; N=3 experiments). (I) U2OS cells treated with control or MLL shRNA#2 were incubated in medium containing thrombin (4 U/ml) for 48 h and seeded for transwell migration assay. Quantifications for the number of cells migrated per field is shown. For ease of comparison, data from G of control and MLL shRNA#2 treatments are replotted here. Data are represented as mean±s.d. **P=0.007 (bar 2) and 0.003 (bar 3); ***P=0.0002; ns, not significant, P=0.65 (one-way ANOVA with Tukey’s multiple comparisons test; N=3 experiments).
Fig. 3
Fig. 3. MLL and Rho GTPase depletion causes loss of actin dynamics and lamellipodium formation.
(A–C) Immunoblotting of whole-cell lysates of U2OS cells treated with control, RhoA, Rac1 and CDC42 siRNAs and probed with the respective antibodies are shown. GAPDH was used as a loading control. (D) IF of U2OS cells treated with the indicated siRNAs for 72 h. The cells were stained with phalloidin (green) and DAPI (blue). White arrows in panel c indicate fine actin stress fibres. (E) Quantification of the number of stress fibres in cells treated with the respective siRNAs from D. ***P<0.001; **P=0.001 (RhoA), 0.003 (Rac1) and 0.001(CDC42) (one-way ANOVA with Dunnett’s multiple comparisons test; n=40 cells and N=2 experiments). (F) Quantification of the number of stress fibres in control U2OS cells, and in U2OS expressing various mutants of MLL, treated with control or MLL#2 siRNAs. Datas in wild-type U2OS are the same as E and replotted here. **P=0.006; *P=0.019; ns, not significant, P=0.66 (MLL) and 0.89 (MLLΔTAD) (Student’s unpaired two-tailed t-test; n=40 cells and N=2 experiments). (G) U2OS cells expressing GFP–Lifeact were treated with control or MLL#1 siRNAs for 72 h, then imaged in SIM time-lapse mode at 5 s intervals. Representative images are shown with the time indicated in the mm.ss format (also see Movies 1–4). White arrows in the panels highlight regions with high actin dynamics. Kymographs are shown on left and the coloured lines therein indicate the particles selected for quantifying the average track velocities. (H) Formation of lamellipodia in control (panels a,b) and MLL-depleted (panels c,d) U2OS cells. Cell boundaries are marked in white in panel b,d, whereas magnified views of the dashed boxes are shown in panels e,f. (I) Number of cells with and without lamellipodia were quantified in cells treated with control or MLL#2 siRNAs. ****P<0.0001; ns, not significant, P>0.99. Downward error bars (blue) are shown for cells without lamellipodia and upward error bars (black) for cells with lamellipodia. (two-way ANOVA; n=60 cells and N=3 experiments). Data represent mean±s.d. Scale bars: 10 µm (D,G,H); 90 s (horizontal bars for kymographs in G), 10 µm (vertical bars for kymographs in G). ‘C’ denotes control and ‘T’ denotes MLL siRNA treatment; ΔTAD, trans-activation domain deletion; ΔSET, SET domain deletion.
Fig. 4
Fig. 4. Loss of MLL affects stability and activity of Rho GTPases.
(A) Immunoblotting of lysates from U2OS cells treated with control or MLL#1 siRNAs, probed with the indicated antibodies, is shown. Graphs on the right show the relative protein levels (with respect to the loading control). ****P<0.0001 for RhoA and CDC42; ***P=0.0001 and **P=0.0017 for MLL and Rac1, respectively (Student’s unpaired two-tailed t-test, N=3 experiments). (B) U2OS cells stably expressing GFP-tagged RhoA, Rac1 or CDC42 were either treated with control or MLL#2 shRNAs for 72 h. The cells were then lysed and subjected to pull-down using GST-tagged effector domains (see Materials and Methods). Immunoblot analysis indicate endogenous protein levels of MLL (panel a) and α-tubulin (panel b). Total protein levels (panels d,g,j) and active (GTP-bound) protein levels (panels c,f,i) of the indicated Rho GTPases, probed with anti-GFP antibody are shown. The blots shown in panels e,h,k, were probed with anti-GAPDH antibody. (C) Densitometric analyses of immunoblots from B of total protein levels relative to loading control (upper panel) and relative activity (ratio of active to total protein levels) upon depletion of MLL are shown. ****P<0.0001; ***P<0.005 (Student’s unpaired two-tailed t-test, N=3 experiments). (D) RT-qPCR analysis of gene expression upon MLL depletion. Relative gene expression was calculated using the −ΔΔCt method. *P=0.018 (Rac1); ***P<0.001 (MLL); ns, not significant, P=0.23 (RhoA) and 0.80 (CDC42) (Student’s unpaired two-tailed t-test, N=2 experiments). Data represent mean±s.d.
Fig. 5
Fig. 5. Downregulation of MLL affects the protein and transcript levels of RhoGDI1.
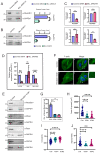
(A,B) Whole-cell lysates from control and MLL-depleted U2OS cells (A) and HEK293 control (Cas9-expressing cells) and MLL iKO#11 clonal cells (B) were immunoblotted and probed with antibodies against RhoGDI1 and GAPDH. Graphs indicate the quantifications of relative protein levels shown in A and B. ****P<0.0001 (A); ***P=0.0009 (B). (Student’s unpaired two-tailed t-test, N=3 experiments). (C) RT-qPCR analysis of gene expression upon MLL siRNA depletion. **P=0.005 (RhoGDI1) and 0.003 (MLL); P=0.06 (RhoGDI2) and 0.47 (RhoGDI3) (Student’s unpaired two-tailed t-test, N=2 experiments). (D) RT-qPCR analysis of gene expression of RHOGDI1 in wild-type U2OS and U2OS cells stably expressing various mutants of MLL upon depletion of endogenous MLL using siRNA#2. ns, not significant, P=0.50 for MLL; **P=0.005 and ****P<0.0001 (Student’s unpaired two-tailed t-test, N=2 experiments). (E) Whole-cell lysates of control U2OS and RhoGDI1 knockout (KO#1) cells were immunoblotted and probed as shown. (F) IF images of control U2OS and RhoGDI1 KO#1 cells are shown. Cells are stained with phalloidin. Scale bars: 10 µm. (G) Quantification of the number of stress fibres per cell in control U2OS, RhoGDI1 KO#1 and KO#2 clonal cell lines. ***P<0.001 (one-way ANOVA with Dunnett’s multiple comparisons test; n=80 cells and N=4 experiments for control, and n=40 cells and N=2 experiments for RhoGDI1 KO clones #1 and #2). (H–J) Quantification of area of spread (H), circularity (I) and aspect ratio (J) of U2OS and RhoGDI1 KO clones #1 and #2 spread on fibronectin-coated coverslips. ****P<0.0001, **P=0.0025 for RhoGDI1 KO clone #2 (J) (one-way ANOVA with Dunnett’s multiple comparisons test; n=40 cells and N=2 experiments). Data represent mean±s.d.
Fig. 6
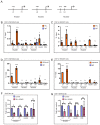
Fig. 6. MLL binds to the RHOGDI1 promoter to deposit the H3K4 trimethylation mark.
(A) Schematic of regions of genes for which the primers for ChIP assay were designed. Primers in promoters region are denoted by ‘P’ and upstream region by ‘U’. Considering the transcription start site as +1, the exact base positions of the respective upstream primers are indicated. (B,C) ChIP assay was performed using anti-MLL and IgG antibodies in IMR-90tert (B) and HEK293T (C) cell lines. The primers used are indicated in the graphs. (D,E) ChIP assay was performed using anti-H3K4me3 and IgG antibodies in IMR-90tert (D) and HEK293T (E) cell lines. (F,G) ChIP assay was performed using anti-MLL (F) and anti-H3K4me3 (G) antibodies in HEK293 control (Cas-9 expressing) and MLL KO clone #20 cell lines. The immunoprecipitated DNA was quantified with RT-qPCR and the results are plotted as the percentage enrichment relative to the input. Data represent mean±s.d. Two-way ANOVA was used. ns: not significant, P>0.05; *P≤0.05; **P≤0.01; ***P≤0.001; ****P≤0.0001. All experiments were done at least twice.
Fig. 7
Fig. 7. Exogenous expression of RhoGDI1 can rescue some phenotypes associated with loss of MLL.
(A) Western blot analysis of whole-cell lysates from U2OS cells as well as the GFP–RhoGDI1 cell line, treated with control and MLL#1 siRNAs for 72 h. The blots were probed with the indicated antibodies. (B) Wild-type U2OS cells and GFP–RhoGDI1-expressing cells were treated with control and MLL#2 shRNAs, and seeded for transwell migration assay. Bright-field images for migrated cells were captured at 10× magnification. Scale bars: 50 µm. (C) Quantification for the number of cells that migrated in B. *P=0.0214; **P=0.005; ***P<0.001 (one-way ANOVA with Dunnett’s multiple comparisons test; N=2 experiments). (D) RT-qPCR analysis of gene expression of RHOGDI1 in MDA-MB-231 cells upon treatment with 25 µM OICR-9429. Data represent mean±s.d. *P=0.0323 (Student’s unpaired two-tailed t-test; N=2 experiments). (E) MDA-MB-231 cells were treated with control (Cntl) or MLL#2 shRNAs for 48 h, or vehicle (Vhc, DMSO) or 25 µM OICR-9429 for 72 h, used for transwell migration assay and the number of migrated cells were quantified. Data represent mean±s.d. *P=0.0153; ***P=0.0008; (Student’s unpaired two-tailed t-test; N=2 experiments). (F) Tumours obtained from xenografts of MDA-MB-231 cells, treated with control, MLL#2 or RhoGDI1#2 shRNAs were harvested, weighed and plotted. *P=0.014; **P=0.007 (one-way ANOVA with Dunnett’s multiple comparisons test; n=5, 6 and 7 animals for control, MLL and RhoGDI1 shRNA treatment groups, respectively). (G) Tumours obtained after treatment with vehicle (DMSO) or 4 mg/kg OICR-9429 were harvested, weighed and plotted. Data represent violin plots with all datapoints. **P=0.008 (Student’s unpaired two-tailed t-test; n=5 animals each).

References

    1. Ali A, Veeranki SN, Tyagi S. A SET-domain-independent role of WRAD complex in cell-cycle regulatory function of mixed lineage leukemia. Nucleic Acids Res. 2014;42:7611–7624. doi: 10.1093/nar/gku458. - DOI - PMC - PubMed
    1. Ali A, Veeranki SN, Chinchole A, Tyagi S. MLL/WDR5 complex regulates Kif2A localization to ensure chromosome congression and proper spindle assembly during mitosis. Dev Cell. 2017;41:605–622.:e7. doi: 10.1016/j.devcel.2017.05.023. - DOI - PubMed
    1. Ansari KI, Kasiri S, Mandal SS. Histone methylase MLL1 has critical roles in tumor growth and angiogenesis and its knockdown suppresses tumor growth in vivo. Oncogene. 2013;32:3359–3370. doi: 10.1038/onc.2012.352. - DOI - PMC - PubMed
    1. Artinger EL, Mishra BP, Zaffuto KM, Li BE, Chung EKY, Moore AW, Chen Y, Cheng C, Ernst P. An MLL-dependent network sustains hematopoiesis. Proc Natl Acad Sci USA. 2013;110:12000–12005. doi: 10.1073/pnas.1301278110. - DOI - PMC - PubMed
    1. Azim AC, Barkalow K, Chou J, Hartwig JH. Activation of the small GTPases, rac and cdc42, after ligation of the platelet PAR-1 receptor. Blood. 2000;95:959–964. doi: 10.1182/blood.V95.3.959.003k22_959_964. - DOI - PubMed

Publication types

MeSH terms