. 2022 Sep 30;131(8):654-669.
doi: 10.1161/CIRCRESAHA.121.320449. Epub 2022 Sep 16.

Transcriptional and Immune Landscape of Cardiac Sarcoidosis

Affiliations

Transcriptional and Immune Landscape of Cardiac Sarcoidosis

Jing Liu et al. Circ Res. .

Abstract

Background: Cardiac involvement is an important determinant of mortality among sarcoidosis patients. Although granulomatous inflammation is a hallmark finding in cardiac sarcoidosis, the precise immune cell populations that comprise the granuloma remain unresolved. Furthermore, it is unclear how the cellular and transcriptomic landscape of cardiac sarcoidosis differs from other inflammatory heart diseases.

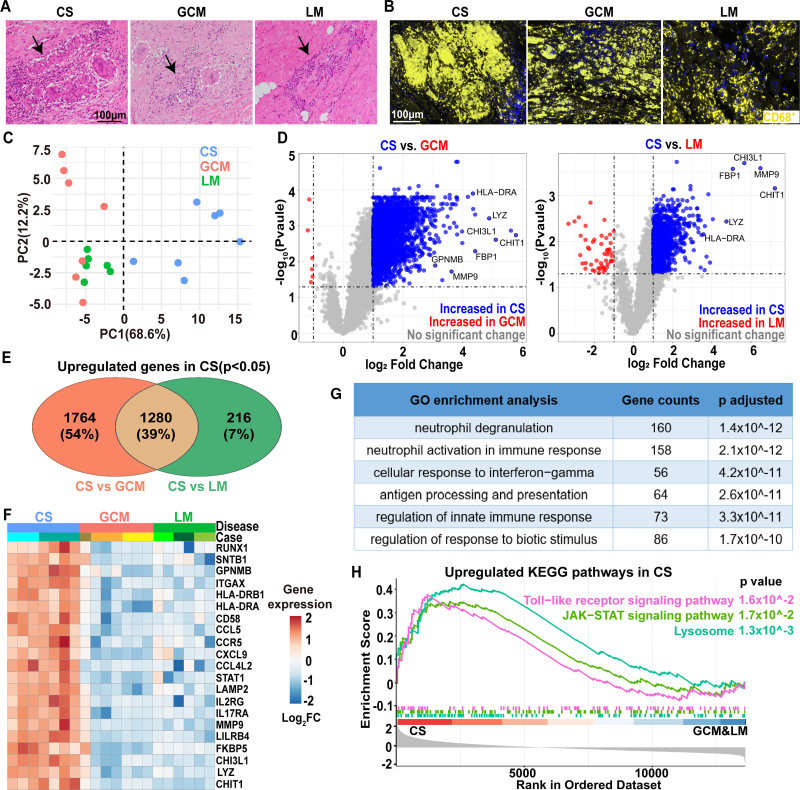
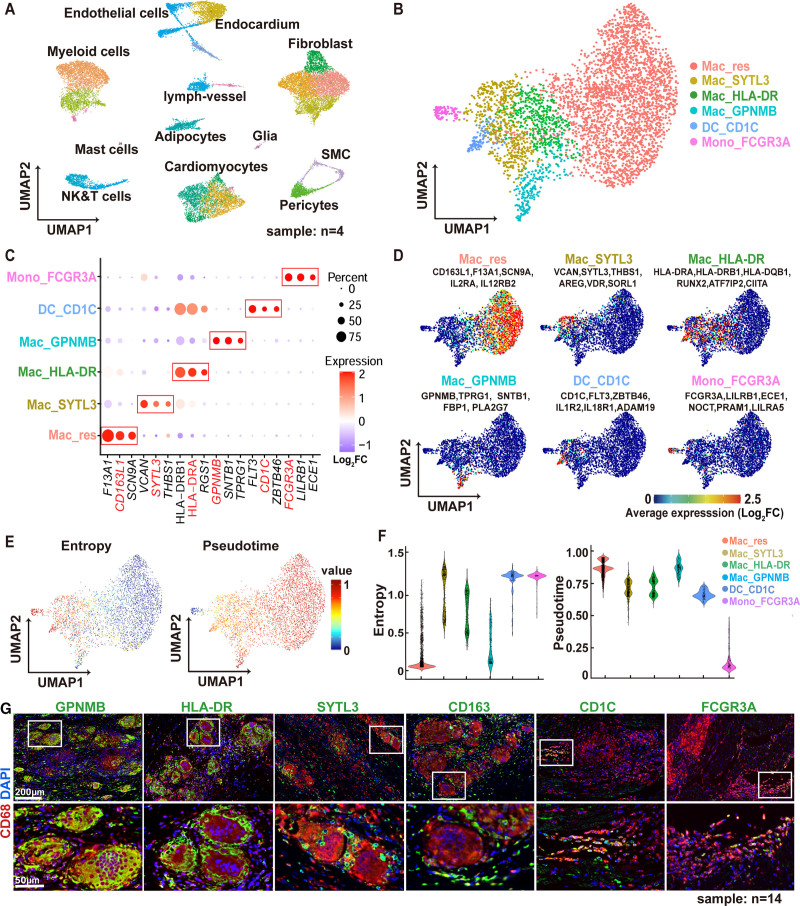
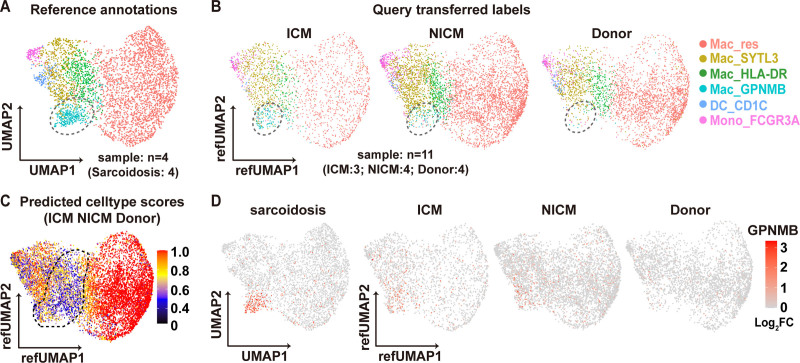
Methods: We leveraged spatial transcriptomics (GeoMx digital spatial profiler) and single-nucleus RNA sequencing to elucidate the cellular and transcriptional landscape of cardiac sarcoidosis. Using GeoMX digital spatial profiler technology, we compared the transcriptomal profile of CD68+ rich immune cell infiltrates in human cardiac sarcoidosis, giant cell myocarditis, and lymphocytic myocarditis. We performed single-nucleus RNA sequencing of human cardiac sarcoidosis to identify immune cell types and examined their transcriptomic landscape and regulation. Using multichannel immunofluorescence staining, we validated immune cell populations identified by single-nucleus RNA sequencing, determined their spatial relationship, and devised an immunostaining approach to distinguish cardiac sarcoidosis from other inflammatory heart diseases.

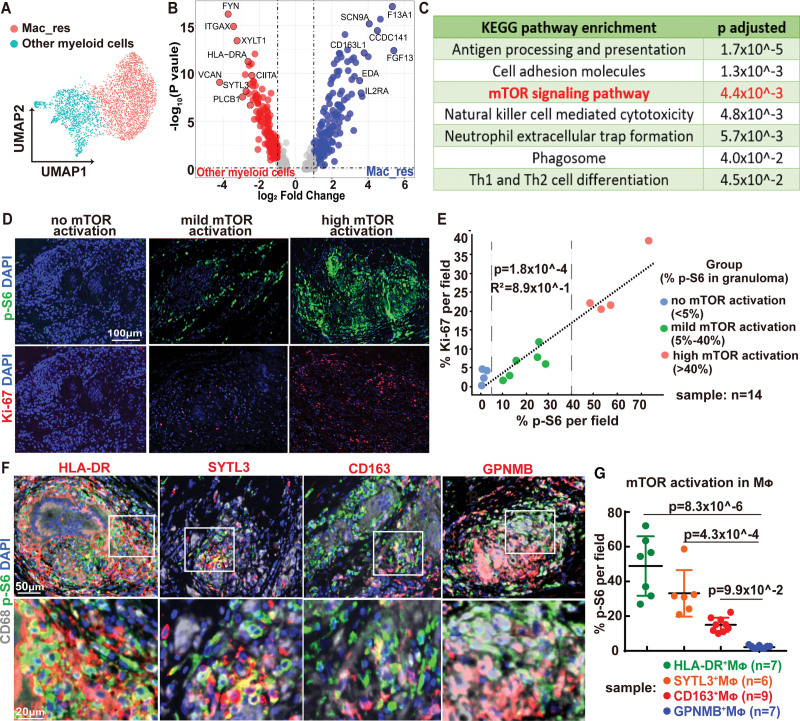
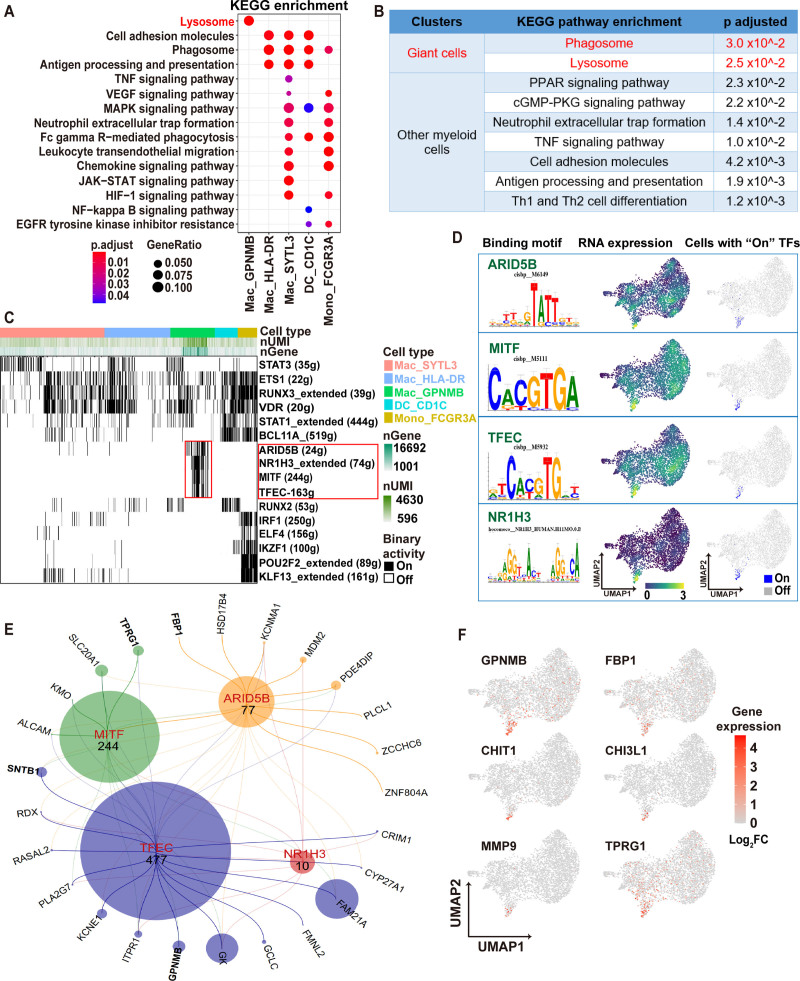
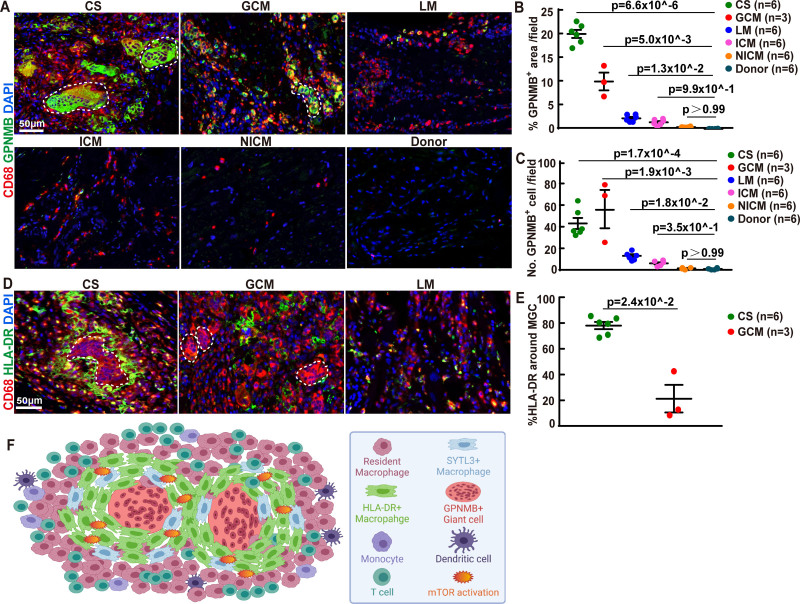
Results: Despite overlapping histological features, spatial transcriptomics identified transcriptional signatures and associated pathways that robustly differentiated cardiac sarcoidosis from giant cell myocarditis and lymphocytic myocarditis. Single-nucleus RNA sequencing revealed the presence of diverse populations of myeloid cells in cardiac sarcoidosis with distinct molecular features. We identified GPNMB (transmembrane glycoprotein NMB) as a novel marker of multinucleated giant cells and predicted that the MITF (microphthalmia-associated transcription factor) family of transcription factors regulated this cell type. We also detected additional macrophage populations in cardiac sarcoidosis including HLA-DR (human leukocyte antigen-DR)+ macrophages, SYTL3 (synaptotagmin-like protein 3)+ macrophages and CD163+ resident macrophages. HLA-DR+ macrophages were found immediately adjacent to GPMMB+ giant cells, a distinct feature compared with other inflammatory cardiac diseases. SYTL3+ macrophages were located scattered throughout the granuloma and CD163+ macrophages, CD1c+ dendritic cells, nonclassical monocytes, and T cells were located at the periphery and outside of the granuloma. Finally, we demonstrate mTOR (mammalian target of rapamycin) pathway activation is associated with proliferation and is selectively found in HLA-DR+ and SYLT3+ macrophages.

Conclusions: In this study, we identified diverse populations of immune cells with distinct molecular signatures that comprise the sarcoid granuloma. These findings provide new insights into the pathology of cardiac sarcoidosis and highlight opportunities to improve diagnostic testing.

Keywords: giant cells; granuloma; inflammation; macrophages; myocarditis; sarcoidosis.


Figures

Figure 1.
Figure 1.
Distinct transcriptomic signatures of myeloid cell aggregates in cardiac sarcoidosis. A, Representative histology (by hematoxylin and eosin staining) of cardiac sarcoidosis (CS), giant cell myocarditis (GCM), and lymphocytic myocarditis (LM). Black arrows: areas with inflammation; dashed lines: multinucleated giant cells. Scale bar: 100 μm. B, Representative images of immunofluorescence staining for CS, GCM, and LM specimens in the region of interests (ROIs) for NanoString analysis. CD68: yellow; DAPI (4′,6-diamidino-2-phenylindole): blue. Scale bar: 100 μm. C, Principal Component Analysis of transcriptome of CD68+ cells in CS, GCM, and LM. Each dot represents a ROI. CS: 7 ROIs from 2 cases; GCM: 7 ROIs from 3 cases; LM: 6 ROIs from 3 case. D, Volcano plots showing differentially expressed genes (DEGs) between CS vs GCM (left) and CS vs LM (right). Gray: not significantly differentially expressed; blue: upregulated in CS (log2 fold change>1, false discovery rate [FDR] P<0.05); red: upregulated in GCM or LM (log2 fold change<−1, FDR P<0.05). P values were obtained by FDR corrected empirical Bayes moderated T statistics in R package Limma. E, Venn diagram showing overlap of DEGs that are upregulated in CS using DEGs from D. F, Heatmap of representative gene expression (population averages) for CS, GCM, and LM. G, Gene ontology (GO) pathway analysis based on 1280 shared genes in E showing top three pathways upregulated in CS compared with GCM and LM. P values were calculated by hypergeometric distribution using R package ClusterProfiler. H, Gene set enrichment analysis plot showing selected significant enrichment pathways for sarcoidosis compared to GCM and LM. P values were obtained by permutation test using R package ClusterProfiler. CHIT1 indicates chitinase 1; CHI3L-1, chitinase-3-like protein 1; FBP, Fructose-1,6-bisphosphatase; FC, Fold Change; GPNMB, transmembrane glycoprotein NMB; ITAGX, Integrin Subunit Alpha X; JAK-STAT,Janus kinases-signal transducer and activator of transcription; KEGG, Kyoto Encyclopedia of Genes and Genomes; LYZ, lysosomal enzyme; MMP, Matrix metallopeptidase; PC, principle component; RUNX1, runt-related transcription factor 1; and SNTB1, beta-1-syntrophin.
Figure 2.
Figure 2.
Cellular and transcriptomic landscape of cardiac sarcoidosis. A, The uniform manifold approximation and projection (UMAP) projection of 23 772 cells from 4 cardiac sarcoidosis patients, showing 12 major cell types. B, The UMAP projection of 3970 myeloid cells, showing 6 myeloid subclusters. C, Dot plot of expression levels of the signature markers for each myeloid subcluster. Red boxes highlight the prominent patterns defining each myeloid cell subcluster. Color scale denotes log2 fold change (log2FC) of relative gene expression. D, Mean expression feature plots of selected marker genes in each myeloid cell subcluster. Color scale denotes average gene expression. E, UMAP projection of differentiation potential/entropy (left) and palantir pseudotime (right) for myeloid cells. F, Violin plots showing the entropy (left) and pseudotime (right) for the 6 myeloid cell subclusters. G, Immunofluorescence staining for CD68 (red) and signature myeloid subcluster markers (GPNMB [transmembrane glycoprotein NMB], human leukocyte antigen–DR isotype [HLA-DR (human leukocyte antigen-DR isotype,L243,1:750;Abcam)], SYTL3 [synaptotagmin-like protein 3], CD163, CD1C, CD16a, green) in archival cardiac sarcoidosis (CS) human heart samples. Blue: DAPI (4′,6-diamidino-2-phenylindole). Representative images from 14 independent samples. White boxes indicate zoomed-in areas displayed on the bottom row. Scale bars: 200 μm (top row) and 50 µm (bottom row). ADAM19 indicates ADAM Metallopeptidase Domain 19; ATF7IP2, Activating Transcription Factor 7 Interacting Protein 2; AREG, Amphiregulin; CD163L1,CD163 Molecule Like 1; CIITA, Class II Major Histocompatibility Complex Transactivator; ECE1, Endothelin Converting Enzyme 1; FBP1, Fructose-Bisphosphatase 1; FC, Fold Change; FCGR3A, low-affinity immunoglobulin gamma Fc region receptor III-A; F13A1,Coagulation Factor XIII A Chain; FLT3,Fms Related Receptor Tyrosine Kinase 3; GPNMB, Glycoprotein Nmb; HLA-DR, human leukocyte antigen–DR isotype; HLA-DRB1, Major Histocompatibility Complex, Class II, DR Beta 1; HLA-DQB1, Major Histocompatibility Complex, Class II, DQ Beta 1; IL1R, Interleukin 1 Receptor; IL2RA, Interleukin 2 Receptor Subunit Alpha; IL12RB2, Interleukin 12 Receptor Subunit Beta 2; IL18R1, Interleukin 18 Receptor Type 1; LILRA5,Leukocyte Immunoglobulin Like ADAM19 indicates ADAM Metallopeptidase Domain 19; ATF7IP2, Activating Transcription Factor 7 Interacting Protein 2; AREG, Amphiregulin; CD163L1,CD163 Molecule Like 1; CIITA, Class II Major Histocompatibility Complex Transactivator; ECE1, Endothelin Converting Enzyme 1; FBP1, Fructose-Bisphosphatase 1; FC, Fold Change; FCGR3A, low-affinity immunoglobulin gamma Fc region receptor III-A; F13A1,Coagulation Factor XIII A Chain; FLT3,Fms Related Receptor Tyrosine Kinase 3; GPNMB, Glycoprotein Nmb; HLA-DR, human leukocyte antigen–DR isotype; HLA-DRB1, Major Histocompatibility Complex, Class II, DR Beta 1; HLA-DQB1, Major Histocompatibility Complex, Class II, DQ Beta 1; IL1R, Interleukin 1 Receptor; IL2RA, Interleukin 2 Receptor Subunit Alpha; IL12RB2, Interleukin 12 Receptor Subunit Beta 2; IL18R1, Interleukin 18 Receptor Type 1; LILRA5,Leukocyte Immunoglobulin Like Receptor A5 LILRB1, Leukocyte Immunoglobulin Like Receptor B1; mac, macrophage; Mac_res, resident macrophages; NOCT, Nocturnin; PLA2G7,Phospholipase A2 Group VII; PRAM1, PML-RARA Regulated Adaptor Molecule 1; RUNX2, RUNX Family Transcription Factor 2; SCN9A, Sodium Voltage-Gated Channel Alpha Subunit 9; SMC, smooth muscle cells; SNTB1, Syntrophin Beta 1; SORL1, Sortilin Related Receptor 1; SYTL3,Synaptotagmin Like 3; THBS1,Thrombospondin 1; TPRG1, Tumor Protein P63 Regulated 1; VCAN,Versican; VDR, Vitamin D Receptor; and ZBTB46, Zinc Finger And BTB Domain Containing 46.
Figure 3.
Figure 3.
mTOR (mammalian target of rapamycin) pathway activation and macrophage proliferation in cardiac sarcoidosis. A, Uniform manifold approximation and projection (UMAP) projection of resident macrophages (Mac_res) and other myeloid cells. B, Volcano plot showing the differentially expressed genes (DEGs) between Mac_res and other myeloid cells. P values were obtained by Wilcoxon Rank Sum test using R package Seurat (v4). Gray dot: no significant change; Red dot: upregulated in other myeloid cells (log2 fold change>1, FDR P<0.05); Blue dot: upregulated in resident macrophages (log2 fold change<−1, false discovery rate [FDR] P<0.05). C, Kyoto Encyclopedia of Genes and Genomes (KEGG) pathway enrichment analysis based on DEGs showing top upregulated pathways in other myeloid cells compared to resident macrophages. P values calculated by hypergeometric distribution using R package ClusterProfiler. D, Immunofluorescence staining of p-S6 (phospho-S6 ribosomal protein; green) and Ki67 (red) of cardiac sarcoidosis tissue. Representative images from no-, mild-, and high-mTOR activation cases. Blue: DAPI (4′,6-diamidino-2-phenylindole). Scale bar: 100 μm. E, Quantification of p-S6 and Ki67 immunoreactivity in cardiac sarcoidosis (CS) granulomas with strong correlation (R2=0.886) and significance (P=1.8×10⁻⁴). p-S6 and Ki67 staining was scored in 14 cardiac sarcoidosis samples. The relationship was investigated using Pearson correlation coefficient test. 14 CS samples were divided into 3 groups according to the percent of p-S6 positive cells in the granuloma (no mTOR activation: %p-S6 positive cells in granuloma <5%; mild mTOR activation: %p-S6–positive cells in granuloma between 5% to 40%; high-mTOR activation: %p-S6 positive cells in granuloma >40%). F, Immunofluorescence staining for CD68 (white), p-S6 (green), and macrophage subcluster markers (HLA-DR [Human Leukocyte Antigen – DR isotype], SYTL3 [synaptotagmin-like protein 3], CD163, GPNMB [transmembrane glycoprotein NMB], red) of granulomas in cardiac sarcoidosis. DAPI: blue. White boxes indicate the zoomed-in areas displayed on the bottom row. Scale bar represents 50 μm (top row) and 20 µm (bottom row). G, Dot plots showing the percentage of p-S6 positive cells in macrophage subclusters (Mac_res [CD163+MΦ, n=9]; Mac_HLA-DR [HLA-DR+MΦ, n=7]; Mac_SYTL3 [SYTL3+MΦ, n=6]; and Mac_GPNMB [GPNMB+MΦ, n=6]) in cardiac sarcoidosis granulomas with mean±SD shown in lines. Statistics was performed using one-way ANOVA with Dunn post hoc test. CCDC141 indicates coiled-coil domain containing 141; CD163L1, CD163 molecule like 1; CIITA, class II major histocompatibility complex transactivator; EDA, ectodysplasin A; FGF13, fibroblast growth factor 13; FYN, Src family tyrosine kinase; F13A1, coagulation factor XIII A chain; HLA-DR, human leukocyte antigen – DR isotype; IL2RA, interleukin 2 receptor subunit alpha; ITGAX, integrin subunit alpha X; PLCB1, phospholipase C beta 1; SCN9A, sodium voltage-gated channel alpha subunit 9; SYTL3, synaptotagmin-like protein 3; Th, T helper; VCAN, versican; and XYLT1, xylosyltransferase 1.
Figure 4.
Figure 4.
Multinucleated giant cells display a specific transcriptional regulatory network. A, Dot plot of Kyoto Encyclopedia of Genes and Genomes (KEGG) enrichment analysis based on cell type–specific marker genes showing top pathways upregulated in myeloid subclusters other than resident macrophages. P values were calculated by hypergeometric distribution using R package ClusterProfiler. Detailed P values were provided in Table S4. B, KEGG pathway enrichment showing significant enrichment pathways for giant cells (red font) compared to other nonresident myeloid cells (black font). P values calculated by hypergeometric distribution using R package ClusterProfiler. C, Binary heatmap generated from the binary activities of the TF (transcription factor) regulons for myeloid cells, with black blocks representing cells that are on (with activated TF regulon). The identity of cell type was assigned by established cluster information in single-nucleus RNA sequencing (snRNA-seq) data. Red boxes highlight the specific and activated TF regulons in giant cells. Top bars show the cell type information, the number of genes and unique molecular identifiers. D, Four specific regulons in giant cells are highlighted: ARID5B (AT-rich interactive domain-containing protein 5B), MITF (microphthalmia-associated transcription factor), TFEC (transcription factor EC), and NR1H3 (liver X receptor alpha). For each TF identified, the specific motif along with the promotor binding motif (left), the RNA expression values of that TF (middle), and the cells passed the binary threshold set in the AUC histogram (right) are shown. E, A network generated with iRegulon using ARID5B, MITF, TFEC, and NR1H3 target genes identified by Single-Cell Regulatory Network Inference and Clustering (SCENIC) as an input. The nodes, representing the TF regulons sized by the number of their motifs. The edges, representing the connections between each of the 5 TFs, and their target genes and shown as a line colored based on the TFs. Input target genes shown in the network are identified as marker genes for giant cells in snRNA-seq analysis. F, Z score normalized mean expression of 6 genes identified in digital spatial profiler analysis (Figure 1). Color scale denotes log2FC of gene expression. ALCAM, activated leukocyte cell adhesion molecule; ARID5B, AT-Rich interaction domain 5B; BCL11A, BAF chromatin remodeling Complex Subunit BCL11A; CHIT1, chitinase 1; CHI3L-1 indicates chitinase-3-like protein 1; CRIM1, cysteine rich transmembrane BMP regulator 1; CYP27A1, cytochrome P450 family 27 subfamily A member 1; ELF4, E74 like ETS transcription factor 4; EGFR, epidermal growth factor receptor; ETS1,ETS proto-oncogene 1; FAM21A, WASH complex subunit 2A; FBP, fructose-bisphosphatase; FBP1, fructose-bisphosphatase 1; FC, fold change; FCGR3A, low-affinity immunoglobulin gamma Fc region receptor III-A; GCLC, glutamate-cysteine ligase catalytic subunit; GK, glycerol kinase; GPNMB, glycoprotein Nmb; HIF, hypoxia Inducible factor; HSD17B4, hydroxysteroid 17-beta dehydrogenase 4; IKZF1, IKAROS family zinc finger 1; IRF1, interferon regulatory factor 1; ITPR1, Inositol 1,4,5-trisphosphate receptor type 1; JAK-STAT, janus kinase-signal transducer and activator of transcription; KCNE1, potassium voltage-gated channel subfamily E regulatory subunit 1; KCNMA1, potassium calcium-activated channel subfamily M alpha 1; KLF13, KLF transcription factor 13; KMO, kynurenine 3-monooxygenase; Mac, macrophage; MAPK, mitogen-activated protein kinase; MDM2, MDM2 proto-oncogene; MITF, melanocyte inducing transcription factor; MMP, matrix metalloproteinase; NF, nuclear factor; NMB; HLA-DR, human leukocyte antigen–DR isotype; NR1H3, nuclear receptor subfamily 1 group H member 3; PDE4DIP, phosphodiesterase 4D interacting protein; PKG; PKG protein kinase G; PLA2G7, phospholipase A2 group VII; PLCL1, phospholipase C like 1; POU2F2, POU class 2 homeobox 2; PPAR, peroxisome proliferator activated receptor; RASAL2, RAS protein activator like 2; RDX, radixin; RUNX2, RUNX family transcription factor 2; RUNX3, RUNX family transcription factor 3; SLC20A1, solute carrier family 20 member 1 SNTB1, syntrophin beta 1; STAT1, signal transducer and activator of transcription 1; STAT3, signal transducer and activator of transcription 3; SYTL3, synaptotagmin-like protein 3. TFEC, transcription factor EC; Th, T helper; TNF, tumor necrosis factor; TPRG, tumor protein P63 regulated 1; TPRG1,tumor protein P63 regulated 1; UMAP, uniform manifold approximation and projection; VDR, vitamin D receptor; VEGF, vascular endothelial growth factor A; ZCCHC6, terminal uridylyl transferase 7; and ZNF804A, zinc finger protein 804A.
Figure 5.
Figure 5.
Reference mapping of myeloid subpopulations in query datasets. A and B, Integration and reference mapping of query data from donor (n=4), nonischemic cardiomyopathy (NICM; n=4) and ICM (n=3) hearts (B) onto the cardiac sarcoidosis (n=4) myeloid reference uniform manifold approximation and projection (UMAP) (A). The circle area indicates the Mac_GPNMB (transmembrane glycoprotein NMB) cluster. C, Feature plot of prediction scores for various myeloid subpopulation in the query datasets (NICM, donor and ICM). The circled area indicates the Mac_human leukocyte antigen–DR isotype (HLA-DR) and Mac_GPNMB clusters. D, Mean expression feature plot of GPNMB in cardiac sarcoidosis, ICM, NICM, and donor myeloid clusters. Color scale denotes log2FC of gene expression. FC indicates fold change; FCGR3A, low affinity immunoglobulin gamma Fc region receptor III-A; Mac, macrophage; and SYTL3, synaptotagmin-like protein 3.
Figure 6.
Figure 6.
GPNMB (transmembrane glycoprotein NMB) and HLA-DR (human leukocyte antigen-DR isotype) immunostaining distinguishes cardiac sarcoidosis from other forms of myocarditis. A, Immunofluorescence staining of CD68 (red) and GPNMB (green) in heart tissues from patients with cardiac sarcoidosis (CS), giant cell myocarditis (GCM), lymphocytic myocarditis (LM), ischemic cardiomyopathy (ICM), nonischemic cardiomyopathy (NICM), and normal subjects. Blue: DAPI. Representative images from 6 independent samples. Scale bar represents 50 µm. B, Dot plots showing the percentage of GPNMB+ area in heart tissue from patients with CS (n=6), GCM (n=3), LM (n=6), ICM (n=6), NICM (n=6), and normal subject (n=6) with Mean±SD shown in lines. Statistics was performed using Kruskal-Wallis with Dunn post hoc test. C, Dot plots showing GPNMB+ cell numbers per 20X field in heart tissue from patients with CS (n=6), GCM (n=3), LM (n=6), ICM (n=6), NICM (n=6), and normal subject (n=6) with Mean±SD shown in lines. Statistics was performed using Kruskal-Wallis with Dunn post hoc test. D, Immunofluorescence staining of CD68 (red) and HLA-DR (green) in cardiac tissue from patients with CS, GCM, and LM. Blue: DAPI (4′,6-diamidino-2-phenylindole). Representative images from 6 independent samples. Scale bar: 50 µm. White dotted line: multinucleated giant cells. E, Dot plots showing cell numbers of HLA-DR+ cell around the giant cell in cardiac tissue from patients with CS (n=6) and GCM (n=3) with mean±SD shown in lines. Significance was tested using Mann-Whitney test, two-tailed. F, Pictorial representation of the cellular diversity and spatial pattern of the typical granuloma in cardiac sarcoidosis. mTOR indicates mammalian target of rapamycin; and SYTL3, synaptotagmin-like protein 3.

Comment in

Similar articles

Cited by

References

    1. Iannuzzi MC, Rybicki BA, Teirstein AS. Sarcoidosis. N Engl J Med. 2007;357:2153–2165. doi: 10.1056/NEJMra071714 - PubMed
    1. Yatsynovich Y, Dittoe N, Petrov M, Maroz N. Cardiac sarcoidosis: a review of contemporary challenges in diagnosis and treatment. Am J Med Sci. 2018;355:113–125. doi: 10.1016/j.amjms.2017.08.009 - PubMed
    1. Ardehali H, Howard DL, Hariri A, Qasim A, Hare JM, Baughman KL, Kasper EK. A positive endomyocardial biopsy result for sarcoid is associated with poor prognosis in patients with initially unexplained cardiomyopathy. Am Heart J. 2005;150:459–463. doi: 10.1016/j.ahj.2004.10.006 - PubMed
    1. Matsui Y, Iwai K, Tachibana T, Fruie T, Shigematsu N, Izumi T, Homma AH, Mikami R, Hongo O, Hiraga Y., et al. . Clinicopathological study of fatal myocardial sarcoidosis. Ann N Y Acad Sci. 1976;278:455–469. doi: 10.1111/j.1749-6632.1976.tb47058.x - PubMed
    1. Perry A, Vuitch F. Causes of death in patients with sarcoidosis. A morphologic study of 38 autopsies with clinicopathologic correlations. Arch Pathol Lab Med. 1995;119:167–172. - PubMed

Publication types