. 2023 Jan;36(1):19-32.
doi: 10.1111/pcmr.13068. Epub 2022 Oct 3.

Epigenetic and pharmacological control of pigmentation via Bromodomain Protein 9 (BRD9)

Affiliations

Epigenetic and pharmacological control of pigmentation via Bromodomain Protein 9 (BRD9)

Tupa Basuroy et al. Pigment Cell Melanoma Res. 2023 Jan.

Abstract

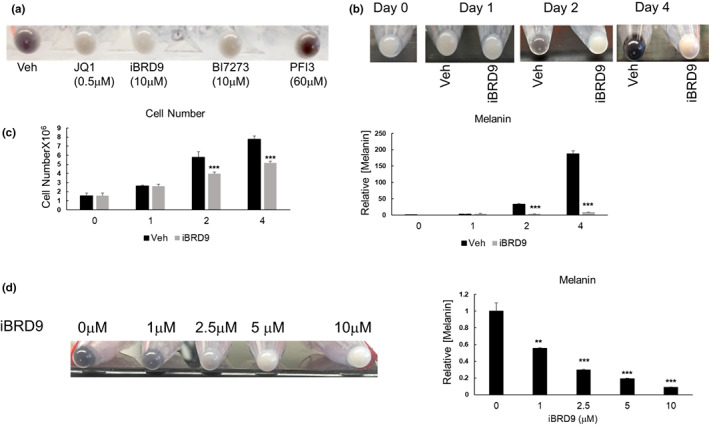
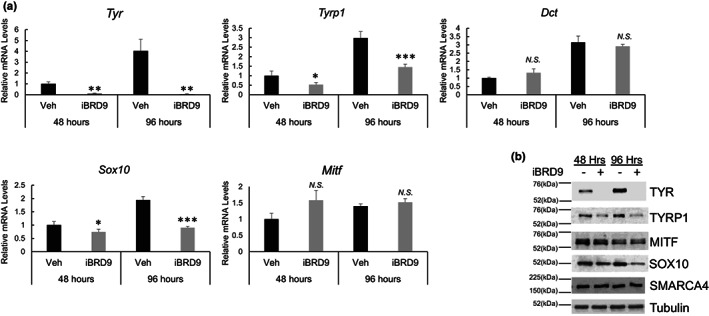
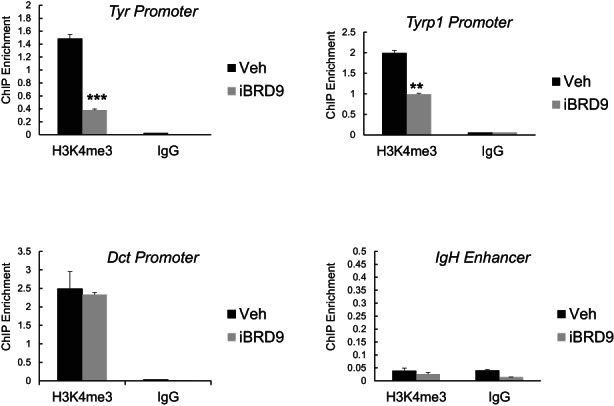
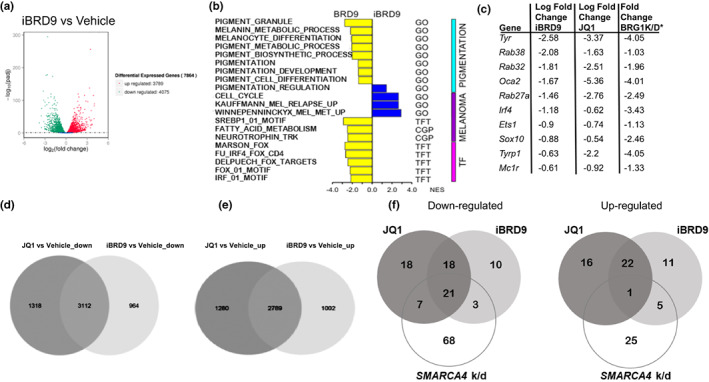
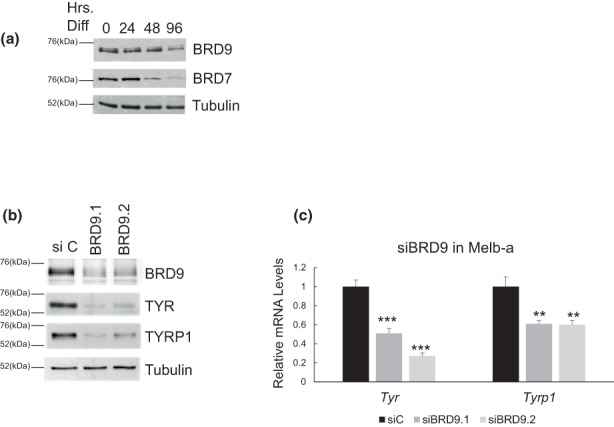
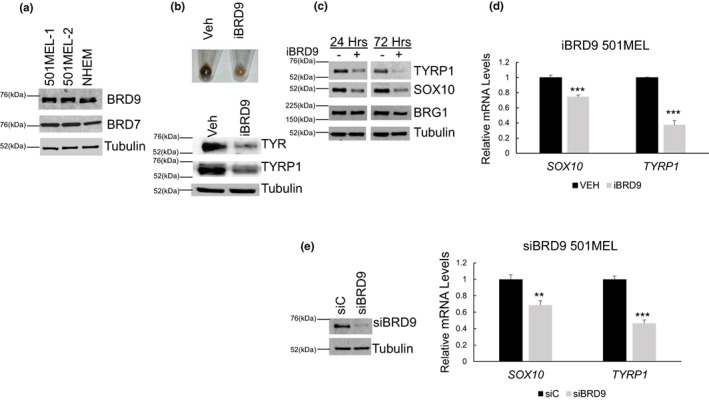
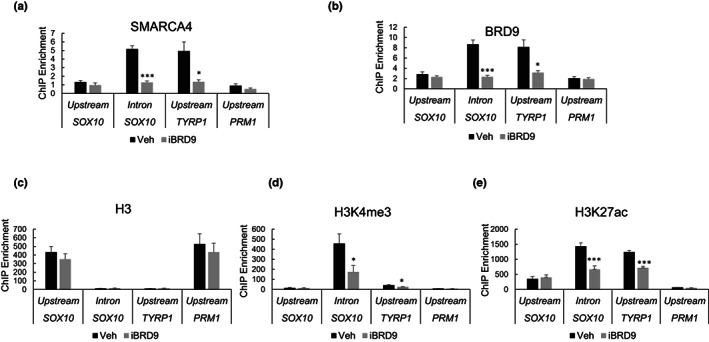
Lineage-specific differentiation programs are activated by epigenetic changes in chromatin structure. Melanin-producing melanocytes maintain a gene expression program ensuring appropriate enzymatic conversion of metabolites into the pigment, melanin, and transfer to surrounding cells. During neuroectodermal development, SMARCA4 (BRG1), the catalytic subunit of SWItch/Sucrose Non-Fermentable (SWI/SNF) chromatin remodeling complexes, is essential for lineage specification. SMARCA4 is also required for development of multipotent neural crest precursors into melanoblasts, which differentiate into pigment-producing melanocytes. In addition to the catalytic domain, SMARCA4 and several SWI/SNF subunits contain bromodomains which are amenable to pharmacological inhibition. We investigated the effects of pharmacological inhibitors of SWI/SNF bromodomains on melanocyte differentiation. Strikingly, treatment of murine melanoblasts and human neonatal epidermal melanocytes with selected bromodomain inhibitors abrogated melanin synthesis and visible pigmentation. Using functional genomics, iBRD9, a small molecule selective for the bromodomain of BRD9 was found to repress pigmentation-specific gene expression. Depletion of BRD9 confirmed a requirement for expression of pigmentation genes in the differentiation program from melanoblasts into pigmented melanocytes and in melanoma cells. Chromatin immunoprecipitation assays showed that iBRD9 disrupts the occupancy of BRD9 and the catalytic subunit SMARCA4 at melanocyte-specific loci. These data indicate that BRD9 promotes melanocyte pigmentation whereas pharmacological inhibition of BRD9 is repressive.

Keywords: BRD9; SWI/SNF; bromodomain; chromatin remodeling; epigenetic; melanocyte differentiation; melanoma; pigmentation.


Conflict of interest statement

The authors declare that there are no conflicts of interest.

Figures

FIGURE 1
FIGURE 1
Effects of bromodomain inhibitors on melanin synthesis and proliferation. Melb‐a cells were cultured in growth media then transferred to differentiation medium to which vehicle or a bromodomain inhibitor was added. (a) Melb‐a cells were cultured for 48 h in differentiation medium containing vehicle (Veh), JQ1 (0.5 μM), iBRD9 (10 μM), BI7273 (10 μM), and PFI‐3 (30 μM). Cells were pelleted and photographed. (b) Melb‐a cells were cultured in differentiation media with vehicle (Veh) or 10 μM iBRD9 for the indicated number of days. Photographed cell pellets are shown. (c) Melb‐a cells were cultured for the indicated number of days in differentiation media containing vehicle or 10 μM iBRD9, then counted. Left: Cell numbers are shown. Right: 1.5 × 106 cells were subjected to the melanin assay. Numbers were normalized to the vehicle treated control. (d) Melb‐a cells were cultured in differentiation media in the presence of vehicle or the indicated concentrations of iBRD9 for 4 days. Left: Cells were pelleted and photographed. Right: 1.5 × 106 cells were subjected to the melanin assay. Numbers were normalized to the vehicle treated control. Representative pictures from three or more experiments are shown. Graphs indicate the average of three or more independent experiments. Standard error bars are shown (*p < .05, **p < .01, ***p < .001).
FIGURE 2
FIGURE 2
iBRD9 inhibits melanocyte‐specific gene expression in Melb‐a cells. Melb‐a cells were cultured in differentiation media in the presence of vehicle or 10 μM iBRD9. Cells were harvested at the indicated time points and subjected to (a). qRT‐PCR. Tyr, Tyrp1, or Dct levels were normalized to that of Rpl7. The data are the average of three independent experiments. Standard error bars are shown (*p < .05, **p < .01, ***p < .001). (b) subjected to Western blot using the indicated antibodies. Tubulin is a loading control. The figure is representative of three or more experiments.
FIGURE 3
FIGURE 3
iBRD9 decreases H3K4me3 levels at melanogenic enzyme loci. Melb‐a cells were cultured in differentiation media containing vehicle (Veh) or 10 μM iBRD9 for 48 h. Cells were harvested for chromatin immunoprecipitations (ChIPs) with an antibody to histone H3 trimethylated at lysine 4 (H3K3me3) or control IgG. ChIPs were quantified by qPCR using primers to the promoters of melanogenic enzyme genes and as a control, the silent IgH enhancer. Normalization was to input. The data are the average of two experiments analyzed in triplicate. Standard error bars are shown (*p < .05, **p < .01, ***p < .001).
FIGURE 4
FIGURE 4
Transcriptomic changes in iBRD9‐treated Melb‐a cells. Melb‐a cells were cultured for 48 h in differentiation media that contained either vehicle or 10 μM iBRD9. RNA from three biological replicates was subjected to RNA‐seq. Differential gene expression between vehicle (DMSO) and 10 μM iBRD9‐treated Melb‐a cells was determined from RNA‐seq data (p < .05). (a) Plot showing the number of up and down‐regulated genes. Red dots represent genes which are significantly up‐regulated by iBRD9, green dots represent genes that are significantly down‐regulated by iBRD9, and blue dots represent non‐significant changes in gene expression. (b) Analysis of pathways relevant to pigmentation and overlap in differentially regulated genes with the indicated data sets was conducted. Normalized enrichment score (NES) is the enrichment score for the gene set after it has been normalized across analyzed gene sets. Yellow bars represent processes that are significantly down‐regulated by iBRD (negative numbers), and blue bars represent processes that are significantly up‐regulated by iBRD9 (positive numbers). The x‐axis indicates the enrichment score in either direction. (c) Chart comparing the effects of iBRD9 with JQ1 treated Melb‐a cells and with SMARCA4 depleted 501Mel cells on the expression of selected pigmentation genes. (d) Venn diagram showing overlap between the total number of genes down‐regulated 1.5‐fold or more (p = .05) by iBRD9 and JQ1 in Melb‐a cells. (e) Venn diagram showing overlap between the total number of genes up‐regulated 1.5‐fold or more (p < .05) by iBRD9 and JQ1 in Melb‐a cells. (f) Venn diagrams showing overlap between the total number of genes down‐regulated (left) or up‐regulated (right) 1.5‐fold or more (p < .05) by iBRD9 and JQ1 in Melb‐a cells with eGene expression changes that occur in SMARCA4 depleted 501MEL and HERMES cells (twofold or greater). Hypergeometric analysis indicated significant overlap between iBRD9 and JQ1 down‐regulated genes, iBRD9 and SMARCA4 regulated genes, and JQ1 and SMARCA4 regulated genes (left). For up‐regulated genes, the overlap was significant only between iBRD9 and JQ1 (right).
FIGURE 5
FIGURE 5
Depletion of BRD9 inhibits expression of melanogenic enzyme genes in Melb‐a cells. (a) Melb‐a cells were differentiated for the indicated number of hours and subjected to Western blotting with antibodies to BRD9 or BRD7. Tubulin is a loading control. (b) Melb‐a cells were transfected with a control siRNA (siCtrl) or siBRD9, then cultured in differentiation media for 48 h. Westerns were performed with the indicated antibodies. Tubulin is a loading control. The figure is representative of three or more experiments. (c) Melb‐a cells were transfected as in (b) then subjected to qRT‐PCR. Tyr and Tyrp1 levels were normalized to the level of Rpl7. The data are the average of three independent experiments. Standard error bars are shown (**p < .01, ***p < .001).
FIGURE 6
FIGURE 6
iBRD9 or siBRD9 inhibits melanocyte‐specific gene expression in NHEMs and 501MEL cells. (a) Protein extracts from 501MEL cells (1%–70% confluence and 2%–100% confluence) and NHEM (70% confluence) were subjected to Western blotting with antibodies to BRD9 or BRD7. Tubulin is a loading control. The Western is representative of two or more experiments. (b) NHEMs were cultured for 14 days in the presence of vehicle (Veh) or 10 μM iBRD9. Top: Photographs of pelleted cells. Bottom: Western blots with the indicate antibodies. Tubulin is a loading control. The figures are representative of two experiments. (c) 501MEL cells were cultured in vehicle or 10 μM iBRD9 for the indicated time and subjected to Western blotting with the indicated antibodies. The figure is representative of three or more experiments. (d) 501MEL cells were cultured in vehicle (Veh) or 10 μM iBRD9 for 72 h. qRT‐PCR is shown. mRNA levels were normalized to the level of ACTβ. The data are the average of three independent experiments. Standard error bars are shown (***p < .001). (e) 501MEL cells were transfected with control siRNA (siCtrl) or siBRD9 and cultured for 72 h. Left: Western blot showing BRD9 depletion. Tubulin is a loading control. The figure is representative of three experiments. Right: qRT‐PCR. SOX10 and TYRP1 mRNA levels were normalized to ACTβ. The data are the average of three independent experiments. Standard error bars are shown (**p < .01, ***p < .001).
FIGURE 7
FIGURE 7
iBRD9 disrupts BRD9 and SMARCA4 binding at melanocyte‐specific loci. Chromatin immunoprecipitations (ChIPs) with the indicated antibodies or IgG control were performed on 501MEL cells that had been cultured for 72 h in the presence of vehicle (Veh) or 10 μM iBRD9. ChIP‐qPCR was performed with primers to the indicated genomic regions and normalized to IgG. ChIP enrichment is the fold increase relative to IgG. (a) SMARCA4 (b) BRD9 (c) Histone H3 (d) Histone H3K4me3 (e) Histone H3K27me3. The data are the average of three independent experiments. Standard error bars are shown (*p < .05, **p < .01, ***p < .001).

Similar articles

Cited by

References

    1. Ahmed, N. S. , Gatchalian, J. , Ho, J. , Burns, M. J. , Hah, N. , Wei, Z. , Downes, M. , Evans, R. M. , & Hargreaves, D. C. (2022). BRD9 regulates interferon‐stimulated genes during macrophage activation via cooperation with BET protein BRD4. Proceedings of the National Academy of Sciences of the United States of America, 119(1), e2110812119. 10.1073/pnas.2110812119 - DOI - PMC - PubMed
    1. Alpsoy, A. , Utturkar, S. M. , Carter, B. C. , Dhiman, A. , Torregrosa‐Allen, S. E. , Currie, M. P. , Elzey, B. D. , & Dykhuizen, E. C. (2021). BRD9 is a critical regulator of androgen receptor signaling and prostate cancer progression. Cancer Research, 81(4), 820–833. 10.1158/0008-5472.CAN-20-1417 - DOI - PMC - PubMed
    1. Anders, S. , & Huber, W. (2010). Differential expression analysis for sequence count data. Genome Biology, 11(10), R106. 10.1186/gb-2010-11-10-r106 - DOI - PMC - PubMed
    1. Aras, S. , Saladi, S. V. , Basuroy, T. , Marathe, H. G. , Lores, P. , & de la Serna, I. L. (2019). BAF60A mediates interactions between the microphthalmia‐associated transcription factor and the BRG1‐containing SWI/SNF complex during melanocyte differentiation. Journal of Cellular Physiology, 234(7), 11780–11791. 10.1002/jcp.27840 - DOI - PMC - PubMed
    1. Baxter, L. L. , Watkins‐Chow, D. E. , Pavan, W. J. , & Loftus, S. K. (2019). A curated gene list for expanding the horizons of pigmentation biology. Pigment Cell & Melanoma Research, 32(3), 348–358. 10.1111/pcmr.12743 - DOI - PMC - PubMed

Publication types