. 2022 Dec 5;219(12):e20220685.
doi: 10.1084/jem.20220685. Epub 2022 Sep 16.

Mitochondria transfer mediates stress erythropoiesis by altering the bioenergetic profiles of early erythroblasts through CD47

Affiliations

Mitochondria transfer mediates stress erythropoiesis by altering the bioenergetic profiles of early erythroblasts through CD47

Chong Yang et al. J Exp Med. .

Abstract

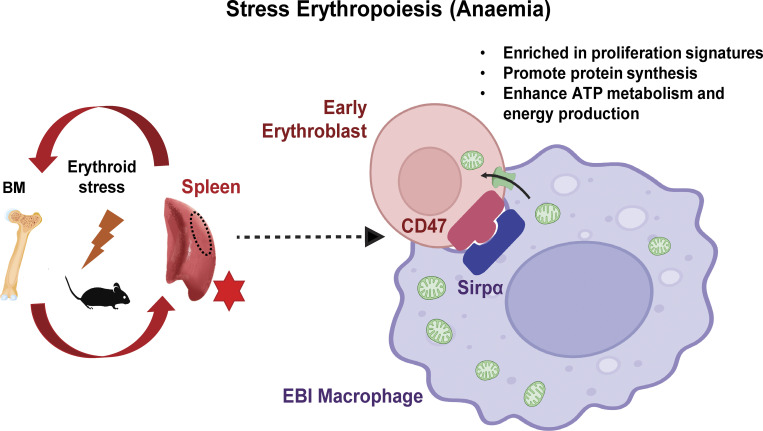
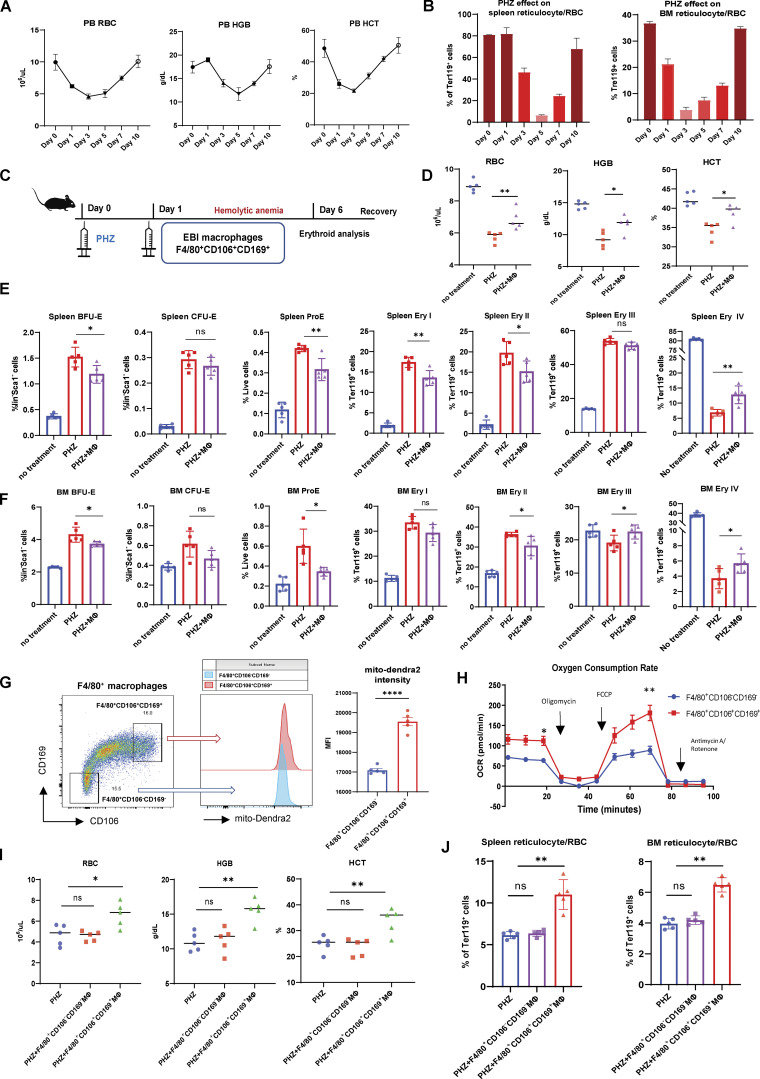
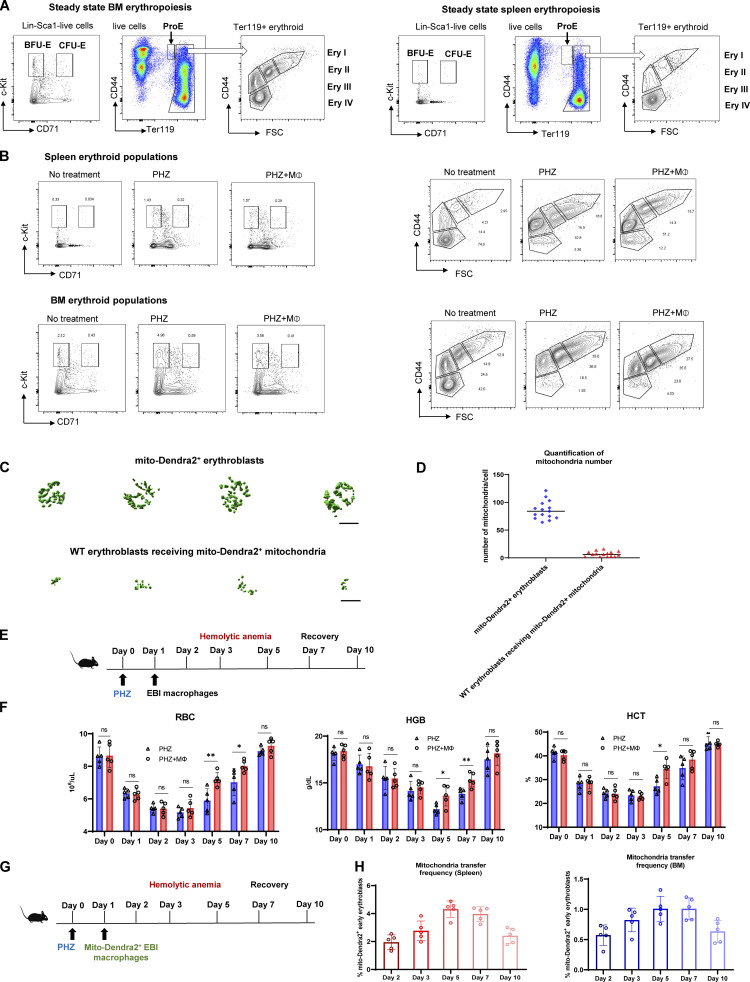
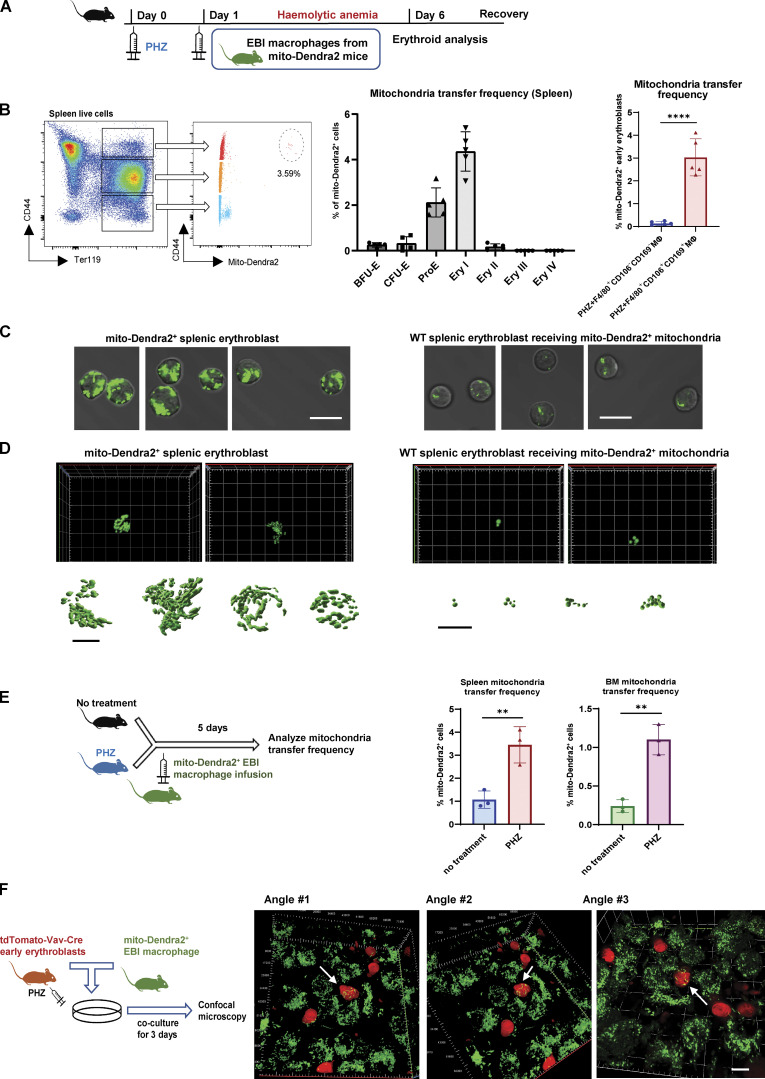
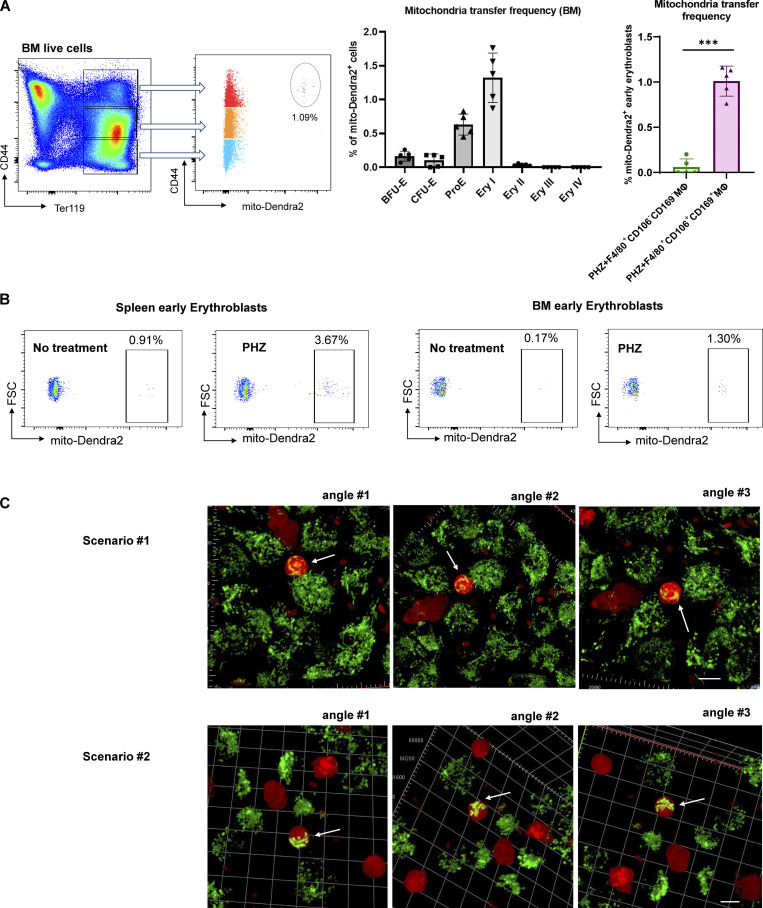
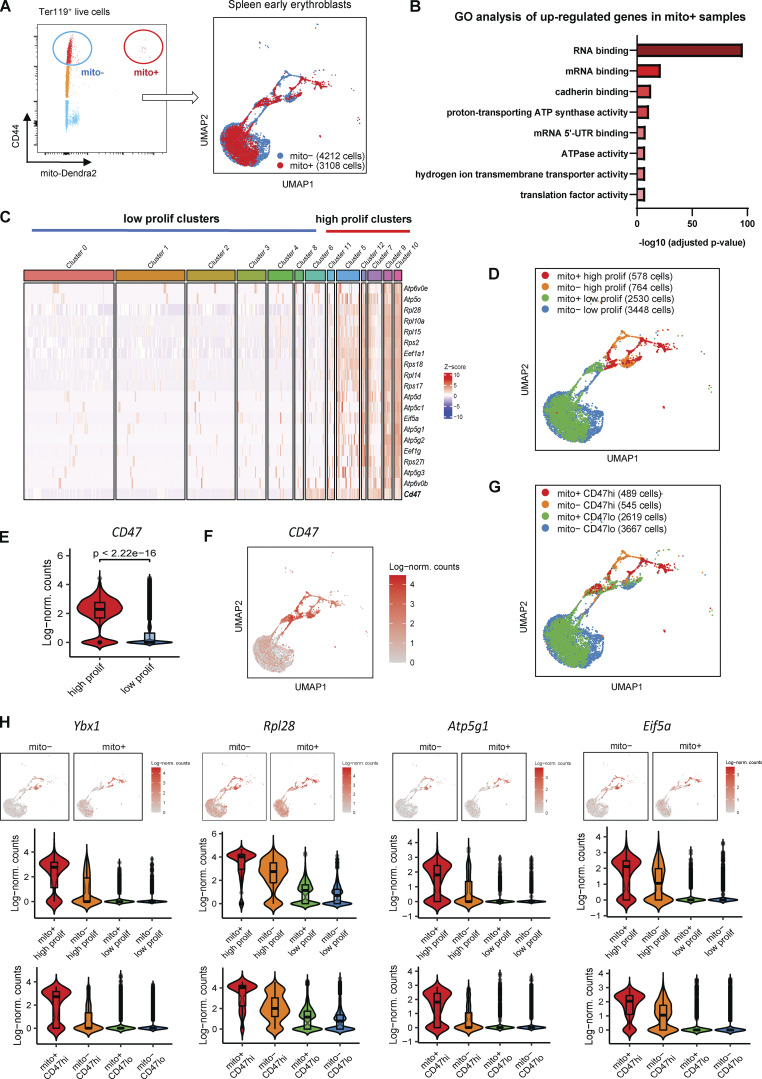
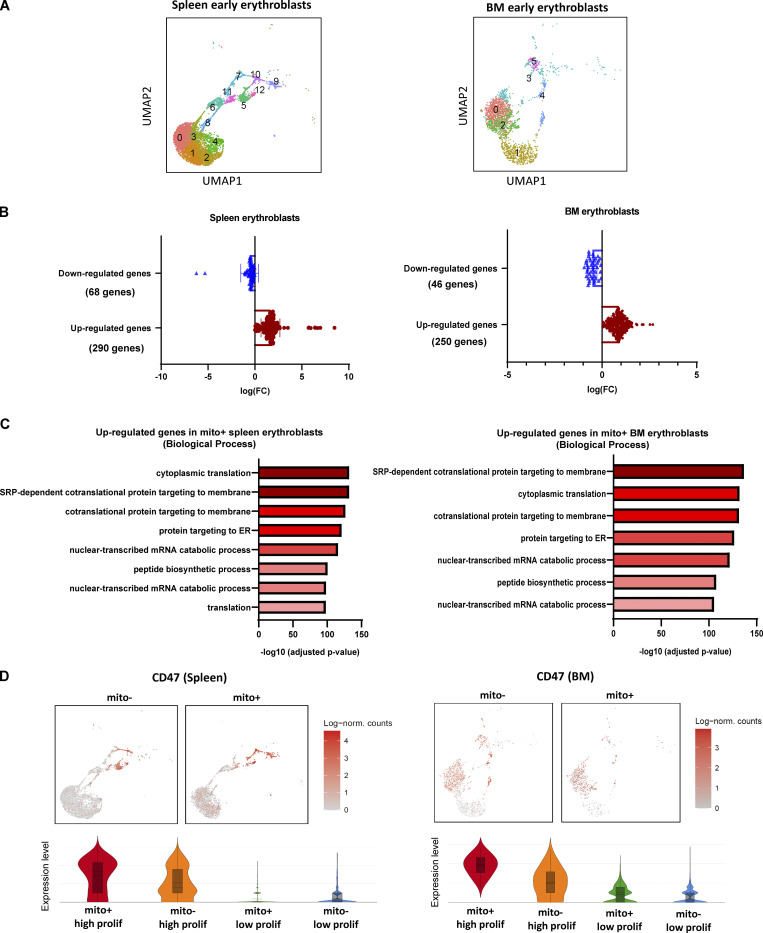
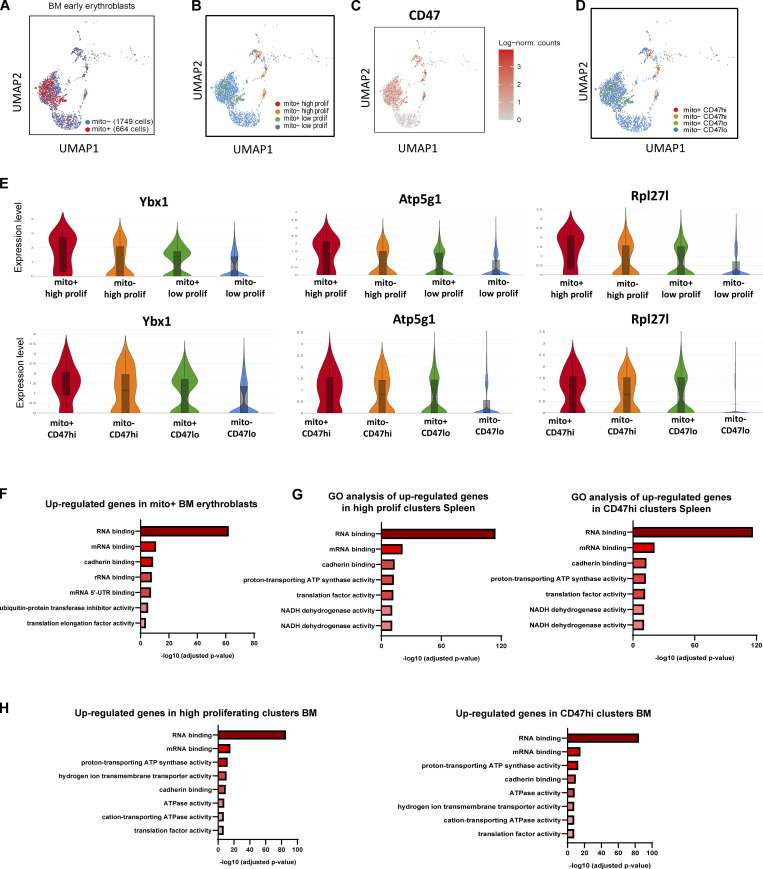
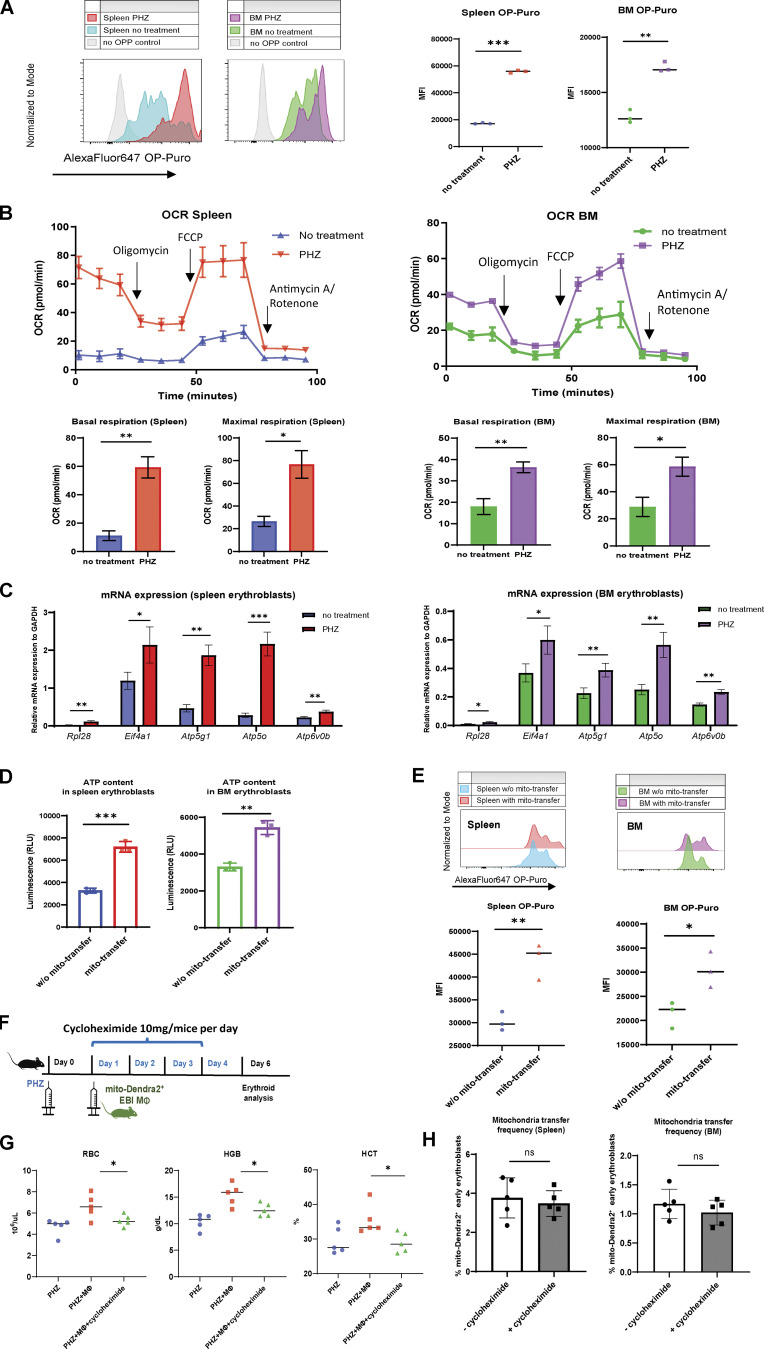
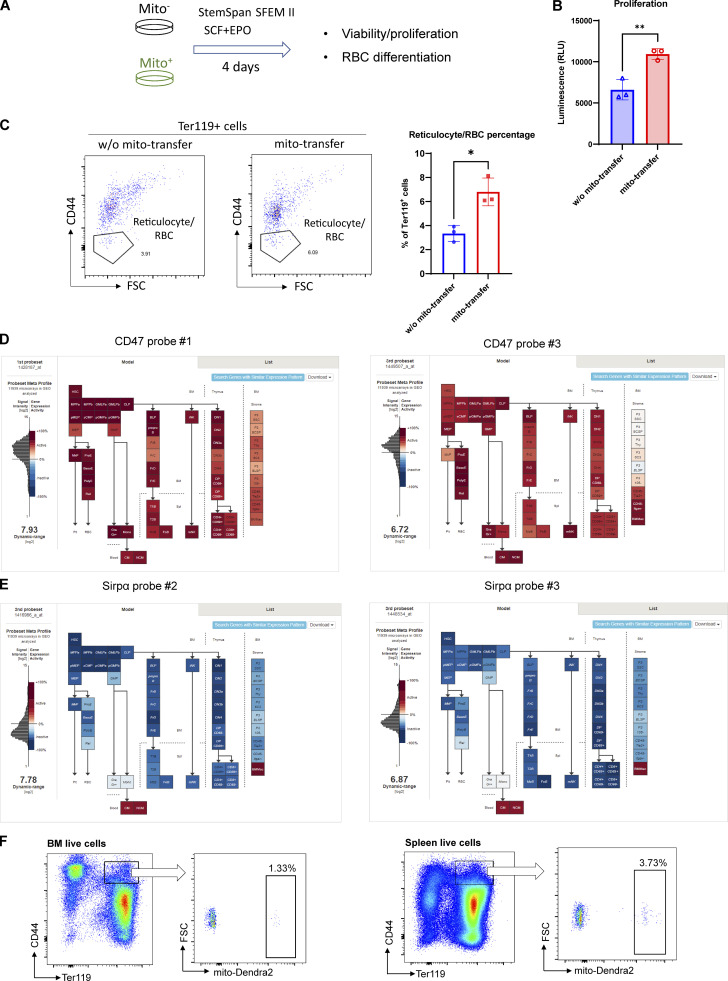
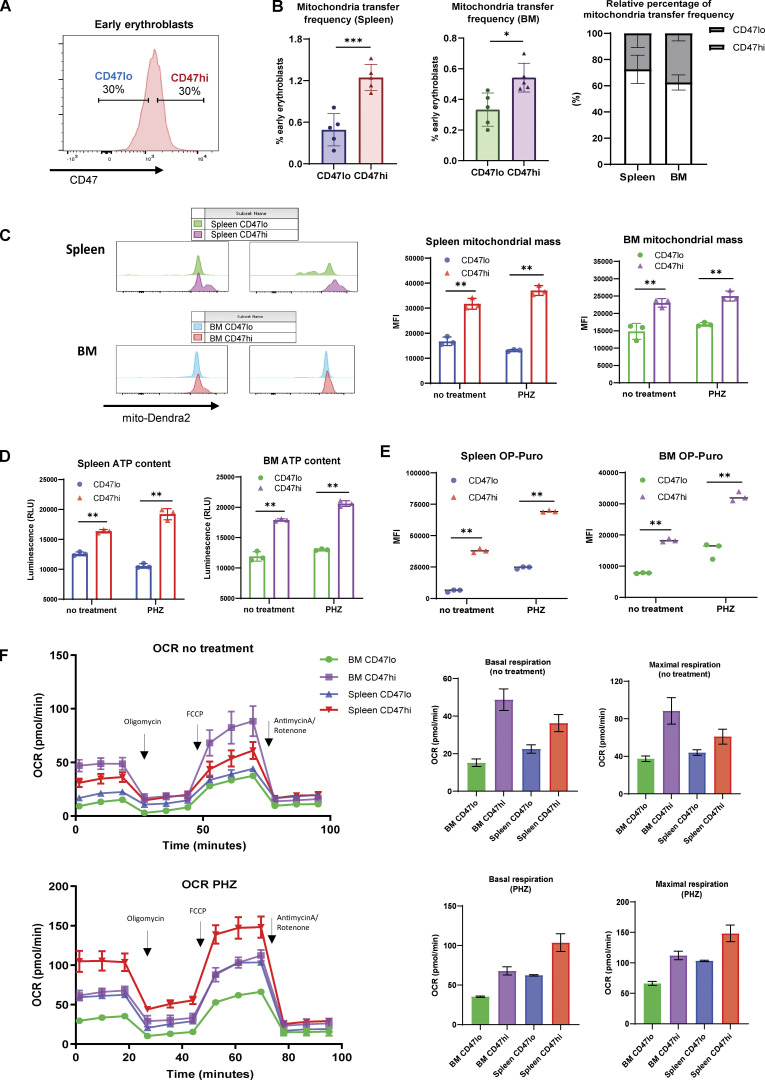
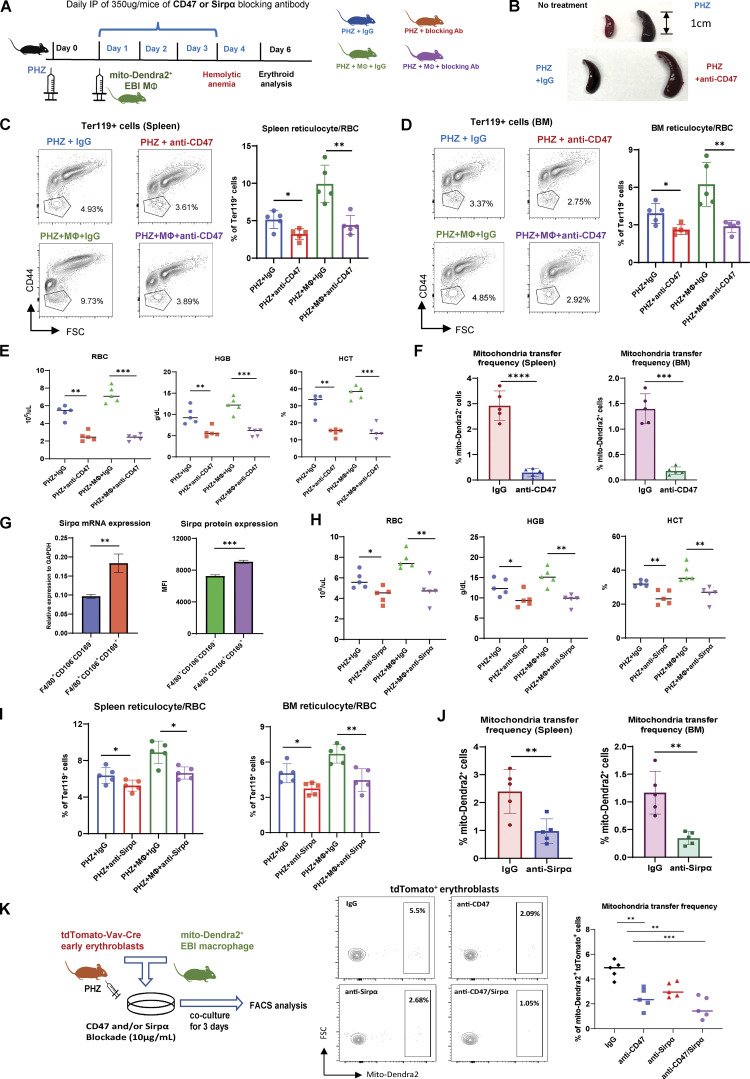
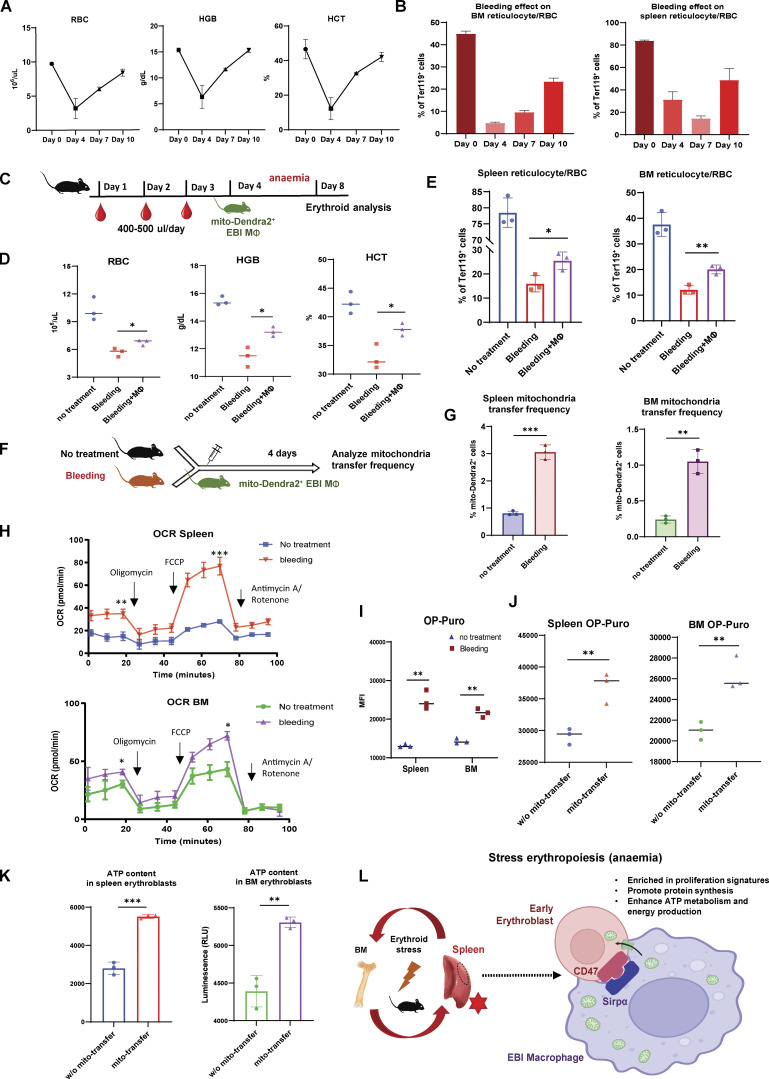
Intercellular mitochondria transfer is a biological phenomenon implicated in diverse biological processes. However, the physiological role of this phenomenon remains understudied between erythroblasts and their erythroblastic island (EBI) macrophage niche. To gain further insights into the mitochondria transfer functions, we infused EBI macrophages in vivo into mice subjected to different modes of anemic stresses. Interestingly, we observed the occurrence of mitochondria transfer events from the infused EBI macrophages to early stages of erythroblasts coupled with enhanced erythroid recovery. Single-cell RNA-sequencing analysis on erythroblasts receiving exogenous mitochondria revealed a subset of highly proliferative and metabolically active erythroid populations marked by high expression of CD47. Furthermore, CD47 or Sirpα blockade leads to a decline in both the occurrence of mitochondria transfer events and their mediated erythroid recovery. Hence, these data indicate a significant role of mitochondria transfer in the enhancement of erythroid recovery from stress through the alteration of the bioenergetic profiles via CD47-Sirpα interaction in the early stages of erythroblasts.


Conflict of interest statement

Disclosures: D.Q. Tan reported personal fees from Miltenyi Biotec outside the submitted work. No other disclosures were reported.

Figures

None
Graphical abstract
Figure 1.
Figure 1.
EBI macrophage infusion facilitates the restoration of erythrocytes from PHZ stress in vivo. (A) Peripheral blood analysis of RBC, HGB, and HCT levels in PHZ-treated mice. (B) FACS analysis of reticulocyte/RBC fraction in spleen and BM of PHZ-treated mice. (C) Schematic illustration of the experiment to analyze the effect of EBI macrophage infusion on erythroid recovery in PHZ-stress model. (D) Peripheral blood analysis of untreated and PHZ-treated mice, with or without EBI macrophage infusion. (E and F) FACS analysis of multiple erythroid populations (BFU-E, CFU-E, ProE, Ery I, II, III, IV) in (E) spleen and (F) BM of untreated and PHZ-treated mice, with or without EBI macrophage infusion. (G) Mitochondrial mass in control (F4/80+CD106CD169) and EBI (F4/80+CD106+CD169+) macrophages quantified by mito-Dendra2 fluorescence intensity. (H) OCR of control and EBI macrophages isolated by FACS. Macrophages were subjected to stimulation with oligomycin, FCCP, and rotenone and antimycin A. Mean ± SEM; n = 3; *, P < 0.05; **, P < 0.05 by Student’s t test. (I and J) Peripheral blood analysis (I) and FACS analysis (J) of reticulocyte/RBC fraction in spleen and BM of PHZ treated mice with and without control and EBI macrophage infusions. For all FACS quantifications, mean ± SEM; n = 5; *, P < 0.05; **, P < 0.01; ***, P ≤ 0.001; ****, P ≤ 0.0001 by Student’s t test.
Figure S1.
Figure S1.
Gating strategy and kinetics for erythroid regeneration and mitochondria transfer. (A) Representative flow cytometric plots showing the gating of BM/splenic erythroid populations based on c-Kit and CD71 expression (BFU-E and CFU-E) and Ter119 and CD44 expression (ProE, Ery I [basophilic], II [polychromatic], III [orthochromatic], IV [reticulocyte/RBC]) under steady state. (B) Representative flow cytometric plots showing the erythroid populations’ responses to PHZ stress, with or without EBI macrophage infusion in spleen and BM. (C and D) Representative isosurface rendering of super-resolution images of Ter119+CD44+ early stages of erythroblasts in native mito-Dendra2 donor mice (upper) and mito-Dendra2–labeled early erythroblasts in recipient wildtype mice (lower) and the numbers of mitochondria were quantified for both categories in D. (E) Schematic illustration of the experiment to analyze the kinetics of erythroid recovery at various time points after EBI macrophage infusion in PHZ stress model. (F) Peripheral blood analysis of the kinetic changes of RBC, HGB, and HCT levels in PHZ-treated mice in the presence and absence of EBI macrophage infusion during different time points of erythroid recovery phases. (G) Schematic illustration of the experiment to analyze the kinetic changes of mitochondria transfer at various time points after EBI macrophage infusion. (H) The kinetic changes of the frequency of mitochondria transfer, as indicated by the percentage of mito-Dendra2+ events, during different time point of erythroid recovery phases. Mean ± SEM; n = 5; *, P < 0.05; **, P < 0.01 by Student’s t test.
Figure 2.
Figure 2.
Mitochondria are transported from EBI macrophages to early erythroblasts upon stress. (A) Schematic illustration of the experiment to examine the mitochondrial dynamics in EBI macrophage-mediated erythroid regeneration following PHZ-induced stress. (B) Frequency of mitochondria transfer, as indicated by the percentage of mito-Dendra2+ events, among various stages of erythroid populations in spleen. Mitochondria transfer frequency is also shown among early erythroblasts in spleen of PHZ-treated mice infused with either control (F4/80+CD106CD169) or EBI (F4/80+CD106+CD169+) macrophages from mito-Dendra2 mice. Representative FACS plots are shown. Mean ± SEM; n = 5; ***, P ≤ 0.001; ****, P ≤ 0.0001 by Student’s t test. (C) Confocal microscopy images showing native early splenic erythroblasts (Ter119+CD44+) from mito-Dendra2 mice (left) and mito-Dendra2+ early splenic erythroblasts from wildtype mice administered EBI macrophages from mito-Dendra2 mice (right). Scale bar, 10 μm. (D) Representative Z-stack and iso-surface rendering of super-resolution images of native early splenic erythroblasts from mito-Dendra2 mice (left) and mito-Dendra2+ early erythroblasts from wildtype mice administered EBI macrophages from mito-Dendra2 mice (right). Scale bar, 5 μm. (E) Frequency of mitochondria transfer as indicated by the percentage of mito-Dendra2+ events among early erythroblast in the spleens (left) and BM (right) of untreated or PHZ-treated mice infused with EBI macrophages from mito-Dendra2 mice. Schematic illustration of the experiment is shown. Mean ± SEM; n = 3; **, P < 0.01 by Student’s t test. (F) Confocal microscopy images showing the presence of mito-Dendra2–labeled mitochondria in recipient erythroblasts (isolated from PHZ stressed tdTomato-Vav-Cre mice) in close contact with donor EBI macrophages (isolated from mito-Dendra2 mice) after coculture for 3 d. A schematic illustration of the experiment is shown. Scale bar, 10 μm.
Figure S2.
Figure S2.
Characterization of mitochondria transfer. (A) Frequency of mitochondria transfer, as indicated by the percentage of mito-Dendra2+ events, among various stages of erythroid populations in BM. Mitochondria transfer frequency is also shown among early erythroblasts in BM of PHZ-treated mice infused with either control (F4/80+CD106CD169) or EBI (F4/80+CD106+CD169+) macrophages from mito-Dendra2 mice. Representative FACS plots are shown. Mean ± SEM; n = 5; ***, P ≤ 0.001; ****, P ≤ 0.0001 by Student’s t test. (B) Representative flow cytometric plots showing the gating of mito-Dendra2+ population that were identified as having received mitochondria in mice under steady state and PHZ-stress respectively. (C) Confocal microscopy images showing the presence of mito-Dendra2–labeled mitochondria in recipient erythroblasts (isolated from PHZ-stressed tdTomato-Vav-Cre mice) in close contact with donor EBI macrophages (isolated from mito-Dendra2 mice) upon coculture for 3 d. Two separate scenarios with three different angles each were shown. Scale bar, 10 μm.
Figure 3.
Figure 3.
Mitochondria transfer confers proliferation signatures to a subpopulation of early erythroblasts expressing CD47. (A) Gating strategy used to isolate mito-Dendra2 (mito−; without exogenous mitochondria transfer) and mito-Dendra2+ (mito+; with exogenous mitochondria transfer) early erythroblasts (left). UMAP visualization (right) of pooled scRNA-seq data is shown and includes 4,212 mito− cells and 3,108 mito+ splenic early erythroblasts. (B) Enrichment analysis (GO molecular function) of genes upregulated in mito+ early splenic early erythroblasts (vs. mito−) via EnrichR. (C) Gene expression profiling based on selected proliferation signatures among the 12 clusters identified from splenic pool of early erythroblasts, and their clustering into high and low proliferating clusters respectively. (D) UMAP visualization based on high and low proliferating clusters in the pooled (mito+ and mito−) splenic early erythroblasts. (E and F) Violin plots showing the differences in CD47 gene expression between high and low proliferating clusters, and (F) UMAP visualization of CD47 expression in splenic early erythroblasts. (G) UMAP visualization based on CD47hi and CD47lo clusters in the pooled (mito+ and mito−) splenic early erythroblasts. (H) Violin plots comparing the differences in selected proliferation signature gene expressions of high and low proliferating clusters vs. CD47hi and CD47lo clusters, in mito+ and mito− splenic erythroblasts respectively.
Figure S3.
Figure S3.
Spleen and BM scRNA-seq analysis. (A) UMAP visualization of original clustering in the pooled (mito+ and mito−) early erythroblasts in spleen and BM. (B) Quantification of the number of up-regulated genes and down-regulated genes in spleen and BM erythroblast after mitochondria transfer. (C) Bar plots showing the enriched up-regulated GO biological processes from spleen (left) and BM (right) mito+ samples (vs. mito− samples) via EnrichR. (D) UMAP visualization and Violin plots comparing the differences in CD47 expressions of high and low proliferating clusters in mito+ and mito− spleen and BM erythroblasts respectively.
Figure S4.
Figure S4.
BM and Spleen scRNA-seq and GO analysis. (A) UMAP visualization of pooled scRNA-seq data is shown including 1,749 mito− cells and 664 mito+ BM early erythroblasts. (B) UMAP visualization of re-clustering of high and low proliferating groups in the pooled (mito+ and mito−) BM early erythroblasts. (C) UMAP visualization of CD47 expression in BM samples. (D) UMAP visualization of re-clustering of CD47hi and CD47lo clusters in the pooled (mito+ and mito−) BM early erythroblasts. (E) Violin plots comparing the differences in selected proliferation signature gene expressions of high and low proliferating clusters vs. CD47hi and CD47lo clusters, in mito+ and mito− BM erythroblasts, respectively. (F) Bar plots showing the enriched up-regulated GO molecular functions from BM mito+ samples (vs. mito− samples). (G) Bar plots showing the enriched up-regulated GO molecular functions from splenic high proliferating clusters (vs. low proliferating clusters, left panel) and CD47hi clusters (vs. CD47lo, right panel) respectively. (H) Bar plots showing the enriched up-regulated GO molecular functions from BM high proliferating clusters (vs. low proliferating clusters, left panel) and CD47hi clusters (vs. CD47lo, right panel) respectively.
Figure 4.
Figure 4.
Protein and ATP synthesis is enhanced upon erythroid stress and potentiated by mitochondria transfer. (A) Protein synthesis rate, as determined by OP-Puro incorporation of splenic and BM early erythroblasts under steady state and PHZ stress. Signal in mice erythroblasts without administration of OP-Puro was included as the negative control. Representative FACS plots are shown. (B) OCR of splenic and BM early erythroblasts under steady state and PHZ stress. Quantifications of basal and maximal respiration are shown. (C) mRNA expression of Rpl28, Eif4a1, Atp5g1, Atp5o, and Atp6v0b in early erythroblasts under steady state and PHZ stress. Error bars indicate the SEM for three independent experiments. (D) ATP content of splenic and BM early erythroblasts in the presence (mito-Dendra2+) and absence (mito-Dendra2) of mitochondria transfer measured by CellTiter-Glo Luminescent Cell Viability Assay. (E) Protein synthesis rate of splenic and BM early erythroblasts in the presence and absence of mitochondria transfer. Representative FACS plots are shown. For all quantification, mean ± SEM; n = 3; *, P < 0.05; **, P < 0.01; ***, P ≤ 0.001 by Student’s t test. (F) Schematic illustration of the experiment to verify the effect of protein synthesis inhibition on mitochondria transfer and erythroid recovery. 10 mg of cycloheximide was administered in parallel with EBI macrophages from mito-Dendra2 mice into PHZ-treated mice. (G) Peripheral blood analysis of PHZ-treated mice administered either cycloheximide and/or EBI macrophages (MΦ). (H) Frequency of mitochondria transfer, as indicated by the percentage of mito-Dendra2+ events, among early erythroblasts in spleen and BM, in the presence or absence of cycloheximide.
Figure S5.
Figure S5.
In vitro validation of mitochondria transfer functions and characterization in bleeding model. (A) Schematic illustration of the experiment to analyze the functions of mitochondria transfer from in vitro culture of splenic early erythroblasts (mito−: w/o mito-transfer; and mito+: mito-transfer). (B) Proliferation of the indicated splenic early erythroblasts populations measured by CellTiter-Glo Luminescent Cell Viability Assay. (C) FACS analysis of reticulocytes/RBC fractions from in vitro culture of mito− and mito+ early erythroblasts respectively. For all quantification, mean ± SEM; *, P < 0.05; **, P < 0.01, by Student’s t test. (D) Cd47 mRNA expression by gene expression microarray on BM-HSPC, mature leukocytes, stromal cells and nucleated erythroid cells. Data are from the Gene Expression Commons dataset (https://gexc.riken.jp/models/1649/genes/Cd47). (E) Sirpα mRNA expression by gene expression microarray on BM-HSPC, mature leukocytes, stromal cells and nucleated erythroid cells. Data were obtained from the Gene Expression Commons dataset that is available online (https://gexc.riken.jp/models/1649/genes/Sirpa). (F) Representative flow cytometric plots showing the gating of mito-Dendra2+ population that were identified as having received mitochondria in BM and splenic early erythroblasts after bleeding.
Figure 5.
Figure 5.
CD47 marks enhanced protein and ATP synthesis and is associated with mitochondria transfer. (A) Representative gating strategy of CD47lo (bottom 30%) and CD47hi (top 30%) fractions within BM and splenic early erythroblasts. (B) Mitochondria transfer frequency in CD47lo and CD47hi splenic and BM early erythroblasts respectively (left), and their relative percentage of occurrence in spleen and BM respectively (right). (C) Mitochondria mass, as determined by mito-Dendra2 fluorescence intensity, of the indicated splenic and BM early erythroblasts populations (CD47lo and CD47hi) under steady state and PHZ stress. (D) ATP content of the indicated splenic and BM early erythroblast populations (CD47lo and CD47hi) under steady state and PHZ stress, measured by CellTiter-Glo Luminescent Cell Viability Assay. (E) Protein synthesis rate, as determined by OP-Puro incorporation, of the indicated splenic and BM early erythroblasts populations (CD47lo and CD47hi) under steady state and PHZ stress. (F) OCR of the indicated splenic and BM early erythroblast populations (CD47lo and CD47hi) under steady state (upper panel) and PHZ stress (lower panel). The quantifications of basal and maximal respiration are shown. For all quantification, mean ± SEM; *, P < 0.05; **, P < 0.01; ***, P ≤ 0.001 by Student’s t test.
Figure 6.
Figure 6.
CD47 or Sirpα blockade abrogates mitochondria transfer–mediated erythroid recovery from acute anemic stress. (A) Schematic illustration of the experiment to validate the function of CD47 in mitochondria transfer–mediated erythroid recovery. CD47 blocking antibody (anti-CD47) or Sirpα blocking antibody (anti-Sirpα) was administered in parallel with EBI macrophages from mito-Dendra2 mice into PHZ-treated mice. (B) Spleen morphology before and after PHZ treatment (upper), with and without CD47 blockade (lower). (C and D) FACS analysis of reticulocytes/RBC fraction in (C) spleen and (D) BM of PHZ-treated mice administered either IgG (control), CD47 Ab (anti-CD47), and/or EBI macrophages (MΦ). (E) Peripheral blood analysis of PHZ-treated mice administered either IgG (control), CD47 Ab (anti-CD47), and/or EBI macrophages (MΦ). (F) Frequency of mitochondria transfer, as indicated by the percentage of mito-Dendra2+ events, among early erythroblasts in spleen and BM; in the presence or absence of CD47 blockade. (G) Expression level of Sirpα mRNA and protein in control (F4/80+CD106CD169) and EBI (F4/80+CD106+CD169+) macrophages. (H and I) Peripheral blood (H) and (I) FACS analysis of reticulocytes/RBC fraction in PHZ-treated mice administered either IgG (control), Sirpα blocking antibody (anti-Sirpα), and/or EBI macrophages (MΦ). (J) Frequency of mitochondria transfer among splenic and BM early erythroblasts in the presence or absence of Sirpα blockade. For all quantification, mean ± SEM; *, P < 0.05; **, P < 0.01; ***, P ≤ 0.001; ****, P ≤ 0.0001 by Student’s t test. (K) Frequency of mitochondria transfer from cocultured mito-Dendra2+ EBI macrophages to erythroblasts isolated from PHZ treated tdTomato-Vav-Cre mice, in the presence or absence of CD47 and/or Sirpα blockade. Schematic illustration of the experimental design is shown. For all quantification, mean ± SEM; **, P < 0.01; ***, P ≤ 0.001 by Student’s t test.
Figure 7.
Figure 7.
Mitochondria transfer from EBI macrophages ameliorates erythroid stress from serial blood withdrawal. (A) Peripheral blood analysis of RBC, HGB, and HCT levels of mice after serial bleeding. (B) FACS analysis of erythroid fraction in spleen and BM of mice after serial bleeding. (C) Schematic illustration of the experiment to analyze the effect of EBI macrophage infusion on erythroid recovery following serial bleeding. (D and E) Peripheral blood analysis (D) and FACS analysis (E) of erythroid fraction in spleen and BM of mice treated with the indicated conditions. (F) Schematic illustration of the experiment to assess mitochondria transfer frequency in response to serial bleeding. (G) Frequency of mitochondria transfer, as indicated by the percentage of mito-Dendra2+ events among early erythroblasts, in the spleens and BM of untreated or serially bled mice infused with EBI macrophages from mito-Dendra2 mice. (H) OCR of splenic and BM early erythroblasts under steady state and serial bleeding stress. (I) Protein synthesis rate, as determined by OP-Puro incorporation, of splenic and BM early erythroblasts under steady state and serial bleeding stress. (J) Protein synthesis rate of splenic and BM early erythroblasts, with or without transferred mitochondria, from serially bled mice. (K) ATP content of splenic and BM early erythroblasts, with or without transferred mitochondria, from serially bled mice. For all quantification, mean ± SEM; *, P < 0.05; **, P < 0.01; ***, P ≤ 0.001 by Student’s t test. (L) Proposed model of EBI macrophage-mediated erythroid recovery involving transfer of mitochondria from EBI macrophages to early erythroblasts, with is associated with an enhanced proliferative profile, particularly in a CD47 marked erythroblast subset. The mitochondria transfer events are possibly regulated by CD47–Sirpα mediated cell–cell interaction. The illustration was created with BioRender.com.

References

    1. Angulo, O., Gandrillon O., and Crauste F.. 2018. Investigating the role of the experimental protocol in phenylhydrazine-induced anemia on mice recovery. J. Theor. Biol. 437:286–298. 10.1016/j.jtbi.2017.10.031 - DOI - PubMed
    1. Chasis, J.A., and Mohandas N.. 2008. Erythroblastic islands: Niches for erythropoiesis. Blood. 112:470–478. 10.1182/blood-2008-03-077883 - DOI - PMC - PubMed
    1. Chen, E.Y., Tan C.M., Kou Y., Duan Q., Wang Z., Meirelles G.V., Clark N.R., and Ma’ayan A.. 2013. Enrichr: Interactive and collaborative HTML5 gene list enrichment analysis tool. BMC Bioinf. 14:128. 10.1186/1471-2105-14-128 - DOI - PMC - PubMed
    1. Chen, K., Liu J., Heck S., Chasis J.A., An X., and Mohandas N.. 2009. Resolving the distinct stages in erythroid differentiation based on dynamic changes in membrane protein expression during erythropoiesis. Proc. Natl. Acad. Sci. USA. 106:17413–17418. 10.1073/pnas.0909296106 - DOI - PMC - PubMed
    1. Engidaye, G., Melku M., and Enawgaw B.. 2019. Diamond blackfan anemia: Genetics, pathogenesis, diagnosis and treatment. EJIFCC. 30:67–81 - PMC - PubMed

Publication types