Sex-specific effects of maternal metformin intervention during glucose-intolerant obese pregnancy on body composition and metabolic health in aged mouse offspring
- PMID: 36112170
- PMCID: PMC9630251
- DOI: 10.1007/s00125-022-05789-0
Sex-specific effects of maternal metformin intervention during glucose-intolerant obese pregnancy on body composition and metabolic health in aged mouse offspring
Abstract
Aims/hypothesis: Metformin is increasingly used to treat gestational diabetes (GDM) and pregnancies complicated by pregestational type 2 diabetes or polycystic ovary syndrome but data regarding long-term offspring outcome are lacking in both human studies and animal models. Using a mouse model, this study investigated the effects of maternal metformin intervention during obese glucose-intolerant pregnancy on adiposity, hepatic steatosis and markers of metabolic health of male and female offspring up to the age of 12 months.
Methods: C57BL/6J female mice were weaned onto either a control diet (Con) or, to induce pre-conception obesity, an obesogenic diet (Ob). The respective diets were maintained throughout pregnancy and lactation. These obese dams were then randomised to the untreated group or to receive 300 mg/kg oral metformin hydrochloride treatment (Ob-Met) daily during pregnancy. In male and female offspring, body weights and body composition were measured from 1 month until 12 months of age, when serum and tissues were collected for investigation of adipocyte cellularity (histology), adipose tissue inflammation (histology and quantitative RT-PCR), and hepatic steatosis and fibrosis (histochemistry and modified Folch assay).
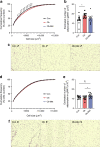
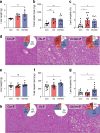
Results: At 12 months of age, male Ob and Ob-Met offspring showed increased adiposity, adipocyte hypertrophy, elevated expression of proinflammatory genes, hyperleptinaemia and hepatic lipid accumulation compared with Con offspring. Male Ob-Met offspring failed to show hyperplasia between 8 weeks and 12 months, indicative of restricted adipose tissue expansion, resulting in increased immune cell infiltration and ectopic lipid deposition. Female Ob offspring were relatively protected from these phenotypes but Ob-Met female offspring showed increased adiposity, adipose tissue inflammation, hepatic lipid accumulation, hyperleptinaemia and hyperinsulinaemia compared with Con female offspring.
Conclusions/interpretation: Maternal metformin treatment of obese dams increased offspring metabolic risk factors in a sex- and age-dependent manner. These observations highlight the importance of following up offspring of both sexes beyond early adulthood after interventions during pregnancy. Our findings illustrate the complexity of balancing short-term benefits to mother and child vs any potential long-term metabolic effects on the offspring when prescribing therapeutic agents that cross the placenta.
Keywords: Developmental programming; Fatty liver; Gestational diabetes; Inflammation; Maternal obesity; Metformin; White adipose tissue.
© 2022. The Author(s).
Figures


Similar articles
-
Maternal Metformin Intervention during Obese Glucose-Intolerant Pregnancy Affects Adiposity in Young Adult Mouse Offspring in a Sex-Specific Manner.Int J Mol Sci. 2021 Jul 28;22(15):8104. doi: 10.3390/ijms22158104. Int J Mol Sci. 2021. PMID: 34360870 Free PMC article.
-
Metformin exposure during pregnancy and lactation affects offspring's long-term body weight and adipose tissue mass independent of the maternal metabolic state.Biochim Biophys Acta Mol Basis Dis. 2024 Aug;1870(6):167258. doi: 10.1016/j.bbadis.2024.167258. Epub 2024 May 22. Biochim Biophys Acta Mol Basis Dis. 2024. PMID: 38788910
-
Prenatal metformin exposure in a maternal high fat diet mouse model alters the transcriptome and modifies the metabolic responses of the offspring.PLoS One. 2014 Dec 26;9(12):e115778. doi: 10.1371/journal.pone.0115778. eCollection 2014. PLoS One. 2014. PMID: 25541979 Free PMC article.
-
Current biochemical studies of nonalcoholic fatty liver disease and nonalcoholic steatohepatitis suggest a new therapeutic approach.Am J Gastroenterol. 2003 Sep;98(9):2093-7. doi: 10.1111/j.1572-0241.2003.07670.x. Am J Gastroenterol. 2003. PMID: 14499793 Review.
-
Long-term effects of metformin on offspring health: A review of current evidence and future directions.Diabetes Obes Metab. 2025 Jun;27 Suppl 3(Suppl 3):48-63. doi: 10.1111/dom.16418. Epub 2025 May 6. Diabetes Obes Metab. 2025. PMID: 40326052 Free PMC article. Review.
Cited by
-
Imeglimin, unlike metformin, does not perturb differentiation of human induced pluripotent stem cells towards pancreatic β-like cells and rather enhances gain in β cell identity gene sets.J Diabetes Investig. 2025 Apr;16(4):584-597. doi: 10.1111/jdi.14410. Epub 2025 Jan 20. J Diabetes Investig. 2025. PMID: 39829307 Free PMC article.
-
Systemic analyses show that the biosynthesis and spatial distribution of fatty acids, triglycerides and lipids differed in male and female mice and humans.Open Biol. 2025 Aug;15(8):250198. doi: 10.1098/rsob.250198. Epub 2025 Aug 20. Open Biol. 2025. PMID: 40829644 Free PMC article.
-
Myocardin reverses insulin resistance and ameliorates cardiomyopathy by increasing IRS-1 expression in a murine model of lipodystrophy caused by adipose deficiency of vacuolar H+-ATPase V0d1 subunit.Theranostics. 2024 Mar 11;14(5):2246-2264. doi: 10.7150/thno.93192. eCollection 2024. Theranostics. 2024. PMID: 38505620 Free PMC article.
-
Metformin treatment of juvenile mice alters aging-related developmental and metabolic phenotypes in sex-dependent and sex-independent manners.Geroscience. 2024 Jun;46(3):3197-3218. doi: 10.1007/s11357-024-01067-6. Epub 2024 Jan 16. Geroscience. 2024. PMID: 38227136 Free PMC article.
-
Maternal Metformin Treatment Reprograms Maternal High-Fat Diet-Induced Hepatic Steatosis in Offspring Associated with Placental Glucose Transporter Modifications.Int J Mol Sci. 2022 Nov 17;23(22):14239. doi: 10.3390/ijms232214239. Int J Mol Sci. 2022. PMID: 36430717 Free PMC article.
References
Publication types
MeSH terms
Substances
Grants and funding
- RG/17/12/33167/BHF_/British Heart Foundation/United Kingdom
- 106026/Z/14/Z/WT_/Wellcome Trust/United Kingdom
- MR/T016701/1/MRC_/Medical Research Council/United Kingdom
- PG/13/46/30329/BHF_/British Heart Foundation/United Kingdom
- FS/16/53/32729/BHF_/British Heart Foundation/United Kingdom
- PG/20/11/34957/BHF_/British Heart Foundation/United Kingdom
- MC_UU_00014/4/MRC_/Medical Research Council/United Kingdom
- MRC_MC_ UU_00014/5/MRC_/Medical Research Council/United Kingdom
- MC_UU_00014/5/MRC_/Medical Research Council/United Kingdom
- MC_UU_12012/4/MRC_/Medical Research Council/United Kingdom
- MC_UU_12012/5/MRC_/Medical Research Council/United Kingdom
LinkOut - more resources
Full Text Sources
Medical
Miscellaneous

