

Collaborative Teaching plus (CT+): A Timely, Flexible, and Dynamic Course Design Implemented during Emergency Remote Teaching in an Introductory Biology Course
- PMID: 36112617
- PMCID: PMC9727617
- DOI: 10.1187/cbe.21-08-0199
Collaborative Teaching plus (CT+): A Timely, Flexible, and Dynamic Course Design Implemented during Emergency Remote Teaching in an Introductory Biology Course
Abstract
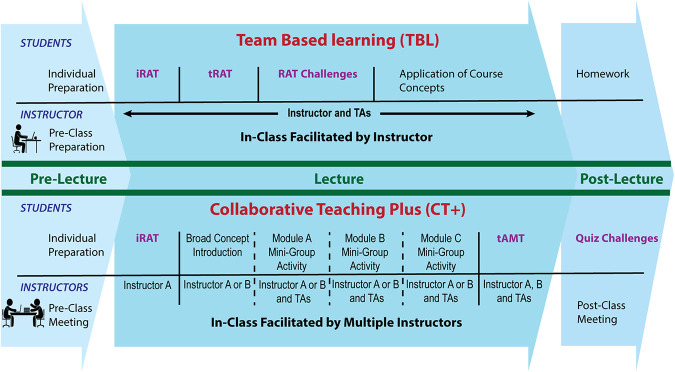
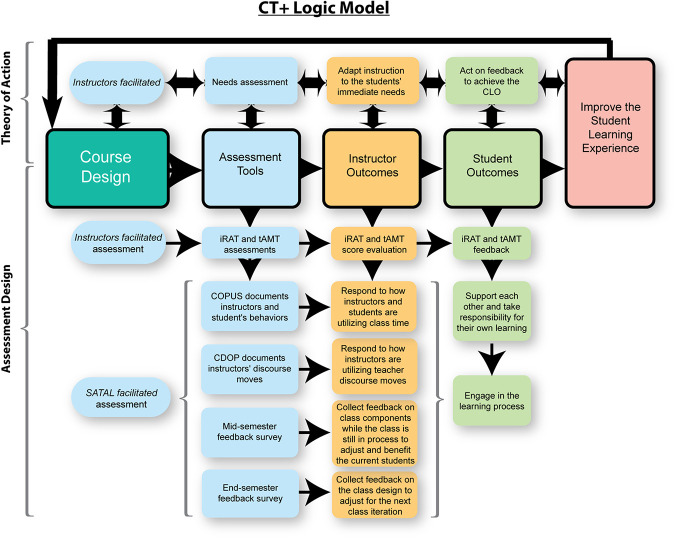
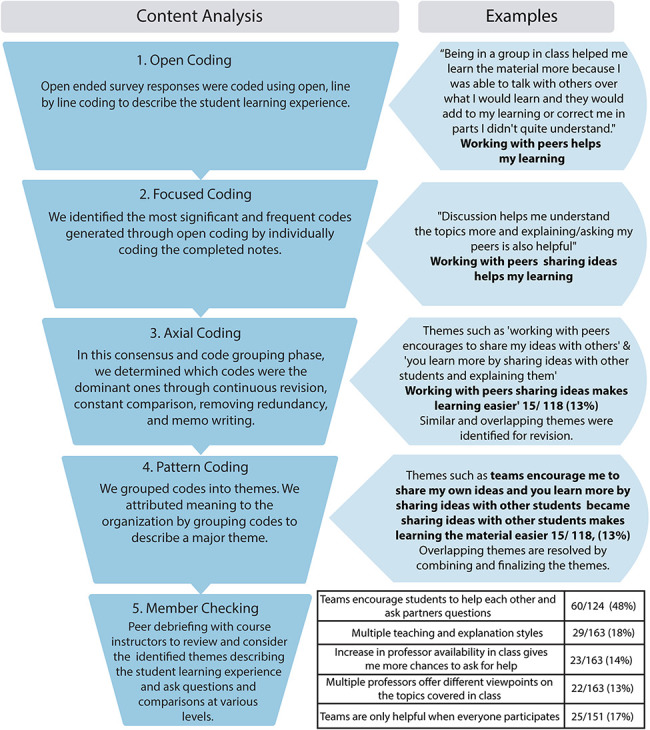
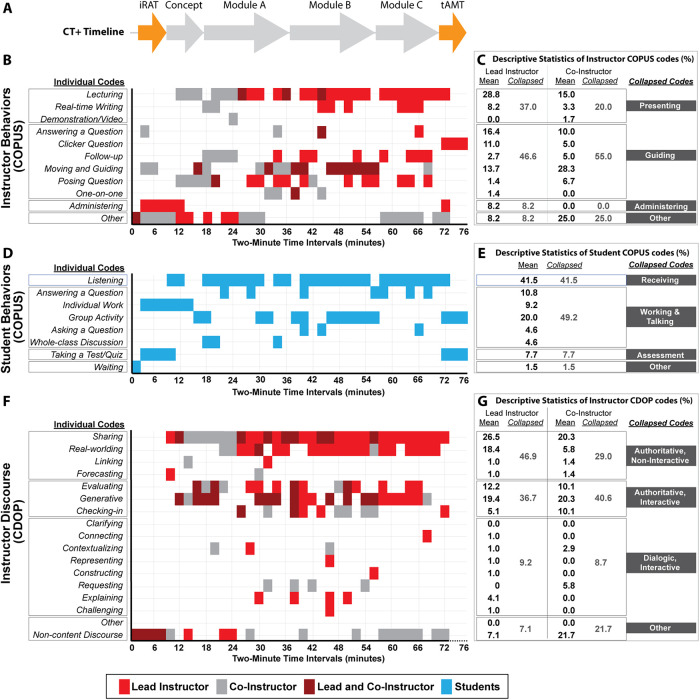
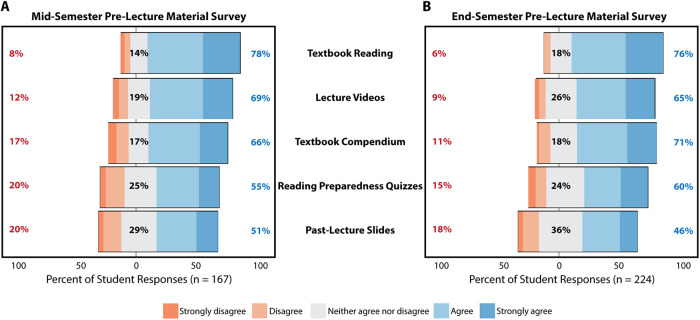
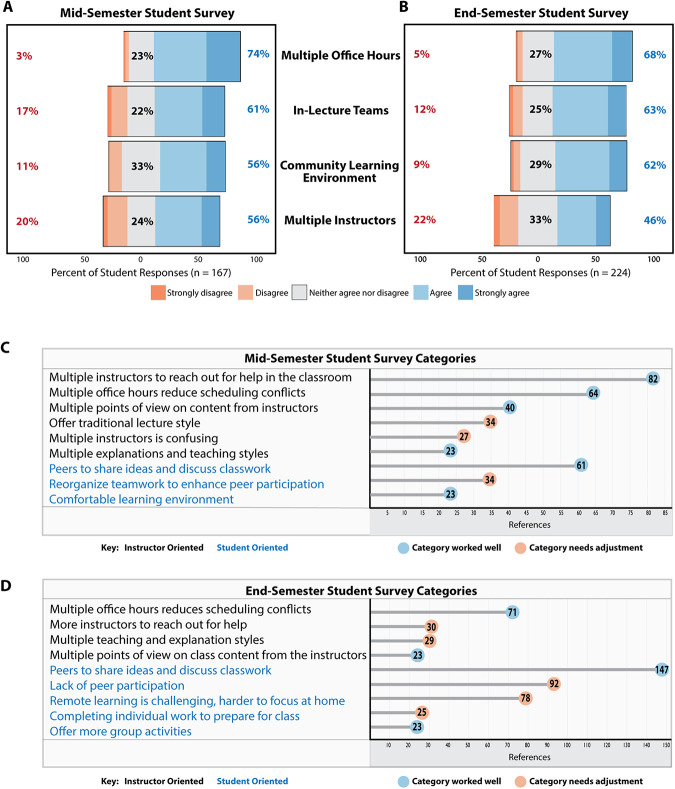
Student-centered pedagogies promote student learning in college science, technology, engineering, and mathematics (STEM) classrooms. However, transitioning to active learning from traditional lecturing may be challenging for both students and instructors. This case study presents the development, implementation, and assessment of a modified collaborative teaching (CT) and team-based learning (TBL) approach (CT plus TBL, or CT+) in an introductory biology course at a Minority-Serving Institution. A logic model was formulated depicting the various assessment practices with the culminating goal of improving the student learning experience. We analyzed qualitative and quantitative data based on students and instructors' behaviors and discourse, and student midsemester and end-of-semester surveys. Our findings revealed that the integration of multiple instructors allowed for knowledge exchange in blending complementary behaviors and discourse practices during class sessions. In addition, the frequent ongoing assessments and incorporation of student feedback informed the CT+ design during both in-person and emergency remote teaching. Furthermore, this course design could be easily adapted to a variety of STEM courses in higher education, including remote instruction.
Figures
Similar articles
-
PORTAAL: A Classroom Observation Tool Assessing Evidence-Based Teaching Practices for Active Learning in Large Science, Technology, Engineering, and Mathematics Classes.CBE Life Sci Educ. 2015 Summer;14(2):14:ar23. doi: 10.1187/cbe.14-06-0095. Epub 2015 Jun 1. CBE Life Sci Educ. 2015. PMID: 26033871 Free PMC article.
-
Evaluation of the effectiveness of student learning and teacher instruction on team-based learning during quality control of diagnostic imaging.Med Educ Online. 2020 Dec;25(1):1732159. doi: 10.1080/10872981.2020.1732159. Med Educ Online. 2020. PMID: 32090711 Free PMC article.
-
Look Who's Talking: Teaching and Discourse Practices across Discipline, Position, Experience, and Class Size in STEM College Classrooms.Bioscience. 2021 Aug 4;71(10):1063-1078. doi: 10.1093/biosci/biab077. eCollection 2021 Oct. Bioscience. 2021. PMID: 34616237 Free PMC article.
-
A review of the application of active learning pedagogies in undergraduate animal science curricula.J Anim Sci. 2023 Jan 3;101:skac352. doi: 10.1093/jas/skac352. J Anim Sci. 2023. PMID: 36692203 Free PMC article. Review.
-
Exploring Two-Year College Biology Instructors' Preferences around Teaching Strategies and Professional Development.CBE Life Sci Educ. 2022 Jun;21(2):ar39. doi: 10.1187/cbe.21-09-0250. CBE Life Sci Educ. 2022. PMID: 35608819 Free PMC article. Review.
References
-
- Akiha, K., Brigham, E., Couch, B. A., Lewin, J., Stains, M., Stetzer, M. R., … & Smith, M. K. (2018). What types of instructional shifts do students experience? Investigating active learning in science, technology, engineering, and math classes across key transition points from middle school to the university level. Frontiers in Education, 2(68, 1–18). doi: 10.3389/feduc.2017.00068
-
- American Association for the Advancement of Science (AAAS). (2011). Vision and change in undergraduate biology education: A call to action . Washington, DC. Retrieved August 12, 2019, from http://visionandchange.org/finalreport/
-
- AAAS. (2012). Describing & measuring undergraduate STEM teaching practices. Washington, DC. Retrieved December 10, 2020, from http://ccliconference.org/files/2013/11/Measuring-STEM-Teaching-Practice...
-
- Association of American Universities. (2017). Progress toward achieving systemic change: Five-year status report on the AAU Undergraduate STEM Education Initiative. Retrieved from Washington, DC. Retrieved December 6, 2019, from www.aau.edu/sites/default/files/AAU-Files/STEM-Education-Initiative/STEM...
