. 2022 Nov 15;82(22):4261-4273.
doi: 10.1158/0008-5472.CAN-21-3214.

Transposon Mutagenesis Reveals RBMS3 Silencing as a Promoter of Malignant Progression of BRAFV600E-Driven Lung Tumorigenesis

Affiliations

Transposon Mutagenesis Reveals RBMS3 Silencing as a Promoter of Malignant Progression of BRAFV600E-Driven Lung Tumorigenesis

Aria Vaishnavi et al. Cancer Res. .

Abstract

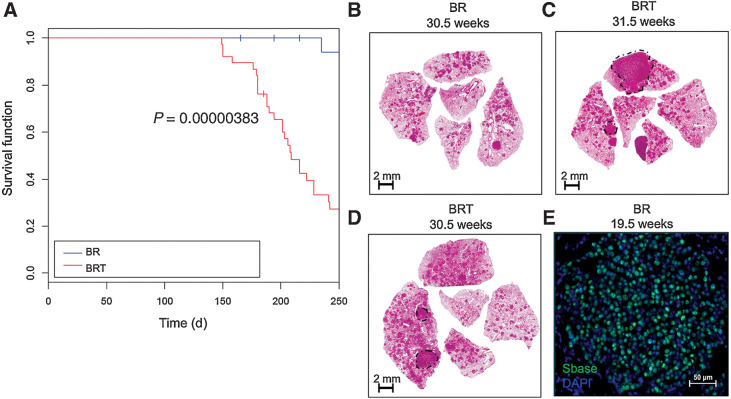
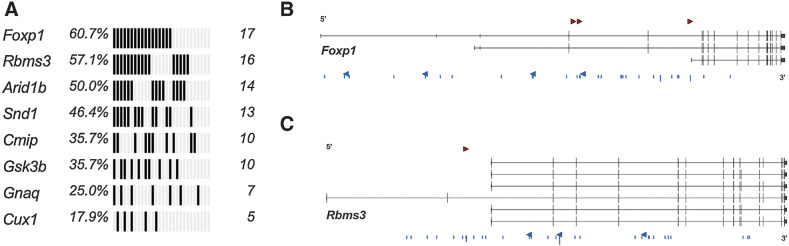
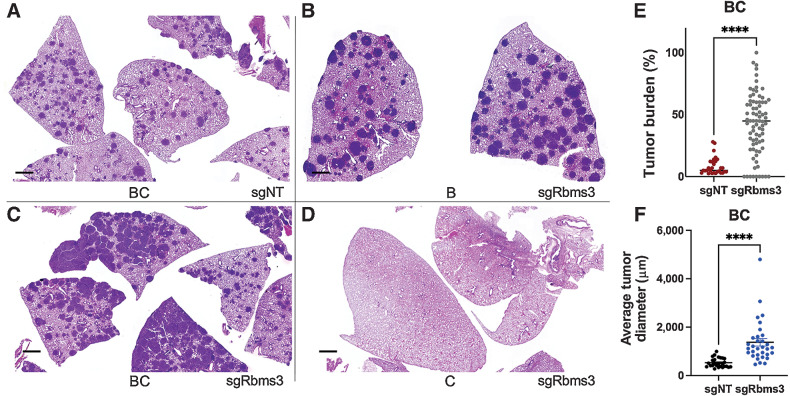
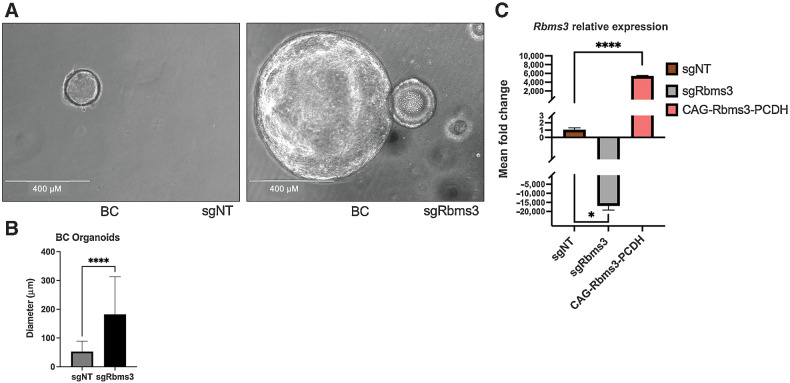
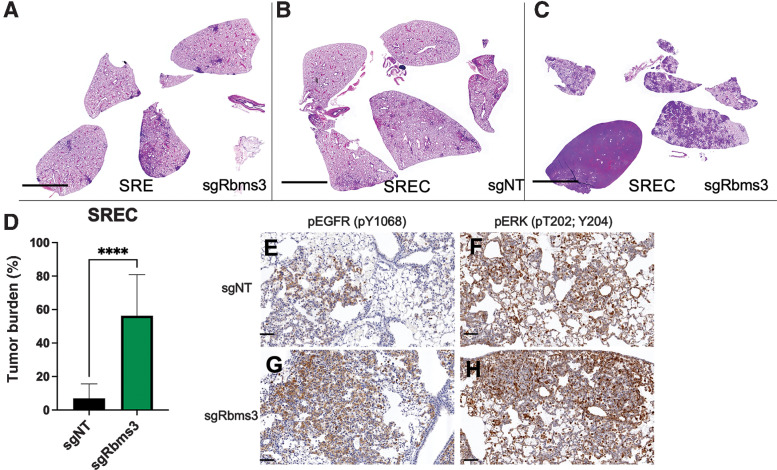
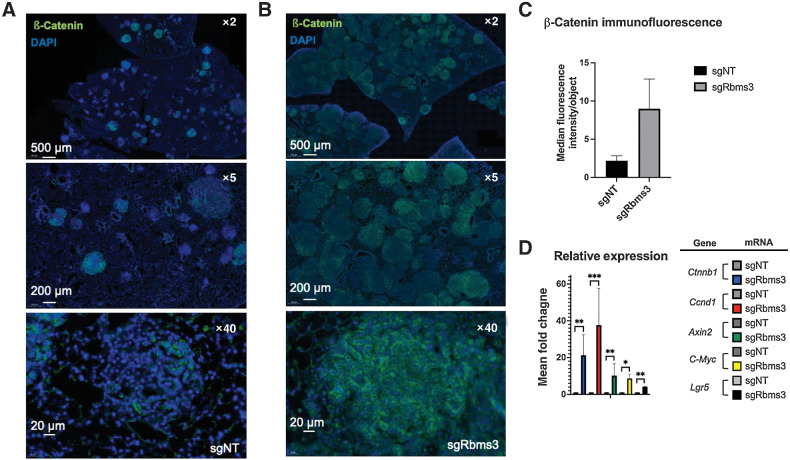
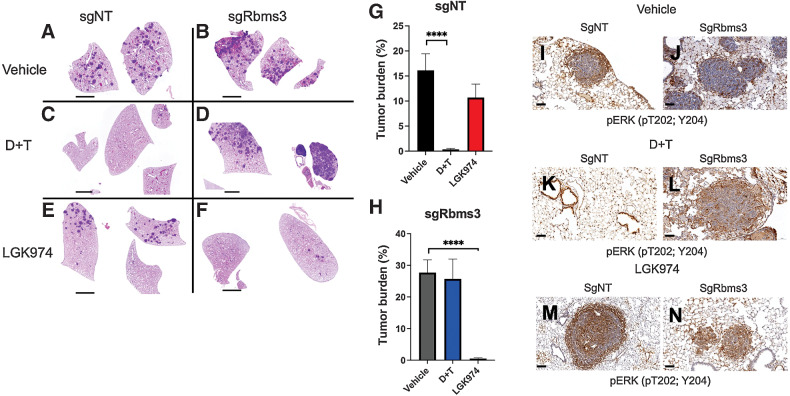
Mutationally activated BRAF is detected in approximately 7% of human lung adenocarcinomas, with BRAFT1799A serving as a predictive biomarker for treatment of patients with FDA-approved inhibitors of BRAFV600E oncoprotein signaling. In genetically engineered mouse (GEM) models, expression of BRAFV600E in the lung epithelium initiates growth of benign lung tumors that, without additional genetic alterations, rarely progress to malignant lung adenocarcinoma. To identify genes that cooperate with BRAFV600E for malignant progression, we used Sleeping Beauty-mediated transposon mutagenesis, which dramatically accelerated the emergence of lethal lung cancers. Among the genes identified was Rbms3, which encodes an RNA-binding protein previously implicated as a putative tumor suppressor. Silencing of RBMS3 via CRISPR/Cas9 gene editing promoted growth of BRAFV600E lung organoids and promoted development of malignant lung cancers with a distinct micropapillary architecture in BRAFV600E and EGFRL858R GEM models. BRAFV600E/RBMS3Null lung tumors displayed elevated expression of Ctnnb1, Ccnd1, Axin2, Lgr5, and c-Myc mRNAs, suggesting that RBMS3 silencing elevates signaling through the WNT/β-catenin signaling axis. Although RBMS3 silencing rendered BRAFV600E-driven lung tumors resistant to the effects of dabrafenib plus trametinib, the tumors were sensitive to inhibition of porcupine, an acyltransferase of WNT ligands necessary for their secretion. Analysis of The Cancer Genome Atlas patient samples revealed that chromosome 3p24, which encompasses RBMS3, is frequently lost in non-small cell lung cancer and correlates with poor prognosis. Collectively, these data reveal the role of RBMS3 as a lung cancer suppressor and suggest that RBMS3 silencing may contribute to malignant NSCLC progression.

Significance: Loss of RBMS3 cooperates with BRAFV600E to induce lung tumorigenesis, providing a deeper understanding of the molecular mechanisms underlying mutant BRAF-driven lung cancer and potential strategies to more effectively target this disease.


Figures

Figure 1. The Sleeping Beauty (SB) transposon system promotes lethal malignant progression of BRAFV600E-driven lung tumors in a GEM model. A, Kaplan–Meier survival curve tracking survival of 50 BrafCA and SB (CAGG/R26LSL-SB11) or (BR) mice, either with or without a T2/Onc2 transposon or (BRT) mice donor on chromosome 4 (C4T2/Onc2) for 250 days. Mice were initiated through intranasal instillation with 106 pfu of Ad5.CMV-CRE. Statistical analysis was performed using a log-rank Mantel–Cox test where P = 0.00000383. B–D, Histological analyses of formalin-fixed paraffin-embedded (FFPE) tumor-bearing lung sections stained with hematoxylin and eosin (H&E). E, Expression of SB transposase in BR mouse lung tumors at 19.5 weeks after initiation assessed by immunofluorescence analysis of FFPE sections of mouse lungs. DAPI-stained DNA is blue and SB11 Transposase is in green.
Figure 1.
The Sleeping Beauty transposon system promotes lethal malignant progression of BRAFV600E-driven lung tumors in a GEM model. A, Kaplan–Meier survival curve tracking survival of 50 BrafCA and SB (CAGG/R26LSL-SB11) or (BR) mice, either with or without a T2/Onc2 transposon or (BRT) mice donor on chromosome 4 (C4T2/Onc2) for 250 days. Mice were initiated through intranasal instillation with 106 pfu of Ad5.CMV-CRE. Statistical analysis was performed using a log-rank Mantel–Cox test, where P = 0.00000383. B–D, Histological analyses of FFPE tumor-bearing lung sections stained with H&E. E, Expression of SB transposase in BR mouse lung tumors at 19.5 weeks after initiation assessed by immunofluorescence analysis of FFPE sections of mouse lungs. Blue, DAPI-stained DNA; green, SB11 transposase.
Figure 2. Genomic landscape of SB|Braf lung drivers. A, Oncoprint of statistically significant drivers in BRAFV600E-driven lung tumors detected using GKC analysis, using SB common integration regions (CIR), and Truncal SB Driver Analysis, using unique, directional SB insertions at TA-dinucleotides. B, SB insertions at TA-dinucleotides with sense (red arrowhead) and anti-sense (blue arrowheads) and within CIRs (blue lines) for Foxp1 (3 transcripts of the genes are shown). C, SB insertions at TA-dinucleotides with sense (red arrowhead) and anti-sense (blue arrowheads) and within CIRs (blue lines) for Rbms3 (6 transcripts of the candidate gene are shown).
Figure 2.
Genomic landscape of SB/Braf lung drivers. A, Oncoprint of statistically significant drivers in BRAFV600E-driven lung tumors detected using GKC analysis, using SB common integration regions (CIR), and Truncal SB Driver Analysis, using unique, directional SB insertions at TA-dinucleotides. B, SB insertions at TA-dinucleotides with sense (red arrowhead) and antisense (blue arrowheads) and within CIRs (blue lines) for Foxp1 (three transcripts of the genes are shown). C, SB insertions at TA-dinucleotides with sense (red arrowhead) and antisense (blue arrowheads) and within CIRs (blue lines) for Rbms3 (6 transcripts of the candidate gene are shown).
Figure 3. CRISPR/Cas9 editing of Rbms3 cooperates with BRAFV600E in a mouse model of lung cancer. A–D, Representative images of different genotypes of harvested mouse lung sections following necropsy analyses stained with hematoxylin and eosin (H&E) 13 weeks after initiation with 5×10⁴ pfu lenti-CRE. CRISPR/CAS9-mediated genome editing was used in panels A, C, and D, to edit Rbms3 in vivo. Genotype and average tumor burden calculation of each experimental group was: A, sgNT-CRE virus in BrafCAT/+; H11LSL-CAS9 (BC) mice: 8.5%. B, sgRbms3-CRE virus in BrafCAT/+ (B) mice: 7.7%. C, sgRbms3-CRE virus in BC mice: 38.8%. D, sgRbms3-CRE virus in H11LSL-CAS9/+ (C) mice: 0%. Black bar in bottom left of each panel represents a 1,000-μm scale bar. E, Quantification of individual tumor burden from genotypes in A compared with C. Tumor bearing lungs from B were identical to A. A, paired t test was used to determine statistical significance; P < 0.01. F, Quantification of tumor diameter was performed in μm using 25 individual tumors from genotypes in A compared with C using the 3D Histech MIDI Slide Scanner QuantCenter. Comprehensive analyses was conducted with over 200 lung tumors. N = 50 mice individual or (biological replicates). N = 2 experimental replicates were performed comparing the indicated genotypes in A and C. Individual values are graphed, the black bar represents the mean, and the error bars represent SEM. A paired t test was used to determine statistical significance; P < 0.0001.
Figure 3.
CRISPR/Cas9 editing of Rbms3 cooperates with BRAFV600E in a mouse model of lung cancer. AD, Representative images of different genotypes of harvested mouse lung sections following necropsy analyses stained with H&E 13 weeks after initiation with 5 × 10⁴ pfu lenti-CRE. CRISPR/CAS9-mediated genome editing was used in panels A, C, and D to edit Rbms3 in vivo. Genotype and average tumor burden calculation of each experimental group was: A, sgNT-CRE virus in BrafCAT/+; H11LSL-CAS9 (BC) mice: 8.5%. B, sgRbms3-CRE virus in BrafCAT/+ (B) mice: 7.7%. C, sgRbms3-CRE virus in BC mice: 38.8%. D, sgRbms3-CRE virus in H11LSL-CAS9/+ (C) mice: 0%. Scale bar, 1,000 μm. E, Quantification of individual tumor burden from genotypes in A compared with C. Tumor-bearing lungs from B were identical to A. A paired t test was used to determine statistical significance; P < 0.01. F, Quantification of tumor diameter was performed in μm using 25 individual tumors from genotypes in A compared with C using the 3D Histech MIDI Slide Scanner QuantCenter. Comprehensive analyses was conducted with over 200 lung tumors. N = 50 mice individual or (biological replicates). N = 2 experimental replicates were performed comparing the indicated genotypes in A and C. Individual values are graphed, the black bar represents the mean. Error bars, SEM. A paired t test was used to determine statistical significance; ****, P < 0.0001.
Figure 4. Rbms3 silencing cooperates with BRAFV600E to promote the growth of lung organoids. A, Representative images are shown of qualitative analyses of phase contrast images of organoids established following tumor dissociation from BC mice at 7 days after initiation of organoids. White scale bar indicates 400 μm, and was taken with ×10 magnification. N = 12 technical replicates with 3 biological replicates leveraging pooled lung lobes from N = 8 mice. B, Quantification of organoid diameters at 7 days after initiation of organoids from lungs of the indicated mouse genotypes described in (A). C, qRT-PCR analysis of Rbms3 mRNA expression in organoids derived from BC mice labeled by the lentivirus they were initiated with. Transient overexpression of wild-type Rbms3 was used as a positive control for gene expression. Mean is graphed and error bars represent SEM. Statistical analysis was conducted using a paired t test; *, P < 0.05; ****, P < 0.0001.
Figure 4.
Rbms3 silencing cooperates with BRAFV600E to promote the growth of lung organoids. A, Representative images are shown of qualitative analyses of phase contrast images of organoids established following tumor dissociation from BC mice at 7 days after initiation of organoids. White scale bar indicates 400 μm, and was taken with ×10 magnification. N = 12 technical replicates with 3 biological replicates leveraging pooled lung lobes from N = 8 mice. B, Quantification of organoid diameters at 7 days after initiation of organoids from lungs of the indicated mouse genotypes described in A. C, qRT-PCR analysis of Rbms3 mRNA expression in organoids derived from BC mice labeled by the lentivirus they were initiated with. Transient overexpression of wild-type Rbms3 was used as a positive control for gene expression. Mean is graphed. Error bars, SEM. Statistical analysis was conducted using a paired t test; *, P < 0.05; ****, P < 0.0001.
Figure 5. Rbms3 loss cooperates with EGFRL858R to accelerate malignant lung adenocarcinoma. A–C, Images of harvested mouse lung sections following necropsy analyses stained with hematoxylin and eosin (H&E) 11 weeks after initiation with 1×10⁵ pfu lenti-CRE, followed by continuous administration of doxycycline chow to induce EGFRL858R expression. CRISPR/CAS9-mediated genome editing was used in B and C to edit Rbms3 in vivo. Genotype of each experimental group was: A, sgRbms3-CRE virus in SPC::CRE-ERT2/+; Rosa26CAGs-LSL-rTTa3; EGFRL858R (SRE) mice. B, sgNT-CRE virus in or SPC::CRE-ERT2/+; Rosa26CAGs-LSL-rTTa3; EGFRL858R; H11LSL-CAS9/+ (SREC) mice. C, sgRbms3-CRE virus in SREC mice. Black bar in bottom left of each panel represents a 1,000 μm, scale bar. D, Quantification of tumor burden from genotypes in B compared with C. N = 5 mice per group. The mean is graphed, and error bars represent SEM. Statistical analysis was conducted using a paired t test; ****, P < 0.0001. E, Representative images of IHC on FFPE lung tissue sections from SREC mice initiated with either sgNT- or sgRbms3-CRE and stained with pEGFR (pY1068) or pERK (pT202; Y204) shown at ×20 magnification. Scale bar shown in black at the bottom left corner of each image represents 50 μm.
Figure 5.
Rbms3 loss cooperates with EGFRL858R to accelerate malignant lung adenocarcinoma. AC, Images of harvested mouse lung sections following necropsy analyses stained with H&E 11 weeks after initiation with 1×10⁵ pfu lenti-CRE, followed by continuous administration of doxycycline chow to induce EGFRL858R expression. CRISPR/CAS9-mediated genome editing was used in B and C to edit Rbms3 in vivo. Genotype of each experimental group was: A, sgRbms3-CRE virus in SPC::CRE-ERT2/+; Rosa26CAGs-LSL-rTTa3; EGFRL858R (SRE) mice. B, sgNT-CRE virus in or SPC::CRE-ERT2/+; Rosa26CAGs-LSL-rTTa3; EGFRL858R; H11LSL-CAS9/+ (SREC) mice. C, sgRbms3-CRE virus in SREC mice. Scale bar, 1,000 μm. D, Quantification of tumor burden from genotypes in B compared with C. N = 5 mice per group. The mean is graphed. Error bars, SEM. Statistical analysis was conducted using a paired t test; ****, P < 0.0001. E–H, Representative images of IHC on FFPE lung tissue sections from SREC mice initiated with either sgNT- or sgRbms3-CRE and stained with pEGFR (pY1068) or pERK (pT202; Y204) shown at ×20 magnification. Scale bar, 50 μm.
Figure 6. WNT signaling components are expressed at higher levels in BC lung tumors without Rbms3. A and B, Representative images of β-catenin expression as assessed by indirect immunofluorescent in tumor bearing FFPE BC mouse lung sections (shown at ×2, ×5, and ×40 magnifications) initiated with either A, sgNT-CRE or B, sgRbms3-CRE. Scale bars are shown in white in the bottom left corner of each image as indicated. C, Median fluorescence intensity quantitation using cellprofiler software. D, qRT-PCR analysis of BC organoids from the indicated viral initiation groups using probes to detect Ctnnb1, Ccnd1, Axin2, Lgr5, or c-Myc mRNAs. Mean is graphed with error bars as SEM. Statistical analysis was conducted using a paired t test; *, P < 0.05; **, P < 0.01; ***, P <0.001; ****, P < 0.0001.
Figure 6.
WNT signaling components are expressed at higher levels in BC lung tumors without Rbms3. A and B, Representative images of β-catenin expression as assessed by indirect immunofluorescent in tumor-bearing FFPE BC mouse lung sections (shown at ×2, ×5, and ×40 magnifications) initiated with either sgNT-CRE (A) or sgRbms3-CRE (B). Scale bars are shown in white in the bottom left corner of each image as indicated. C, Median fluorescence intensity quantitation using CellProfiler software. D, qRT-PCR analysis of BC organoids from the indicated viral initiation groups using probes to detect Ctnnb1, Ccnd1, Axin2, Lgr5, or c-Myc mRNAs. Mean is graphed. Error bars, SEM. Statistical analysis was conducted using a paired t test; *, P < 0.05; **, P < 0.01; ***, P <0.001.
Figure 7. Rbms3-silencing drives resistance to pathway-targeted inhibition of BRAFV600E while adapting sensitivity to inhibition of Porcupine. A, Representative images of H&E-stained lung sections harvested 11 weeks after initiation from BC mice following treatment with the indicated pharmacological agents starting at 6 weeks after initiation with 5×10⁴ pfu lenti-CRE. BC mice were dosed once daily for 5 weeks with: (i) Vehicle control; (ii) dabrafenib (75 mg/kg) plus trametinib (1 mg/kg) or; (iii) LGK974 (5 mg/kg). B and C, Quantification of lung tumor burden in BC mice initiated with sgNT-CRE or sgRbms3-CRE and dosed with the indicated pharmacological agents as indicated. Mean tumor burden is graphed, and error bars represent SEM. N = 5–7 mice per dosing arm. Statistical analysis was performed using a one-way ANOVA (****, P < 0.0001).
Figure 7.
Rbms3-silencing drives resistance to pathway-targeted inhibition of BRAFV600E while adapting sensitivity to inhibition of Porcupine. A–F, Representative images of H&E-stained lung sections harvested 11 weeks after initiation from BC mice following treatment with the indicated pharmacological agents starting at 6 weeks after initiation with 5 × 10⁴ pfu lenti-CRE. BC mice were dosed once daily for 5 weeks with: (i) vehicle control; (ii) dabrafenib (75 mg/kg) plus trametinib (1 mg/kg); or (iii) LGK974 (5 mg/kg). G and H, Quantification of lung tumor burden in BC mice initiated with sgNT-CRE or sgRbms3-CRE and dosed with the indicated pharmacological agents as indicated. Mean tumor burden is graphed. I–N, Immunohistochemical analysis of pERK1/2 in BC mice following treatment with the indicated pharmacological agents. Error bars, SEM. N = 5–7 mice per dosing arm. Statistical analysis was performed using a one-way ANOVA; ****, P < 0.0001.

References

    1. Siegel RL, Miller KD, Jemal A. Cancer statistics, 2016. CA Cancer J Clin 2016;66:7–30. - PubMed
    1. Drilon A, Laetsch TW, Kummar S, DuBois SG, Lassen UN, Demetri GD, et al. . Efficacy of larotrectinib in TRK fusion-positive cancers in adults and children. N Engl J Med 2018;378:731–9. - PMC - PubMed
    1. Soria JC, Ohe Y, Vansteenkiste J, Reungwetwattana T, Chewaskulyong B, Lee KH, et al. . Osimertinib in untreated EGFR-mutated advanced non–small cell lung cancer. N Engl J Med 2018;378:113–25. - PubMed
    1. Peters S, Camidge DR, Shaw AT, Gadgeel S, Ahn JS, Kim DW, et al. . Alectinib versus crizotinib in untreated ALK-positive non–small cell lung cancer. N Engl J Med 2017;377:829–38. - PubMed
    1. Vultur A, Herlyn M. SnapShot: melanoma. Cancer Cell 2013;23:706. - PubMed

Publication types