. 2022 Nov 2;31(11):2020-2029.
doi: 10.1158/1055-9965.EPI-22-0689.

Development of a Molecular Blood-Based Immune Signature Classifier as Biomarker for Risks Assessment in Lung Cancer Screening

Affiliations

Development of a Molecular Blood-Based Immune Signature Classifier as Biomarker for Risks Assessment in Lung Cancer Screening

Orazio Fortunato et al. Cancer Epidemiol Biomarkers Prev. .

Abstract

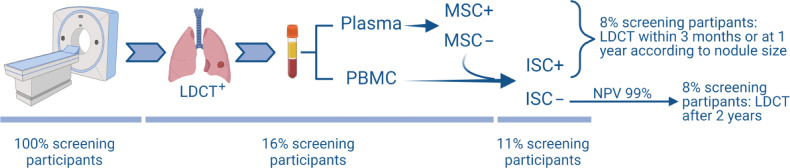
Background: Low-dose CT (LDCT) screening trials have shown that lung cancer early detection saves lives. However, a better stratification of the screening population is still needed. In this respect, we generated and prospectively validated a plasma miRNA signature classifier (MSC) able to categorize screening participants according to lung cancer risk. Here, we aimed to deeply characterize the peripheral immune profile and develop a diagnostic immune signature classifier to further implement blood testing in lung cancer screening.

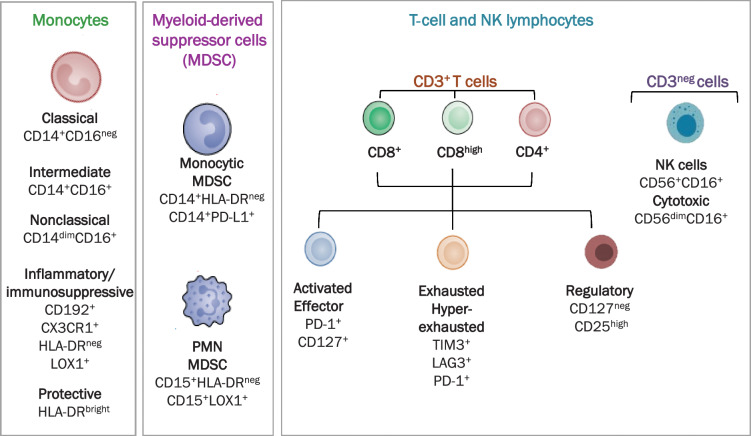
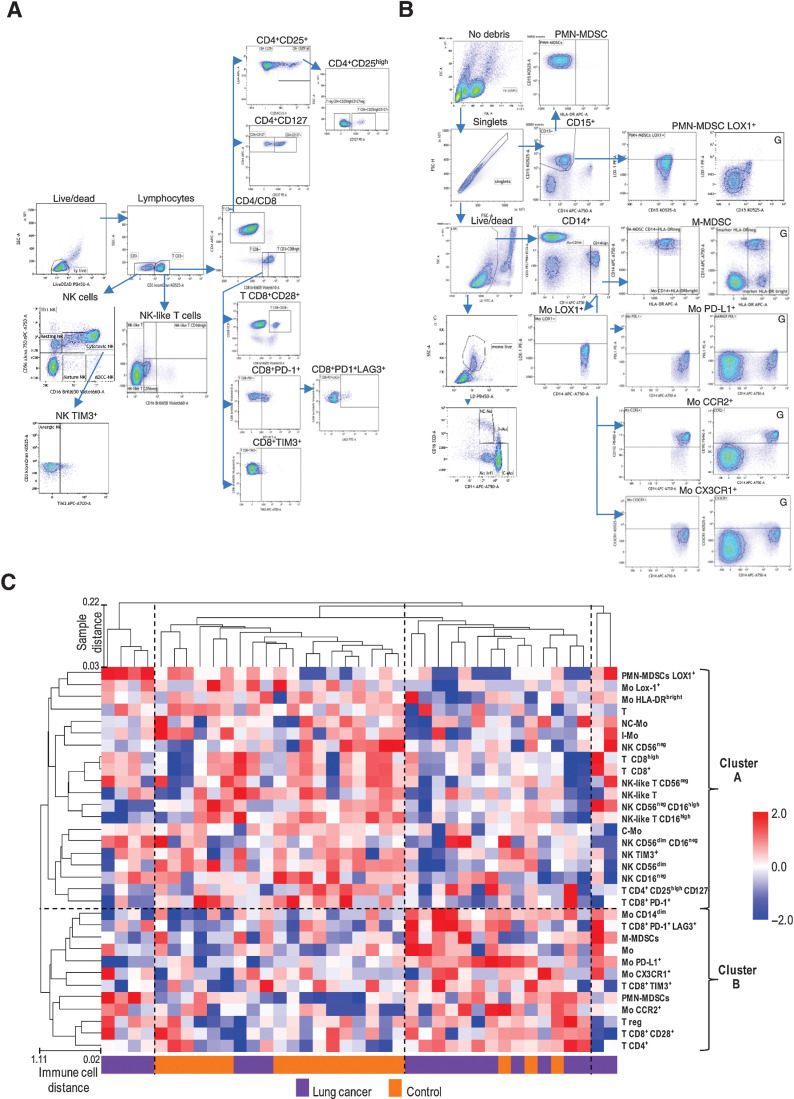
Methods: Peripheral blood mononuclear cell (PBMC) samples collected from 20 patients with LDCT-detected lung cancer and 20 matched cancer-free screening volunteers were analyzed by flow cytometry using multiplex panels characterizing both lymphoid and myeloid immune subsets. Data were validated in PBMC from 40 patients with lung cancer and 40 matched controls and in a lung cancer specificity set including 27 subjects with suspicious lung nodules. A qPCR-based gene expression signature was generated resembling selected immune subsets.

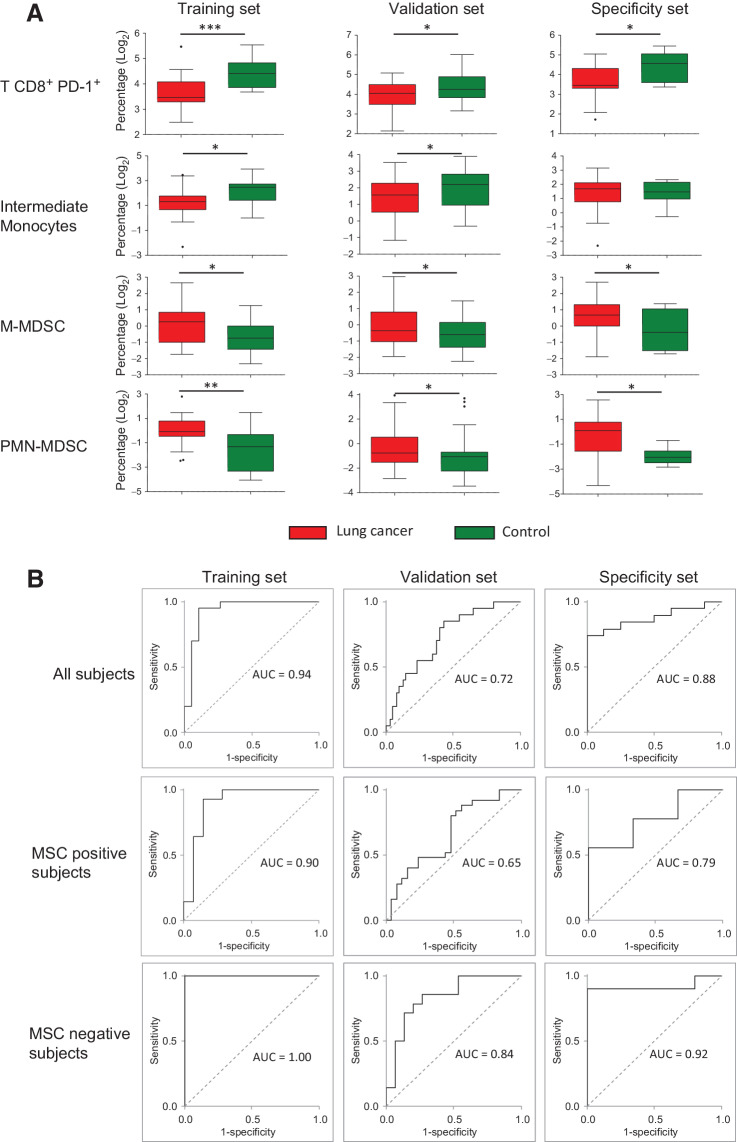
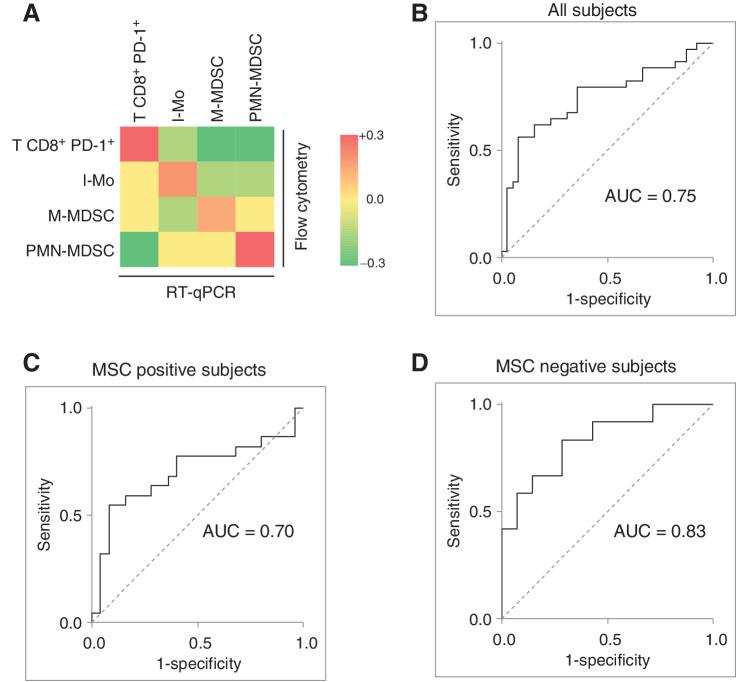
Results: Monocytic myeloid-derived suppressor cell (MDSC), polymorphonuclear MDSC, intermediate monocytes and CD8+PD-1+ T cells distinguished patients with lung cancer from controls with AUCs values of 0.94/0.72/0.88 in the training, validation, and lung cancer specificity set, respectively. AUCs raised up to 1.00/0.84/0.92 in subgroup analysis considering only MSC-negative subjects. A 14-immune genes expression signature distinguished patients from controls with AUC values of 0.76 in the validation set and 0.83 in MSC-negative subjects.

Conclusions: An immune-based classifier can enhance the accuracy of blood testing, thus supporting the contribution of systemic immunity to lung carcinogenesis.

Impact: Implementing LDCT screening trials with minimally invasive blood tests could help reduce unnecessary procedures and optimize cost-effectiveness.


Figures

Figure 1. High-dimensional flow cytometry analysis. Scheme of immune subpopulation analyzed in patients with lung cancer and controls.
Figure 1.
High-dimensional flow cytometry analysis. Scheme of immune subpopulation analyzed in patients with lung cancer and controls.
Figure 2. The comprehensive peripheral immune cell profile of patients with screening-detected lung cancer and controls. Gating strategies of lymphoid populations (A) and myeloid populations (B). Plots marked with “G” are shown to indicate the setting of the gate. C, Unsupervised clustering considering all 32 subpopulation analyzed in the training set. Dashed lines separate the 4 and the 2 clusters of samples and immune cells at the larger distance (1-correlation), respectively.
Figure 2.
The comprehensive peripheral immune cell profile of patients with screening-detected lung cancer and controls. Gating strategies of lymphoid populations (A) and myeloid populations (B). Plots marked with “G” are shown to indicate the setting of the gate. C, Unsupervised clustering considering all 32 subpopulation analyzed in the training set. Dashed lines separate the 4 and the 2 clusters of samples and immune cells at the larger distance (1-correlation), respectively.
Figure 3. Immune cell subsets discriminate patients with lung cancer and controls. A, Box plots reporting the levels of selected peripheral immune subsets in patients with lung cancer and controls measured by flow cytometry in the training, validation and specificity sets. Asterisks represent the level of significance by unpaired t test P value (*, < 0.05; **, < 0.01; ***, < 0.001). B, Performance of the ISC, estimated using the AUC-ROC method, in the training, validation and specificity sets, considering all the analyzed subjects or stratified according to MSC test results.
Figure 3.
Immune cell subsets discriminate patients with lung cancer and controls. A, Box plots reporting the levels of selected peripheral immune subsets in patients with lung cancer and controls measured by flow cytometry in the training, validation and specificity sets. Asterisks represent the level of significance by unpaired t test P value (*, < 0.05; **, < 0.01; ***, < 0.001). B, Performance of the ISC, estimated using the AUC-ROC method, in the training, validation and specificity sets, considering all the analyzed subjects or stratified according to MSC test results.
Figure 4. Development of a RT-qPCR based lung cancer-related immune-score (ISC) for the analysis of PBMC samples. A, Heatmap reporting the correlations (Pearson R) between the gene expression values measured by RT-qPCR of 14 genes representative and the values of the 4 immune subset (T CD8+ PD-1+, I-Mo, M-MDSC, and PMN-MDSC) evaluated by flow cytometry on PBMC samples of the validation set. Genes are highlighted with the same color/s of the represented immune subset/s. ROC curves and respective AUCs evaluating the discriminatory capacity of the RT-qPCR based ISC considering the whole series (B) as well as the subsets composed by MSC-positive (C) and MSC-negative (D) subjects.
Figure 4.
Development of a RT-qPCR based lung cancer-related immune-score (ISC) for the analysis of PBMC samples. A, Heatmap reporting the correlations (Pearson R) between the gene expression values measured by RT-qPCR of 14 genes representative and the values of the 4 immune subset (T CD8+ PD-1+, I-Mo, M-MDSC, and PMN-MDSC) evaluated by flow cytometry on PBMC samples of the validation set. Genes are highlighted with the same color/s of the represented immune subset/s. ROC curves and respective AUCs evaluating the discriminatory capacity of the RT-qPCR based ISC considering the whole series (B) as well as the subsets composed by MSC-positive (C) and MSC-negative (D) subjects.
Figure 5. Lung cancer screening workflow integrating LDCT with blood-based tests such as the MSC and the ISC. Below are reported the expected percentages of participants who will pass through every step. Created with BioRender.com.
Figure 5.
Lung cancer screening workflow integrating LDCT with blood-based tests such as the MSC and the ISC. Below are reported the expected percentages of participants who will pass through every step. Created with BioRender.com.

Comment in

References

    1. Siegel RL, Miller KD, Fuchs HE, Jemal A. Cancer Statistics, 2021. CA Cancer J Clin 2021;71:7–33. - PubMed
    1. Aberle DR, Adams AM, Berg CD, Black WC, Clapp JD, Fagerstrom RM, et al. . Reduced lung-cancer mortality with low-dose computed tomographic screening. N Engl J Med 2011;365:395–409. - PMC - PubMed
    1. Pastorino U, Silva M, Sestini S, Sabia F, Boeri M, Cantarutti A, et al. . Prolonged lung cancer screening reduced 10-year mortality in the MILD trial. Ann Oncol 2019;30:1162–9. - PMC - PubMed
    1. de Koning HJ, van der Aalst CM, de Jong PA, Scholten ET, Nackaerts K, Heuvelmans MA, et al. . Reduced lung-cancer mortality with volume CT screening in a randomized trial. N Engl J Med 2020;382:503–13. - PubMed
    1. Jonas DE, Reuland DS, Reddy SM, Nagle M, Clark SD, Weber RP, et al. . Screening for lung cancer with low-dose computed tomography: updated evidence report and systematic review for the US Preventive Services Task Force. JAMA 2021;325:971–87. - PubMed

Publication types