

Inferring risks of coronavirus transmission from community household data
- PMID: 36112916
- PMCID: PMC9465559
- DOI: 10.1177/09622802211055853
Inferring risks of coronavirus transmission from community household data
Abstract
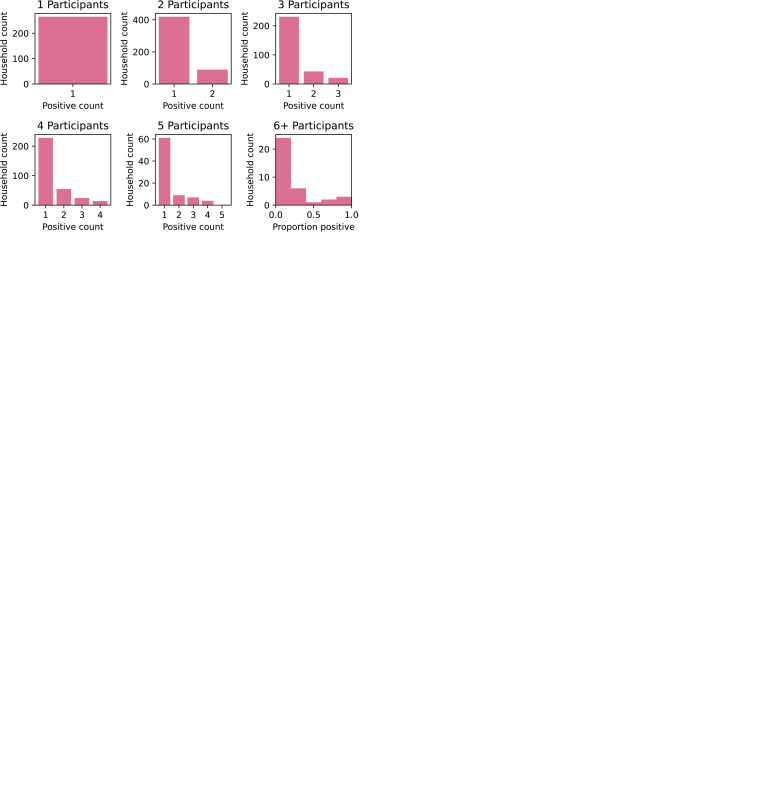
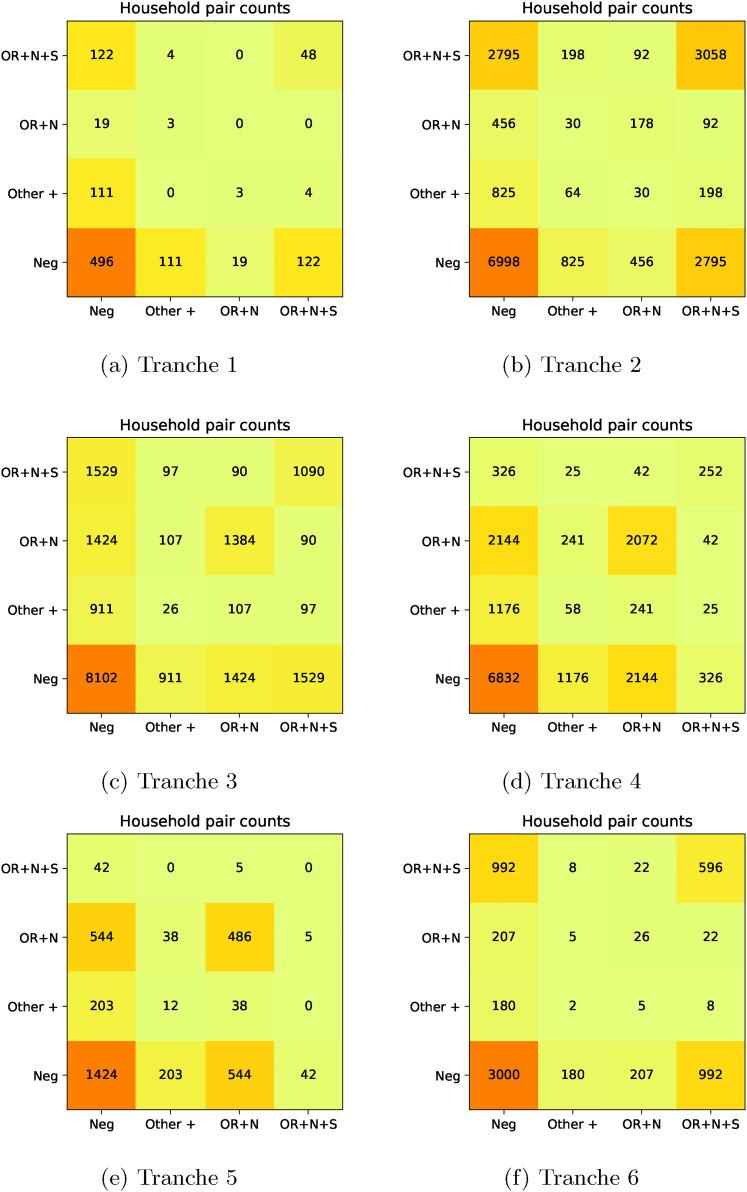
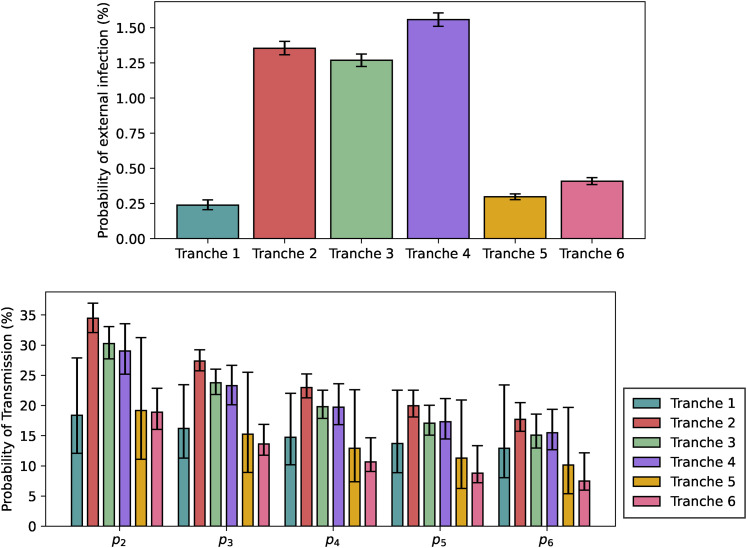
The response of many governments to the COVID-19 pandemic has involved measures to control within- and between-household transmission, providing motivation to improve understanding of the absolute and relative risks in these contexts. Here, we perform exploratory, residual-based, and transmission-dynamic household analysis of the Office for National Statistics COVID-19 Infection Survey data from 26 April 2020 to 15 July 2021 in England. This provides evidence for: (i) temporally varying rates of introduction of infection into households broadly following the trajectory of the overall epidemic and vaccination programme; (ii) susceptible-Infectious transmission probabilities of within-household transmission in the 15-35% range; (iii) the emergence of the Alpha and Delta variants, with the former being around 50% more infectious than wildtype and 35% less infectious than Delta within households; (iv) significantly (in the range of 25-300%) more risk of bringing infection into the household for workers in patient-facing roles pre-vaccine; (v) increased risk for secondary school-age children of bringing the infection into the household when schools are open; (vi) increased risk for primary school-age children of bringing the infection into the household when schools were open since the emergence of new variants.
Keywords: COVID-19; Epidemic; infection; model; risk factors.
Conflict of interest statement
Figures


References
-
- Scientific Advisory Group for Emergencies. Reducing within- and between-household transmission in light of new variant SARS-CoV-2, 14 January, 2021. Paper prepared by the Environmental Modelling Group (EMG), the Scientific Pandemic Insights Group on Behaviours (SPI-B) and the Scientific Pandemic Influenza Group on Modelling (SPI-M).
-
- Office for National Statistics. Families and households, Edition: 15 November, 2019. https://www.ons.gov.uk/peoplepopulationandcommunity/birthsdeathsandmarri....
-
- Abbey H. An examination of the reed-frost theory of epidemics. Hum Biol 1952; 24: 201–233. - PubMed
-
- Frost WH. Some conceptions of epidemics in general. Am J Epidemiol 1976; 103: 141–151. - PubMed
Publication types
MeSH terms
Supplementary concepts
Grants and funding
LinkOut - more resources
Full Text Sources
Medical
Miscellaneous
