Gut microbiome of multiple sclerosis patients and paired household healthy controls reveal associations with disease risk and course

iMSMS Consortium. Electronic address: sergio.baranzini@ucsf.edu et al. Cell. .

Abstract

Changes in gut microbiota have been associated with several diseases. Here, the International Multiple Sclerosis Microbiome Study (iMSMS) studied the gut microbiome of 576 MS patients (36% untreated) and genetically unrelated household healthy controls (1,152 total subjects). We observed a significantly increased proportion of Akkermansia muciniphila, Ruthenibacterium lactatiformans, Hungatella hathewayi, and Eisenbergiella tayi and decreased Faecalibacterium prausnitzii and Blautia species. The phytate degradation pathway was over-represented in untreated MS, while pyruvate-producing carbohydrate metabolism pathways were significantly reduced. Microbiome composition, function, and derived metabolites also differed in response to disease-modifying treatments. The therapeutic activity of interferon-β may in part be associated with upregulation of short-chain fatty acid transporters. Distinct microbial networks were observed in untreated MS and healthy controls. These results strongly support specific gut microbiome associations with MS risk, course and progression, and functional changes in response to treatment.

Keywords: bioinformatics; gut microbiota; metagenomic sequencing; multiple sclerosis.


Conflict of interest statement

Declaration of interests The authors declare no competing interests.

Figures

Figure 1.
Figure 1.. Study summary and overall strategy.
(A) Workflow of microbiome study in 576 MS patients and their household healthy controls. (B) Boxplot of microbiome α-diversity in MS, RRMS, PMS and their HHCs (ANOVA, n.s., not significant). (C-D) PCoA of weighted UniFrac community distance by disease and treatment status (C) and disease subtype (D) (R2 and FDR adjusted p values were tested by PERMANOVA). (E) Bar plot showing the effect size (Adonis R2) of confounders significantly associated with gut microbial variations (weighted UniFrac distance, PERMANOVA, FDR adjusted p < 0.05).
Figure 2.
Figure 2.. Microbial taxa alterations between MS and HHC.
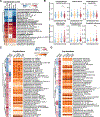
(A) Taxa altered in untreated MS (n= 209), untreated RRMS (n=112) or untreated PMS (n=97) versus their HHCs (mixed linear regression model adjusted for age, BMI, sex, recruiting site and house). “-” indicates species with lower variance across samples were filtered out and not included in linear regression. *FDR < 0.05, **FDR< 0.01, ***FDR< 0.001. (B) Arcsine square-root transformed relative abundance of 3 decreased species and 3 increased species in untreated MS versus HHCs. (C-D) Species were significantly correlated with MS Severity Scores (MSSS) in untreated RRMS patients (n=112, C) or in untreated PMS (n=97, D). Spearman correlations were adjusted for age and body mass index. *p < 0.05, **p < 0.01. Averaged abundance of significant species are shown in untreated RRMS untreated PMS and their corresponding HHCs.
Figure 3.
Figure 3.. Sequence-based functional difference between MS and HHC.
(A) Metagenomics pathways altered in untreated MS, untreated RRMS or untreated PMS versus their HHCs (mixed linear regression model adjusted for age, BMI, sex, recruiting site and house, *FDR < 0.05, **FDR< 0.01, ***FDR< 0.001), and dominant microbial species contributing to “PWY-4702” and “GALACT-GLUCUROCAT-PWY” pathways. (B) Arcsine square-root transformed relative abundance of two proteins in Akkermansia muciniphila that participate in phytate degradation I pathway (PWY-4702) (Paired T-test, *p < 0.05). (C) Organism-pathway-reaction-compound network built on pathway “GALACT-GLUCUROCAT-PWY: superpathway of hexuronide and hexuronate degradation” using the SPOKE knowledge graph. (D) Arcsine square-root transformed relative abundance of protein 2-dehydro-3-deoxy-phosphogluconate aldolase in Faecalibacterium prausnitzii that participates in superpathway of hexuronide and hexuronate degradation pathway (GALACTGLUCUROCAT-PWY) (Paired T-test, *p < 0.05). (E) High-class organized pathways altered in treated and untreated RRMS (mixed linear regression model adjusted for age, BMI, sex, recruiting site and house, *FDR < 0.05, **FDR< 0.01, ***FDR< 0.001). (F) Pathways were significantly correlated with MSSS in untreated RRMS patients (RRMS, n=112, top panel) or in untreated PMS (PMS, n=97, bottom panel). Spearman correlations are adjusted for age and body mass index. *p < 0.05, **p < 0.01. Averaged abundances of significant pathways are shown in untreated RRMS and untreated PMS compared to their corresponding HHCs.
Figure 4.
Figure 4.. Disease status specific co-abundance species.
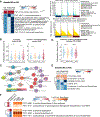
Microbial co-abundance communities specific for (A) untreated MS and (B) HHCs by cohort specific analysis (quantile range outlier). Each node indicates one species and color indicates the phylum classification. Each edge represents a significant species-species co-abundance relationship. (C) Overlapped counts of species and co-abundances in untreated MS specific and HHC specific networks. (D) Differential species in untreated MS versus HHC were overlapped with cohort specific species. (E-F) Functional pathways unique to the species highlighted in untreated MS- (E) or HHC (F) specific networks. Line size indicates betweenness centrality of a species in the cohort specific co-abundance network.
Figure 5.
Figure 5.. Treatment -associated metagenomic changes in RRMS patients.
(A) PCoA of weighted UniFrac community distance of RRMS subjects treated and untreated, and their corresponding household healthy controls (P values were obtained by PERMANOVA). (B) metagenomics species (C) metabolic pathways altered in treated and untreated RRMS (mixed linear regression model adjusted for age, BMI, sex, recruiting site and house). *p < 0.05, **p < 0.01, ***p < 0.001 and linear coefficient ≥ upper 5% or coefficient ≤ lower 5%.
Figure 6.
Figure 6.. Treatment-associated metabolomic alterations in RRMS patients.
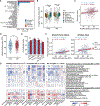
(A) 31 microbe-derived metabolites and (B) 8 short chain fatty acids in treated and untreated RRMS in both stool and serum. Linear coefficient was measured by mixed linear regression model adjusted for age, BMI, sex, recruiting site and house. *p < 0.05, **p < 0.01, ***p < 0.001. (C) Disease duration adjusted MS severity score (gMSSS) was compared between untreated and treated RRMS (ANOVA). (D) KEGG pathways enriched by 23 microbe-derived metabolites in response to interferon (FDR < 0.05). (E) Concentration of propionic acid in feces (left) and serum (right) compared for treated and untreated RRMS, compared to their respective HHCs. DMF, dimethyl fumarate, GA, glatiramer acetate. (F) Expression of SLC16A in human bronchial epithelial cells stimulated by IFN-β from study by Shapira, S. D. et al. The SLC16A gene was represented by two probes (202236_at and 209900_s_at) of Affymetrix HT Human Genome U133 Arrays.
Figure 7.
Figure 7.. Diet and gut microbes.
(A) Bar plot showing the effect size (Adonis R2) of confounders associated with dietary variations (Jaccard dissimilarity). Confounders showing a significant impact on gut microbiome were labeled (PERMANOVA, *FDR ≤ 0.05). (B) Boxplot of healthy eating index measured in the participants from each recruiting site. (C) Pearson’s correlation between healthy eating index and microbial α-diversity in healthy (blue) and MS (red) individuals. (D) Boxplot of healthy eating index measured in MS patients and their household healthy controls (paired T-test, ***p < 0.001). (E) Difference in dietary components between MS and HHC individuals (paired T-test, *p < 0.05, ***p < 0.001). (F) Species significantly correlated with HEI (Pearson’s correlation with FDR < 0.05). (G) Correlations between dietary component and MS-associated species measured in healthy controls, untreated MS and all samples, respectively (mixed linear regression model adjusted for age, BMI, sex and recruiting site, *FDR < 0.05, **FDR < 0.01, ***FDR < 0.001).

Comment in

References

    1. Arabshahi S, Lahmann PH, Williams GM, Marks GC, and van der Pols JC (2011). Longitudinal change in diet quality in Australian adults varies by demographic, socio-economic, and lifestyle characteristics. J Nutr 141, 1871–1879. 10.3945/jn.111.140822. - DOI - PubMed
    1. Baranzini SE, and Oksenberg JR (2017). The Genetics of Multiple Sclerosis: From 0 to 200 in 50 Years. Tr ends in genetics : TIG 33, 960–970. 10.1016/j.tig.2017.09.004. - DOI - PMC - PubMed
    1. Becken B, Davey L, Middleton DR, Mueller KD, Sharma A, Holmes ZC, Dallow E, Remick B, Barton GM, David LA, et al. (2021). Genotypic and Phenotypic Diversity among Human Isolates of Akkermansia muciniphila. Mbio 12. ARTN e00478–21 10.1128/mBio.00478-21. - DOI - PMC - PubMed
    1. Berer K, Gerdes LA, Cekanaviciute E, Jia X, Xiao L, Xia Z, Liu C, Klotz L, Stauffer U, Baranzini SE, et al. (2017). Gut microbiota from multiple sclerosis patients enables spontaneous autoimmune encephalomyelitis in mice. Proc Natl Acad Sci U S A 114, 10719–10724. 10.1073/pnas.1711233114. - DOI - PMC - PubMed
    1. Blacher E, Bashiardes S, Shapiro H, Rothschild D, Mor U, Dori-Bachash M, Kleimeyer C, Moresi C, Harnik Y, Zur M, et al. (2019). Potential roles of gut microbiome and metabolites in modulating ALS in mice. Nature 572, 474–480. 10.1038/s41586-019-1443-5. - DOI - PubMed

Publication types