. 2022 Sep 15;185(19):3588-3602.e21.
doi: 10.1016/j.cell.2022.08.011.

Actin cytoskeleton remodeling primes RIG-I-like receptor activation

Affiliations

Actin cytoskeleton remodeling primes RIG-I-like receptor activation

Dhiraj Acharya et al. Cell. .

Abstract

The current dogma of RNA-mediated innate immunity is that sensing of immunostimulatory RNA ligands is sufficient for the activation of intracellular sensors and induction of interferon (IFN) responses. Here, we report that actin cytoskeleton disturbance primes RIG-I-like receptor (RLR) activation. Actin cytoskeleton rearrangement induced by virus infection or commonly used reagents to intracellularly deliver RNA triggers the relocalization of PPP1R12C, a regulatory subunit of the protein phosphatase-1 (PP1), from filamentous actin to cytoplasmic RLRs. This allows dephosphorylation-mediated RLR priming and, together with the RNA agonist, induces effective RLR downstream signaling. Genetic ablation of PPP1R12C impairs antiviral responses and enhances susceptibility to infection with several RNA viruses including SARS-CoV-2, influenza virus, picornavirus, and vesicular stomatitis virus. Our work identifies actin cytoskeleton disturbance as a priming signal for RLR-mediated innate immunity, which may open avenues for antiviral or adjuvant design.

Keywords: MDA5; PP1; RIG-I; actin cytoskeleton; innate immunity; type-I interferon; viral infection.


Conflict of interest statement

Declaration of interests The authors declare no competing interests.

Figures
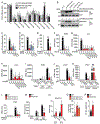
Figure 1.
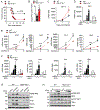
Figure 1.. R12C promotes antiviral signaling by RLRs
(A) IFN-β luciferase reporter activity in HEK293T cells depleted of the indicated PP1-regulatory proteins using specific siRNAs and transfected with an IFN-β luciferase plasmid along with GST-MDA5(2CARD), GST-RIG-I(2CARD) or FLAG-MAVS, determined at 48 h post-transfection and normalized to co-transfected β-galactosidase. si.C, non-targeting control siRNA. (B) Phosphorylation of GST-MDA5(2CARD) at S88 (upper) or GST-RIG-I(2CARD) at S8 (lower) in HEK293T cells that were co-transfected with the indicated siRNAs, determined at 48 h post-transfection by IP with anti-GST and immunoblot (IB) with anti-pS88-MDA5 or anti-pS8-RIG-I. (C and D) IFN-β luciferase reporter activity in HEK293T cells that were transfected with the indicated siRNAs together with either FLAG-RIG-I (C) or FLAG-MDA5 (D), determined as in (A). (E) ELISA of IFN-β in the supernatant of primary human lung fibroblasts (NHLFs) that were transfected for 24 h with the indicated siRNAs and then stimulated with 100 ng/mL poly(I:C)-LyoVec for 20 h. (F) qRT-PCR analysis of IFNB1 transcripts in A549-hACE2 cells that were transfected for 30 h with the indicated siRNAs and then infected with SCoV2 (MOI 1) for 48 h. (G and H) qRT-PCR analysis of IL8 and CCL5 transcripts in NHLF cells that were transfected for 30 h with si.C, si.R12C (pool of 4 siRNAs), the four individual siRNAs targeting R12C (si.R12C #1 to #4), or si.RIG-I (control) and then infected with IAVΔNS1 (MOI 0.1) for 18 h. (I—K) qRT-PCR analysis of IFNB1 transcripts in NHLF cells that were transfected for 40 h with the indicated siRNAs and then infected either with VSV for 12 h (I) or ZIKV (MOI 0.5) for 48 h (J), or stimulated with 0.5 μg/mL poly(I:C)-LyoVec or 1 μg/mL poly(dA:dT)-LyoVec for 10 h (K). (L) qRT-PCR analysis of IFNB1 transcripts in CRISPR R12C KO HEK293T clonal cell lines (Cl-1 and Cl-2) or WT control cells that were stimulated with 1 μg/mL poly(I:C)-LyoVec for 24 h. (M) ELISA of IFN-β in the supernatant of WT and R12C KO HEK293T cells that were infected with SeV for 18 h. (N) qRT-PCR analysis of SCoV2 nucleocapsid (N) transcripts in A549-hACE2 cells that were transfected for 30 h with the indicated siRNAs and then infected with SCoV2 (MOI 1) for the indicated times. (O) Frequency of GFP-positive WT and R12C KO HEK293T cells that were infected with VSV-GFP (MOI 0.001) for 20 h, assessed by flow cytometry. (P) IAV titers in the supernatant of WT and R12C KO HEK293T cells that were infected with IAV (MOI 0.001) for 72 h, determined by plaque assay. Data are representative of one target screen (A) or at least two (B—P) independent experiments [mean ± s.d. of n = 3 (A, C—P) biological replicates]. **p < 0.01, ***p < 0.001, ****p < 0.0001 (Student’s t-test). NS, not significant. See also Figures S1.
Figure 2.
Figure 2.. R12C is required for antiviral innate immune defense in vivo
(A—C) Ppp1r12c−/− mice and WT littermate controls (8 week-old) were infected via intranasal inoculation with 1 x 10⁶ PFU of VSV. (A) Kaplan–Meier survival curves of VSV-infected Ppp1r12c−/− (n = 15) and WT (n = 11) mice. (B) VSV titers in the brain of Ppp1r12c−/− and WT mice at day 4 post-infection, determined by plaque assay. (C) qRT-PCR analysis of VSV N transcripts in whole blood of Ppp1r12c−/− and WT mice at the indicated times. (D) qRT-PCR analysis of Ifnb1 transcripts in dermal fibroblasts from Ppp1r12c−/− and WT mice that were infected ex vivo with VSV at the indicated MOIs for 16 h. (E and F) qRT-PCR analysis of the indicated transcripts in dermal fibroblasts from Ppp1r12c−/− and WT mice that were infected ex vivo with SeV (10 HAU/mL) for the indicated times (E) or with mutEMCV at the indicated MOIs for 8 h (F). (G) IRF3 (S396) phosphorylation and ISG protein abundances (IFIT2 and ISG15) in dermal fibroblasts from Ppp1r12c−/− and WT mice that were infected ex vivo with IAVΔNS1 (MOI 5) or SeV (25 HAU/mL) for 10 h, or that remained uninfected (Mock), determined by IB. (H) IRF3 (S396) and TBK1 (S172) phosphorylation and protein abundances in dermal fibroblasts from Ppp1r12c−/− and WT mice that were infected ex vivo with mutEMCV (MOI 2) for 6 h, or that remained uninfected (Mock), determined by IB. Data are representative of at least two independent experiments [mean ± s.d. of n = 11-15 (A), n = 5-6 (B and C) or n = 3 (D—F) biological replicates]. *p < 0.05, **p < 0.01, ***p < 0.001, ****p < 0.0001 [Mantel–Cox test (A) or Student’s t-test (B—F)]. See also Figure S2.
Figure 3.
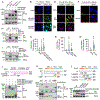
Figure 3.. R12C mediates binding of PP1 to RLRs
(A) Binding of endogenous R12C to RIG-I in NHLF cells that were either mock-treated or infected with VSV (MOI 0.5) for the indicated times, determined by IP with anti-R12C (or an IgG isotype control). (B and D) Representative confocal microscopy images showing the colocalization of endogenous R12C and RIG-I (red) in NHLF cells that were either mock-treated or infected with VSV-GFP (B), or IAV-GFP (MOI 2) or ZIKV-GFP (MOI 10) (D) for 24 h, assessed by PLA. Nuclei, DAPI (blue). Scale bar, 50 μm. (C and E) Quantification of the PLA data from the experiments in (B) and (D). (F) Representative confocal microscopy images showing the colocalization of endogenous R12C with MDA5 (red) in small airway epithelial cells (SAEC) that were either mock-treated or infected with SCoV2 (MOI 2) for 24 h. Nuclei, DAPI (blue). Scale bar, 20 μm. (G) Quantification of the PLA data from the experiment in (F). (H) Binding of endogenous RIG-I to PP1γ-HA in WT and R12C KO HEK293T cells that were infected with SeV (100 HAU/mL) for 18 h, determined by IP with anti-HA. (I) Binding of endogenous MDA5 to PP1γ-HA in WT and R12C KO HEK293T cells that were infected with EMCV (MOI 1) for 6 h, determined by IP with anti-MDA5. (J) Top: Schematic representation of the domain architecture of RIG-I and of its truncation mutant constructs used in the experiments. CARD, caspase activation and recruitment domain; CTD, C-terminal domain. Bottom: Binding of myc-R12C to the indicated FLAG-tagged RIG-I mutants in transiently transfected HEK293T cells, determined by IP with anti-FLAG. (K) Top: Schematic representation of the domain organization of R12C and of its truncation mutant constructs used in the mapping experiments. AR1-4, ankyrin repeats 1-4; CC, coiled coil. Bottom: Binding of FLAG-RIG-I to the indicated myc-tagged R12C mutant proteins in transiently transfected HEK293T cells, determined as in (J). (L) Top: Schematic representation of the domain organization of R12C and of its ankyrin repeat (AR) deletion mutant constructs used in the mapping studies. Bottom: Binding of GST-RIG-I(2CARD) to myc-tagged R12C mutant proteins in transiently transfected HEK293T cells, determined by IP with anti-myc. Data are representative of at least two independent experiments (A, B, D, F, H—L) or are from three independent experiments combined (C, E and G) [mean ± SEM of n = 97-111 (C), n = 49-123 (E), or n = 65-75 (G) cells]. ****p < 0.0001 (Student’s t-test). See also Figure S3.
Figure 4.
Figure 4.. R12C is required for RLR signaling in human macrophages
(A and C) Representative confocal microscopy images showing the colocalization of endogenous R12C and RIG-I (A) or MDA5 (C) (red) in primary human macrophages that were either mock-treated (A and C) or infected with VSV-GFP or IAV-GFP (each MOI 2) for 16 h (A) or with EMCV (MOI 10) for 6 h (C), determined by PLA. Nuclei, DAPI (blue). Scale bar, 20 μm. (B and D) Quantification of the PLA data from the experiments in (A) and (C). (E) Endogenous STAT1 (S727) phosphorylation in primary human macrophages that were transfected with the indicated siRNAs and then either mock-treated or infected with VSV or mutEMCV (each MOI 5) for 6 h, determined in the WCLs by IB with the indicated antibodies. (F) qRT-PCR analysis of IFNB1 transcripts in primary human macrophages that were transfected with the indicated siRNAs and either mock-treated or infected with VSV at the indicated MOIs for 12 h. Data from two individual donors are shown. (G and H) qRT-PCR analysis of IFNB1 transcripts in primary human macrophages that were transfected as in (F) and then either mock-treated (G and FI), infected with mutEMCV for 12 h (G), or stimulated with 2.5 μg/mL poly(I:C)-LyoVec or poly(dA:dT)-LyoVec for 8 h (H). Data shown in (B) and (D) are from four individual donors combined [mean ± SEM of n = 130-171 (B) or n = 192-209 (D) cells]. Data shown in (E—H) are representative of either two (E) or at least three (F—H) individual donors [mean ± s.d. of n = 2 or 3 biological replicates]. *p < 0.05, **p < 0.01, ***p < 0.001, ****p < 0.0001 (Student’s t-test). See also Figure S4.
Figure 5.
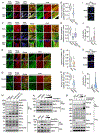
Figure 5.. Virus-induced actin cytoskeleton disturbance induces R12C relocalization and RLR priming
(A and C) Representative confocal microscopy images showing colocalization of endogenous R12C (red) with F-actin (green) in NHLF cells that were either mock-treated or infected with either VSV-GFP (MOI 2) for 16 h (A), or with IAV-GFP (MOI 2) or ZIKV-GFP (MOI 10) for 24 h (C). Nuclei (DAPI), blue. Scale bar, 10 μm. (B and D) Quantification of R12C and F-actin co-localization from the experiments in (A) and (C). (E and G) Representative confocal microscopy images showing colocalization of endogenous R12C (red) with F-actin (green) in NHLF cells treated with cell culture medium (Mock) or VLPs (150 per cell) for 2 h (E), or with CytoD (10 μM) or DMSO (control) for 10 min (G). Nuclei (DAPI), blue. Scale bar, 10 μm. (F and H) Quantification of R12C and F-actin co-localization from the experiments in (E) and (G). (I and K) Representative confocal microscopy images showing colocalization of endogenous R12C and RIG-I (red) in NHLF cells that were treated as in (E) and (G), determined by PLA. (J and L) Quantification of the PLA data from the experiments in (I) and (K). (M) Binding of endogenous R12C to RIG-I, MDA5 and PP1α/γ in NHLFs that were either mock-treated or treated with CytoD (5 μM) for the indicated times, determined by IP with anti-R12C. (N) Dephosphorylation of endogenous RIG-I in NHLFs that were either mock-treated or treated with increasing amounts (2, 4, and 8 μM) of CytoD for 4 h, determined by IP with anti-RIG-I and IB with anti-pS8-RIG-I. (O) Dephosphorylation of endogenous RIG-I in NHLFs that were either mock-treated or incubated with VLPs (10 or 100 per cell) for 6 h, determined as in (N). (P) K63-linked ubiquitination of endogenous RIG-I in NHLFs that were either mock-treated, incubated with VLPs (10 or 100 per cell) or infected with SeV (25 HAU/mL) (positive control) for 12 h, determined by IP with anti-RIG-I and IB with anti-K63-Ub. Data are representative of at least two independent experiments [mean ± SEM of n = 26 (B), n = 9-23 (D), n = 10 (F), or n = 10-13 (H) images] or from three independent experiments combined [mean ± SEM of n = 28-73 (J) or n = 90-131 (L) cells]. ***p < 0.001, ****p < 0.0001 (Student’s t-test). See also Figures S5.
Figure 6.
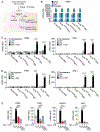
Figure 6.. Actin cytoskeleton disturbance promotes RLR-induced antiviral gene expression
(A) Schematic of the A549 cell system that inducibly expresses 3p-SLoverhang RNA or 3p-SLblunt RNA (termed ‘Signal 2’), or no exogenous RNA, upon Dox treatment. These cells were treated with VLPs or PEI (termed ‘Signal 1’ or ‘Priming Signal’) to induce actin cytoskeleton disturbance, or with control media (C—E), followed by measuring IFN or ISG mRNA expression. See also Methods. (B) qRT-PCR analysis of IFNB1 transcripts in the indicated A549 cell lines that were infected with SeV (5 HAU/mL) or IAVΔNS1 (MOI 2) for 16 h under Dox-free culture conditions. (C) qRT-PCR analysis of IFNB1 and IFNL1 transcripts in the indicated A549 cell lines that were cultured for 12 h in the presence or absence of Dox (2 μg/mL) and then incubated for 16 h with VLPs (100 per cell) or control media. (D) qRT-PCR analysis of IFNB1 and IFNL1 transcripts in the indicated A549 cell lines that were cultured for 12 h in the presence or absence of Dox (2 μg/mL) and then treated with PEI (10 μg/mL) for 16 h, or left untreated. (E) qRT-PCR analysis of the indicated antiviral transcripts in 3p-SL blunt A549 cells that were transfected with the indicated siRNAs for 30 h, cultured with or without Dox (2 μg/mL) for 12 h, and then treated with VLPs (100 per cell) for 16 h. Data in (B—E) are representative of at least two independent experiments [mean ± s.d. of n = 3 biological replicates]. ****p < 0.0001 (Student’s t-test). #1 and #2 indicate two individual cell lines. exo-RNA, exogenous RNA. See also Figure S6.

Comment in

References

    1. Ablasser A, Bauernfeind F, Hartmann G, Latz E, Fitzgerald KA, and Hornung V (2009). RIG-I-dependent sensing of poly(dA:dT) through the induction of an RNA polymerase III-transcribed RNA intermediate. Nat Immunol 10, 1065–1072. - PMC - PubMed
    1. Basler CF, Mikulasova A, Martinez-Sobrido L, Paragas J, Muhlberger E, Bray M, Klenk HD, Palese P, and Garcia-Sastre A (2003). The Ebola virus VP35 protein inhibits activation of interferon regulatory factor 3. J Virol 77, 7945–7956. - PMC - PubMed
    1. Bielig H, Lautz K, Braun PR, Menning M, Machuy N, Brugmann C, Barisic S, Eisler SA, Andree M, Zurek B, et al. (2014). The cofilin phosphatase slingshot homolog 1 (SSH1) links NOD1 signaling to actin remodeling. PLoS Pathog 10, e1004351. - PMC - PubMed
    1. Blanco-Melo D, Nilsson-Payant BE, Liu WC, Uhl S, Hoagland D, Moller R, Jordan TX, Oishi K, Panis M, Sachs D, et al. (2020). Imbalanced Host Response to SARS-CoV-2 Drives Development of COVID-19. Cell 181, 1036–1045 e1039. - PMC - PubMed
    1. Bottcher R, Hollmann M, Merk K, Nitschko V, Obermaier C, Philippou-Massier J, Wieland I, Gaul U, and Forstemann K (2014). Efficient chromosomal gene modification with CRISPR/cas9 and PCR-based homologous recombination donors in cultured Drosophila cells. Nucleic Acids Res 42, e89. - PMC - PubMed

Publication types