. 2022 Nov 16;110(22):3833-3851.e22.
doi: 10.1016/j.neuron.2022.08.020. Epub 2022 Sep 15.

Theory of hierarchically organized neuronal oscillator dynamics that mediate rodent rhythmic whisking

Affiliations

Theory of hierarchically organized neuronal oscillator dynamics that mediate rodent rhythmic whisking

David Golomb et al. Neuron. .

Abstract

Rodents explore their environment through coordinated orofacial motor actions, including whisking. Whisking can free-run via an oscillator of inhibitory neurons in the medulla and can be paced by breathing. Yet, the mechanics of the whisking oscillator and its interaction with breathing remain to be understood. We formulate and solve a hierarchical model of the whisking circuit. The first whisk within a breathing cycle is generated by inhalation, which resets a vibrissa oscillator circuit, while subsequent whisks are derived from the oscillator circuit. Our model posits, consistent with experiment, that there are two subpopulations of oscillator neurons. Stronger connections between the subpopulations support rhythmicity, while connections within each subpopulation induce variable spike timing that enhances the dynamic range of rhythm generation. Calculated cycle-to-cycle changes in whisking are consistent with experiment. Our model provides a computational framework to support longstanding observations of concurrent autonomous and driven rhythmic motor actions that comprise behaviors.

Keywords: brainstem; breathing; medulla; network; oscillations; rate modeling; synchrony; vibrissa.


Conflict of interest statement

Declaration of interests The authors declare no competing interests.

Figures

Figure 1.
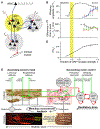
Figure 1.. Analysis of existing and new data related to breathing and whisking.
(A) Typical experimental set-up for recording from head-restrained rodents. (B,C) Time series of breathing (red) and whisking (blue) for a head-restrained rat [Moore et al. (2013)]. (D) Annotated whisking and breathing. The values θ1amp,θ2amp, and θ3amp denote the amplitudes of the first, second and third whisks within the same breathing cycle. (E) Time series of breathing (red) and whisking (blue) for a free moving rat. (F) Semi-logarithmic plot of the number of breaths for which there are NW whisking cycles. The dotted lines are exponential fits with slopes of 0.95 (restrained) and 0.92 (free). (G) Amplitude of the first whisk θ1amp within a breathing cycle versus NW. Bars denote the standard error. (H) Probability density function of logθI+1amp/θiamp versus θiamp for i=1,2,3. The normalization of each distribution is dlogθI+1amp/θiamplogθI+1amp/θiamp=1. (I) Modulation depth of the spike rates of vIRt neurons. Black circles are from intracellular recordings with lightly anesthetized rats [Deschênes et al. (2016b)]. Green circles represent new data from awake mice with extracellular electrodes and optical tagging. The depth is calculated from the spike rates as <( minimum – maximum )/ average > where the averaging is on a per cycle basis. Data plotted as a function of the phase in the whisk cycle at which the spike rate is maximal. (J) New analysis to determine the coefficient of variation CV2 as a function of the phase in the whisk cycle. Same data and notations as in panel I.
Figure 2.
Figure 2.. Architecture of the brainstem circuit model for whisking.
(A) The neuronal-level circuit for conductance-based modeling. The triangles are neurons. The blue and red colors denote inhibitory and excitatory connections, respectively. The currents Iextr and IextF represent constant external depolarizing input to the vIRt and vFNM neuronal populations, respectively. Conductances between neuronal pairs are denoted by gintra/K for pairs of neurons that belong to the same subpopulation, by ginter/K for neuronal pairs from two different subpopulations, and by gFr/K for vIRtret-to-vFNM connections. The amplitude of the square-wave pBötC-to-vIRtret input is denoted by grB. (B) Schematic of the different currents in the cellular modelfor vIRt cells; the same model applies to vFM neurons with possibly different conductances. The currents are a leak current, IL, the transient sodium current, INa, the delayed rectifier potassium current, IKdr, the persistent sodium current INaP, the mixed cation h-current, Ih, an M-type K+ current, Iadapt, external excitatory currents from other brain areas, Iext and synaptic currents Isyn that comprise Iintra,Iinter and IrB or IFr. Details in Star Methods. (C) Spiking rate versus Iextr curves of the single vIRt neuron model for values of gadapt that range from 0 to 7 mS/cm2 (solid lines). The insert is for gadapt=6mS/cm2 with the spike rate versus Iext curve as solid and a linear approximation as dotted, as used in the rate model. (D) The force developed by an intrinsic muscle that moves vibrissae as a function of the average firing rate of vFMN neurons, MF. The solid black line denotes simulation results, and the dotted red line denotes a fit. Details in Star Methods. (E) Schematic of the rate model in which each population of neurons is described by an activation variable that controls its synaptic outputs, and another activation variable that controls the adaptation current. The interactions Jintra and Jinter replace gintra and ginter, respectively.
Figure 3.
Figure 3.. Dynamics of a conductance-based and rate-based feed-forward circuit for whisking.
(A) Schematic of the conductance-based circuit with input from the pBötC to the vIRtret and from the vIRtret to the vFMN to drive whisking. The vIRtpro subpopulation plays no role. We further set gintra=0. We chose grB=0.5mS/cm2,gFr=3mS/cm2,Iextr=20μA/cm2,IextF=3.1μA/cm2,K=25,gadaptr=7mS/cm2,gadaptF=0.3mS/cm2,N=100,TpBötC=200ms,Trand=10ms,ΔTvIRt=70ms. Details of all calculations are in Star Methods. (B) Time courses of spiking for an example neuron from the vIRtret and vFMN subpopulations. (C) Rastergrams across twenty neurons in the simulated subpopulations. (D) The calculated vibrissa angle θ(t), calculated with the model of the motor plant and common parameters. (E) The reduced rate-based circuit with input from the pBötC to the vIRtret and from the vIRtret to the vFMN to drive whisking. (F-G) Circuit properties as the synaptic conductance from the pBötC is increased. Parameters are as in panel A, except that grB is varied. Properties are computed using three modeling strategies. First, by numerical simulations of the conductance-based model (solid black line and circles). Simulations were carried out over five realizations for each parameter set, and the error bars denote standard deviation. Second, by numerical simulations of the rate model equations (thick cyan line). Third, from analytical solution of the rate model (thin orange line). The average number of spikes produced by the vIRtret neurons per whisk is shown in panel F. The average number of spikes produced by vFMN neurons per whisk is shown in panel G. The average amplitude of each whisk is shown in panel H.
Figure 4.
Figure 4.. Dynamics of conductance-based circuits without pBötC input to the vIRt.
(A) Schematic of the circuit with connections only between vIIRtret and vIRtpro subpopulations, for which we set gintra=0. We chose ginter=6mS/cm2,gadapt=7mS/cm2,Iext=20μA/cm2,K=25, and N=100. (B) Time courses of spiking for an example neuron from the vIIRtret, vIIRtpro, and vFMN subpopulations. (C) Rastergrams across twenty neurons in the simulated subpopulations. (D) The calculated vibrissa angle θ(t) with the model of the motor plant. (E) Schematic of the circuit with connections both between vIRtret and vIRtpro subpopulations and within each subpopulation, for which we set gintra=12mS/cm2 and ginter=20mS/cm2; other parameters as in panel A (F) Time courses of spiking for an example neurons for the vIRtret, vIRtpro, and vFMN subpopulations. Properties are computed using three modeling strategies as in Figure 3F–G. (G) Rastergrams across twenty neurons in the simulated subpopulations. (H) The calculated vibrissa angle θ(t).
Figure 5.
Figure 5.. Dynamical properties of circuits without pBötC input to the vIRt.
(A) Schematic of the circuit. The dynamics are calculated for gintra=12mS/cm2,gadaptr=7mS/cm2,gadaptF=0.3mS/cm2 and IextF=3.1μA/cm2. The excitatory input fixed at Iextr=20μA/cm2 and ginter is varied in terms of Δgsyn=gintergintra for panels B, D, F, H, and J). Δgsyn is fixed at Δgsyn=8mS/cm2 (black arrow in in panel L) with Iext varying for panels C, E, G, I, and K. Properties are computed using three modeling strategies as in Figure 3F–G, and we use the same notation. (B,C) The average spike rate Mi. The values for the vIRtret and vIRtpro are equal in the uniform state, as the neuronal subpopulations are constantly spiking, and in the symmetric oscillatory state, since the neuronal subpopulations are alternately active. As of Δgsyn increases, one subpopulation becomes more active than the other and the less active subpopulation becomes silent at large values of Δgsyn. The rate model exhibits a transition from a symmetric oscillatory state to a bistable state at a value of Δgsyn=gdet while the actual transition in the conductance-based model occurs when of Δgsyn has further increased. The values of gtr and gdet are defined in Star Methods. (D,E) The whisking frequency 1/TvIRt. (F,G) The average whisking amplitude <θamp>t. Analytical results are computed in panel G for the uniform and the bistable state. (H,I) The whisking set-point <θset>t. Analytical results are computed in panel I for the uniform and the bistable state. (J,K) The coefficient of variation CV2i calculated solely from the conductance-based equations. (L) Phase diagram showing the three dynamical regimes, uniform (left), oscillatory (middle) and bistable (right) computed using the conductance-based model. Values of the coefficient of variation CV2i calculated for several values of Δgsyn and gintra are written. (M) The coefficient of variation CV2i calculated as a function of K. The grey ribbon denotes typical experimentally-measured values for CV2 (Figure 1J)
Figure 6.
Figure 6.. Dynamics of a conductance-based circuits with pBötC input to the vIRt.
See Figure 2A for the schematic. We used the same parameters as the simulation without pBötC input (Figure 4E) plus grB=0.5mS/cm2,TpBötC=700ms,Trand=150ms, and ΔtpBötC=70ms. (A) Time courses of spiking for an example neurons for the vIRtret, vIRtpro, and vFMN subpopulations. (B) Rastergrams across twenty neurons in the simulated subpopulations. (C) The calculated vibrissa angle θ(t). (D) The calculated whisking amplitude as a function of ginter. The first whisk is driven by the pBötC input and subsequent intervening whisks, with i=2-4, are driven by internal vIRt dynamics. Error bars in D-F denote SD. (E). The calculated whisking amplitudes as a function of grB. (F). The slowing down of whisking for the intermediate whisks is shown by plotting <tw,i+1tw,i>t as a function of ginter.
Figure 7.
Figure 7.. Effects of pBötC activity on the timing and amplitude of the subsequent whisk.
(A). Cartoon to define the symbols. (B). Stimulations of the conductance model to show the vibrissa angle θ(t) for two aspects of the timing of breathing relative to whisking (Figure 4). The common vertical dotted line, labeled tw,1, denotes the peak of a whisk just prior to input from the pBötC. The top trace is an example of input from the pBötC just after the time of the peak and the bottom trace is an example of relatively late input. Model parameters: grB=0.5mS/cm2,TpBötC=700ms,Trand=150ms (defined in Star Methods), ΔtpBötC=70ms. (C). Experimental results from head-restrained rats [Moore et al. (2013)] of the total time between protraction, Δtw,21, as a function of the time of inhalation after the last protraction, ΔtBw,1. The gray line is the linear fit over the full range. The mean is over all trials. (D). The calculated total time Δtw,21 as a function of ΔtBw,1 for two values of input conductance from the pBötC, i.e., grB=0.5mS/cm2 (top) and 0.05mS/cm2 (bottom). The gray line is the linear fit over the range 40ms<ΔtBw,1<140ms. For grB=0.05mS/cm2 and small values of ΔtBw,1, the deduced values of Δtw,21 may be large since the first increase in the vibrissa angle caused by input from the pBötC may be too small to be detected as a separate new whisk. (E). The slope sw,21 (top) and the intercept Δtw,21(0) (bottom) as a function of grB. Error bars denote SD. The dotted lines denote the experimental values from panel D. (F). The whisking amplitude <θ1amp>t versus breathing frequency fpBötC. The top panel shows the frequency computed from experimental data from head-restrained rats [Moore et al. (2013)]. The grey area highlights the range of exploratory sniffing frequencies. The bottom panel shows the frequency calculated as a function of breathing frequency for two values of ΔtpBötC=20ms (bottom lines) and 70 ms (top lines), and Trand=10 (dotted lines) and 70 ms (solid lines).
Figure 8.
Figure 8.. Analysis of perturbations to vIRtret synapses and summary of brainstem control of whisking.
(A) Diagram for dynamics of the vibrissa oscillator with the vIIRtret under partial gephyrin degradation to weaken all GABAA-ergic inhibitory inputs to vIRtret neurons (yellow circle). We assume that all synapses in the vIRtret are equally weakened by a factor of x. A. We chose gintra=12mS/cm2,ginter=20mS/cm2,grB=0.5mS/cm2, gadapt=7mS/cm2,Iextr=20μA/cm2,IextF=3.1μA/cm2,K=25 and N=100 for our simulations. (B) The amplitude of the four consecutive whisks after the onset of pBötC activity, denoted by i=1,2,3,4, as a function of x (Equation 23). Error bars denote SD. The yellow band in B-D indicates the fraction estimated from the data in [Takatoh et al. (2022)]. (C) The times between average successive whisks <tw,i+1tw,i>t as a function of as a function of x. (D) Dependence of CV2i of vIRtret neurons on the value of x. (E) Summary of the circuitry that underlies the vibrissa motor plant. The vIRt drives rhythmic motion, and the shape of the waveform is set by the motor plant and feedback pathway that change the input to intrinsic and extrinsic motoneurons, and thus contact forces, upon touch. Figures updated from published summary [Bellavance et al. (2017), Kleinfeld and Deschênes (2011)].

Similar articles

Cited by

References

    1. Ádám A, Kling U, 1971. On the behaviour of some cyclically symmetric networks. Acta Cybernetica 1, 69–79.
    1. Amit DJ, 1989. Modeling Brain Function: The World of Attractor Neural Networks. Cambridge University Press, Cambridge.
    1. Argaman T, Golomb D, 2018. Does layer 4 in the barrel cortex function as a balanced circuit when responding to whisker movements? Neuroscience 368, 29–45. URL: http://www.ncbi.nlm.nih.gov/pubmed/28774782, doi:10.1016/j.neuroscience.2017.07.054. - DOI - PubMed
    1. Ausborn J, Snyder AC, Shevtsova NA, Rybak IA, Rubin JE, 2018. State-dependent rhythmogenesis and frequency control in a half-center locomotor cpg. J Neurophysiol 119, 96–117. URL: http://www.ncbi.nlm.nih.gov/pubmed/28978767, doi:10.1152/jn.00550.2017. - DOI - PMC - PubMed
    1. Bellavance MA, Takatoh J, Lu J, Demers M, Kleinfeld D, Wang F, Deschénes M, 2017. Parallel inhibitory and excitatory trigemino-facial feedback circuitry for reflexive vibrissa movement. Neuron 95, 673–682. - PMC - PubMed

Publication types

LinkOut - more resources