. 2022 Oct 10;40(10):1111-1127.e9.
doi: 10.1016/j.ccell.2022.08.014. Epub 2022 Sep 15.

Cancer cell autophagy, reprogrammed macrophages, and remodeled vasculature in glioblastoma triggers tumor immunity

Affiliations

Cancer cell autophagy, reprogrammed macrophages, and remodeled vasculature in glioblastoma triggers tumor immunity

Agnieszka Chryplewicz et al. Cancer Cell. .

Abstract

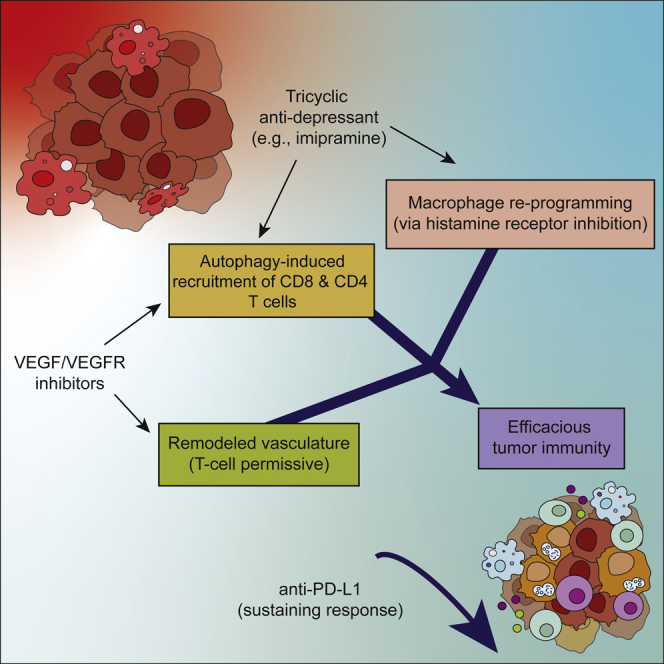
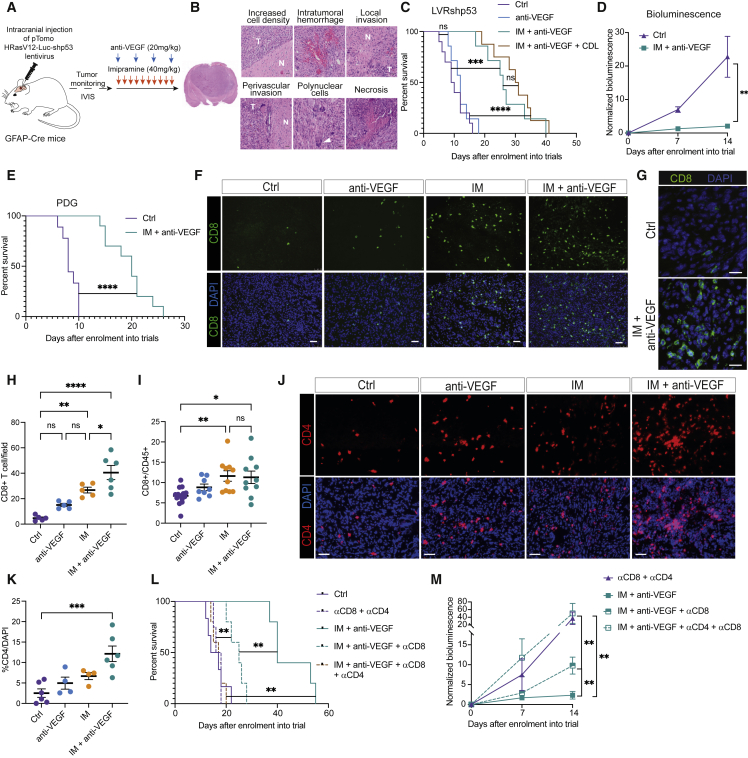
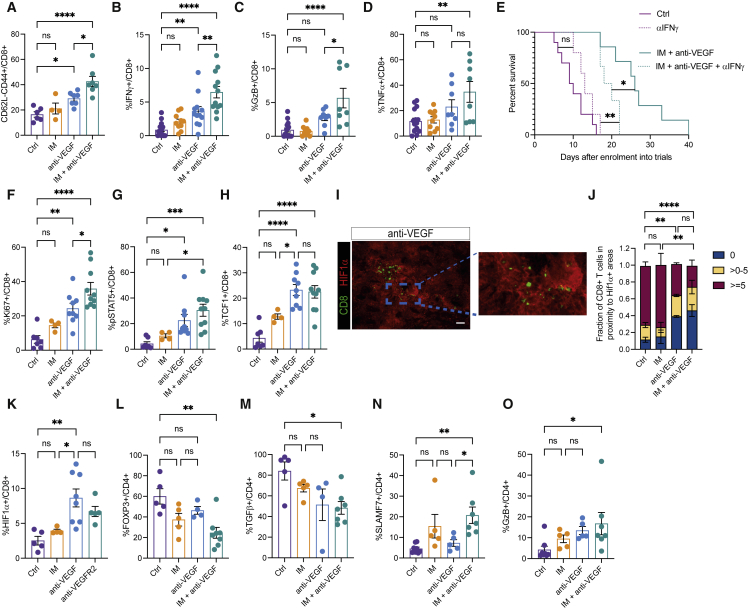
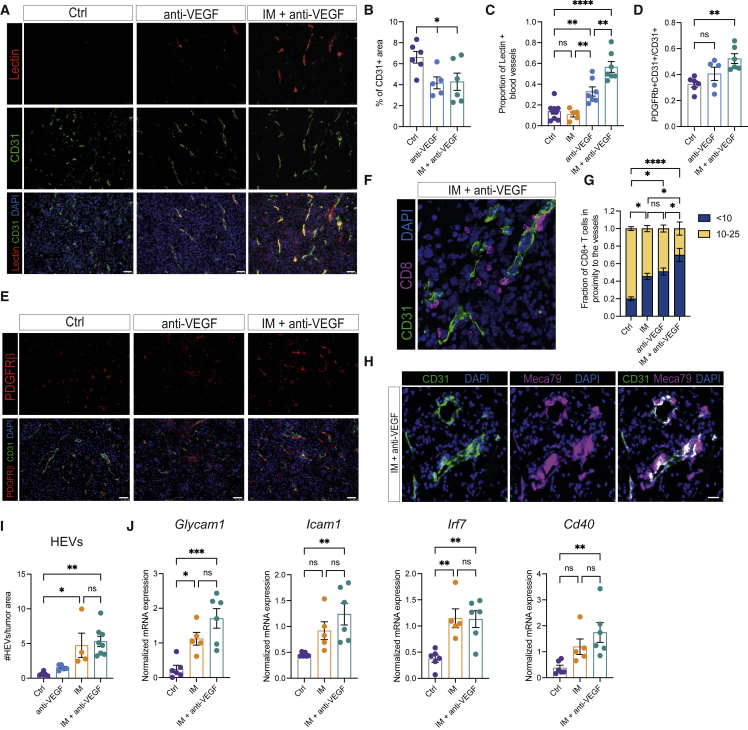
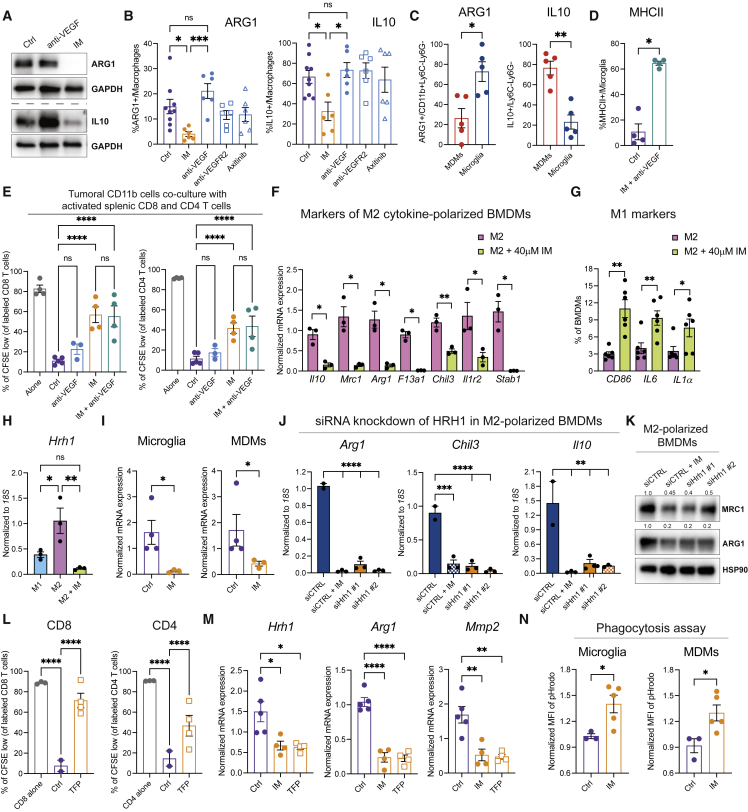
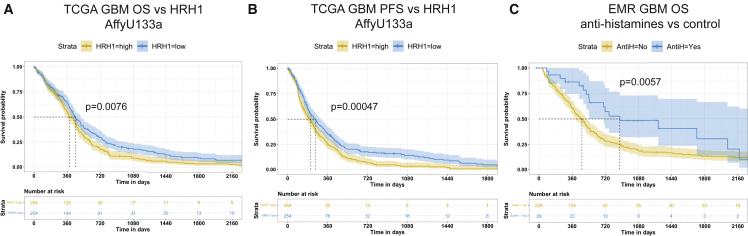
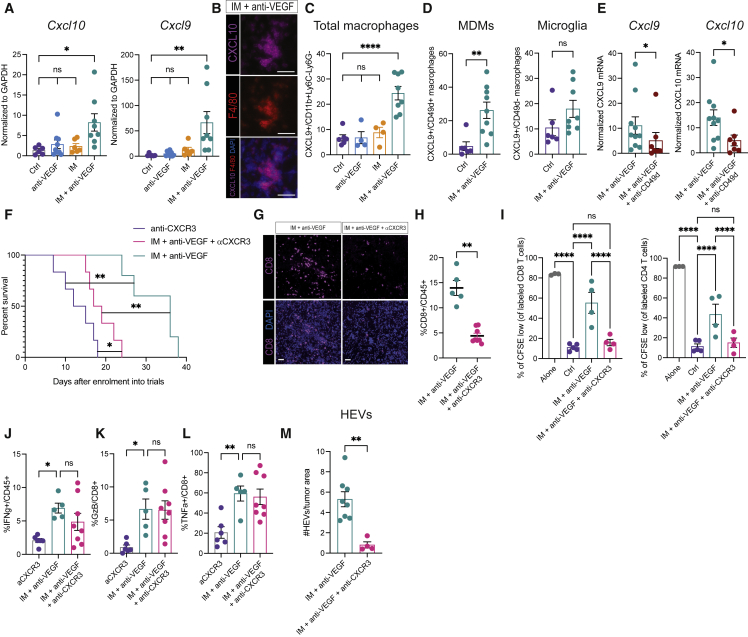
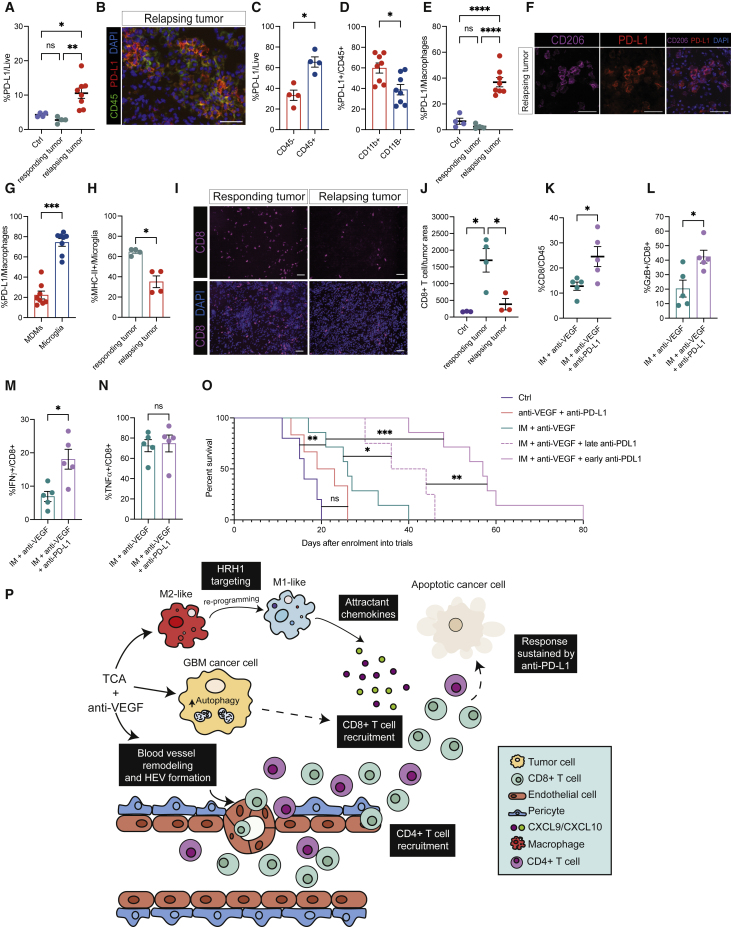
Glioblastoma (GBM) is poorly responsive to therapy and invariably lethal. One conceivable strategy to circumvent this intractability is to co-target distinctive mechanistic components of the disease, aiming to concomitantly disrupt multiple capabilities required for tumor progression and therapeutic resistance. We assessed this concept by combining vascular endothelial growth factor (VEGF) pathway inhibitors that remodel the tumor vasculature with the tricyclic antidepressant imipramine, which enhances autophagy in GBM cancer cells and unexpectedly reprograms immunosuppressive tumor-associated macrophages via inhibition of histamine receptor signaling to become immunostimulatory. While neither drug is efficacious as monotherapy, the combination of imipramine with VEGF pathway inhibitors orchestrates the infiltration and activation of CD8 and CD4 T cells, producing significant therapeutic benefit in several GBM mouse models. Inclusion up front of immune-checkpoint blockade with anti-programmed death-ligand 1 (PD-L1) in eventually relapsing tumors markedly extends survival benefit. The results illustrate the potential of mechanism-guided therapeutic co-targeting of disparate biological vulnerabilities in the tumor microenvironment.

Keywords: VEGF inhibitors; anti-PD-L1 immune checkpoint blockade; glioblastoma immunotherapy; high endothelial venules; histamine receptor signaling; immunostimulatory autophagy; multi-targeted cancer therapy; remodeling tumor vasculature; reprogramming immunosuppressive macrophages; repurposing tricyclic antidepressants.


Conflict of interest statement

Declaration of interests D.H. is also a Director of Opna Bio, a Lausanne-based biotech startup that has no relationship to or vested interest in this manuscript.

Figures

None
Graphical abstract
Figure 1
Figure 1
IM + anti-VEGF prolongs survival of GBM mice and is immunostimulatory (A) Schematic of the long-term therapeutic trials in the lentiviral-induced mouse model of glioma. (B) Representative images of H&E-stained tissue sections from a tumor that developed in an end-stage LVRshp53 animal. Scale bar, 30 μm. Representative of whole-slide images of three tumors. (C) Survival of tumor-bearing LVRshp53 animals subjected to the indicated treatments. Control (Ctrl) (n = 10), anti-VEGF (n = 7), IM + anti-VEGF (n = 7), IM + anti-VEGF + CDL (n = 8). (D) Normalized bioluminescence in LVRshp53 animals treated as indicated for 2 weeks. (E) Survival of PDG animals subjected to the indicated treatments. Ctrl (n = 9), IM + anti-VEGF (n = 10). (F) Representative images of CD8 (green) and DAPI nuclear staining (blue). Scale bar, 50 μm. Image is illustrative of the analysis shown in (H). (G) High-magnification images of CD8 T cells in a Ctrl versus an IM + anti-VEGF-treated tumor. Scale bar, 50 mm (H) Quantification of CD8 T cells in LVRshp53 tumors treated as indicated for 12 days. Each dot indicates the average of 8–12 immuno-stained tumor tissue sections from one mouse. (I) Flow cytometry analysis of CD8 T cells in LVRshp53 tumors treated as indicated for 12 days. Cells were gated as CD45+CD3+CD8+. Ctrl (n = 15), anti-VEGF (n = 8), IM (n = 10), IM + anti-VEGF (n = 10). (J and K) Representative images (J) and quantification (K) of CD4 T cells in whole LVRshp53 tumor tissue section. Animals were treated for 12 days. Scale bar, 50 μm. Ctrl (n = 6), anti-VEGF (n = 4), IM (n = 4), IM + anti-VEGF (n = 6). (L) Assessment of the functional contributions of CD8 and CD4 T cells to survival benefit. Ctrl (n = 6), αCD8 + αCD4 (n = 4), IM + anti-VEGF (n = 5), IM + anti-VEGF + αCD8 + αCD4 (n = 5), IM + anti-VEGF + αCD8 (n = 5). (M) Normalized bioluminescence in LVRshp53 mice treated as indicated in (L). (Para break) Data in all quantitative panels are shown as mean ± SEM. p < 0.05; ∗∗p < 0.01; ∗∗∗p < 0.001; ∗∗∗∗p < 0.0001; ns, no statistical significance. For survival analyses, Mantel-Cox test was performed. Other analyses by Mann-Whitney or one-way ANOVA tests.
Figure 2
Figure 2
CD8 and CD4 T cells are activated upon IM + anti-VEGF treatment (A) Flow cytometry analysis of effector T cells (CD62L-CD44+). Ctrl (n = 6), IM (n = 4), anti-VEGF (n = 7), and IM + anti-VEGF (n = 7). (B) FACS analysis of IFNγ intracellular staining in fixed and permeabilized CD8+T cells. Ctrl (n = 16), IM (n = 10), anti-VEGF (n = 12), IM + anti-VEGF (n = 12). (C and D) Flow cytometry analysis of GzB (C) and TNFα (D) intracellular staining in CD8 T cells. Ctrl (n = 15), IM (n = 10), anti-VEGF (n = 8), IM + anti-VEGF (n = 8). (E) Functional importance of IFNγ for the survival of LVRshp53 animals subjected to the indicated treatments. Ctrl (n = 9), anti-IFNγ (n = 5), IM + anti-VEGF (n = 7), IM + anti-VEGF + anti-IFNγ (n = 6). Statistical analysis by Mantel-Cox test. (F, G, and H) Flow cytometry analysis of Ki67 (F), pSTAT5 (G), and TCF1 (H) in CD8 T cells. Ctrl (n = 7), IM (n = 4), anti-VEGF (n = 9), and IM + anti-VEGF (n = 10). (I) Representative image of HIF-1α (red) and CD8 (green) in the anti-VEGF-treated tumor. Image is illustrative of the analysis performed in (J). Scale bar, 50 mm (J) Quantification of the proximity of CD8 T cells to hypoxic regions in the entire area of full sections of GBM tumors. The zones were divided into 0 μm (i.e., within the HIF-1α+ zone), >0 and <5 μm, and >5 μm separating T cells and HIF-1α+ regions. Ctrl (n = 11), IM (n = 4), anti-VEGF (n = 4), IM + anti-VEGF (n = 5). (K) Flow cytometry analysis of intracellular HIF-1α expression in fixed and permeabilized CD8 T cells. Ctrl (n = 5), IM (n = 4), anti-VEGF (n = 8), anti-VEGFR2 (n = 5). (L) Flow cytometry analysis of intracellular FOXP3 expression in CD4 T cells. Ctrl (n = 5), IM (n = 5), anti-VEGF (n = 4), IM + anti-VEGF (n = 8). (M) Flow cytometry analysis of intracellular TGFβ expression in CD4 T cells. Ctrl (n = 5), IM (n = 5), anti-VEGF (n = 4), IM + anti-VEGF (n = 7). (N and O) Flow cytometry analysis of SLAMF7 (N) and GzB (O) expression in CD4 T cells. Ctrl (n = 8), IM (n = 5), anti-VEGF (n = 5), IM + anti-VEGF (n = 7). (Para break) Data in all quantitative panels are shown as mean ± SEM. p < 0.05; ∗∗p < 0.01; ∗∗∗p < 0.001; ∗∗∗∗p < 0.0001; ns, no statistical significance. Statistical analysis by one-way ANOVA, unless otherwise indicated.
Figure 3
Figure 3
Anti-VEGF alone and in combination with IM remodels the glioblastoma tumor vasculature (A) Representative images of systemically perfused lectin (red), CD31 (green), and DAPI (blue) of LVRshp53 tumors treated as indicated for 1 week. Images are illustrative of the analysis shown in (B) and (C). Scale bar, 50 mm (B) Percentage of CD31+ area in LVRshp53 tumors treated as indicated for 1 week. Each dot indicates the average of 8–12 fields in tissue sections from a GBM tumor from one mouse. Ctrl (n = 6 tumors), anti-VEGF (n = 5), IM + anti-VEGF (n = 6). (C) Proportion of i.v.-infused lectin and CD31 co-localization as a percentage of CD31+ area. Each dot indicates the average of 8–12 fields in tissue sections from a GBM tumor from one mouse (n = 5–6 tumors for each group). (D and E) Quantification (D) and representative images (E) of PDGFRβ and CD31 co-localization as a percentage of CD31-positive area. Each dot indicates the average of 8–12 fields in tissue sections from a GBM tumor (n = 5–6 tumors for each group). Scale bar, 50 μm. (F and G) Representative image (F) and quantification (G) of a fraction of CD8+ T cells located within 10 μm or beyond (10–25 μm) the closest CD31+ blood vessel in the entire area of the GBM tumor section. Ctrl (n = 6), IM (n = 4), anti-VEGF (n = 6) and IM + anti-VEGF (n = 6). Scale bar, 50 μm. (H and I) Representative immunofluorescence (H) of MECA79 (magenta), CD31 (green), and DAPI (blue) and HEVs quantification (I) in the entire area of a full tumor tissue section. Ctrl (n = 6), anti-VEGF (n = 5), IM (n = 4), IM + anti-VEGF (n = 8). Scale bar, 20 μm. (J) mRNA expression of endothelial cell markers. Data are normalized to 18S RNA. (Para break) Data in all quantitative panels are presented as mean ± SEM. p < 0.05; ∗∗p < 0.01; ∗∗∗p < 0.001; ∗∗∗∗p < 0.0001; ns, no statistical significance. Statistical analysis by one-way ANOVA, unless otherwise indicated.
Figure 4
Figure 4
Imipramine downregulates an M2-like program in TAMs (A) Western blot analysis of ARG1 and IL-10 in single tumors treated or not with IM or anti-VEGF. (B) Flow cytometry analysis of ARG1 and IL-10 expression in GBM tumors treated for 1 week. Ctrl (n = 9 tumors), IM (n = 6), anti-VEGF (n = 6), anti-VEGFR2 (n = 6), Axitinib (n = 6). Macrophages were gated as CD45+CD11b+Ly6C-Ly6G−. (C) Expression of ARG1 and IL-10 in microglia (CD49d−) and MDMs (CD49d+) assessed by FACS in untreated tumors (n = 5). (D) Expression of MHC-II within microglia as assessed by flow cytometry. Ctrl (n = 4 tumors) and IM + anti-VEGF (n = 4). (E) Ex vivo co-cultures of tumoral CD11b cells and activated splenic CFSE-labeled CD8 or CD4 T cells. Each dot represents the average of two or three technical replicates. T cells alone (n = 4), Ctrl co-culture (n = 5), anti-VEGF (n = 3), IM (n = 4), IM + anti-VEGF (n = 4). (F) Analysis of the M2-like program in cytokine-polarized macrophages as assessed by qRT-PCR analysis of Ctrl and IM-treated M2-like BMDMs. Expression is normalized to 18S statistics by Welch’s t test. Each dot represents an individual sample. Data are representative of three independent experiments. (G) Analysis of the M1-like program in BMDMs assessed by FACS. Each dot represents an individual replicate. (H) Expression of Hrh1 mRNA normalized to 18S in ex vivo M1-and M2-polarized BMDMs, either untreated or IM treated for 24 h. Each dot represents an individual sample. Data are representative of three independent experiments. (I) mRNA expression of Hrh1 in FACS-sorted microglia or MDMs from Ctrl and IM-treated tumors. (J) mRNA expression of Arg1, Chil3, and Il10 in M2-polarized macrophages that were transfected with siCtrl or two different siHrh1 constructs. Cells were treated with 40 μm IM for 24 h. Data are representative of two independent experiments. (K) Western blot analysis of MRC1 and ARG1 expression of siRNA-transfected M2 BMDMs. Data are representative of two independent experiments. (L) CD8 and CD4 T cell proliferation during co-culture with tumoral CD11b cells isolated from untreated (n = 2) or TFP-treated tumors (n = 4). (M) mRNA expression of Hrh1, Arg1, and MMP2 in CD11b cells isolated from tumors treated with IM (n = 4), TFP (n = 4), or untreated Ctrl (n = 5). (N) Phagocytosis assay involving sorted microglia and MDMs from untreated or IM-treated tumors assayed with green pHrodo S. aureus bioparticles. Data presented as mean fluorescence intensity (MFI) of pHrodo/live cells. (Para break) Data in all quantitative panels are presented as mean ± SEM p < 0.05; ∗∗p < 0.01; ∗∗∗p < 0.001; ∗∗∗∗p < 0.0001; ns, no statistical significance. Statistical analysis by Mann-Whitney test or one-way ANOVA, unless otherwise stated.
Figure 5
Figure 5
Low HRH1 expression is associated with better survival, and antihistamine treatment is prognostic in GBM patients (A and B) Kaplan-Meier overall survival (A) and progression-free survival (B) analyses of TCGA GBM cohort analyzed with the AffyU133a expression array (n = 539). The blue and yellow shades correspond to the 95% confidence intervals. Patients were split by median expression. p values were calculated based on the Cox proportional hazard model. (C) Kaplan-Meier estimate of the overall survival of GBM patients from a single center who received antihistamine treatment (n = 29, blue curve) or not (n = 226, yellow curve). The shades correspond to the 95% confidence intervals. The analysis was performed with the Mantel-Cox log-rank test.
Figure 6
Figure 6
Macrophage-derived CXCR3 ligands are required for the therapeutic benefit conveyed by the combinatorial regimen of IM + anti-VEGF (A) Cxcl10 and Cxcl9 expression in bulk tumors. mRNA expression is shown relative to Gapdh. Ctrl (n = 6), anti-VEGF (n = 9), IM (n = 6), IM + anti-VEGF (n = 8). (B) Representative image of CXCL10 (magenta), F4/80 (red), and DAPI (blue) staining of LVRshp53 tumors treated with IM + anti-VEGF. Scale bar, 50 μm. Images are illustrative of five to six fields in tissue sections from three different tumors. (C) CXCL9 expression in TAMs in untreated (n = 6) or tumors treated with anti-VEGF (n = 4), IM (n = 4), or IM + anti-VEGF (n = 8) revealed by flow cytometry. (D) CXCL9 expression in MDMs and microglia, evaluated as in (C). (E) mRNA Cxcl9 and Cxcl10 expression assessed in bulk tumors treated with IM + anti-VEGF (n = 10) ± αCD49d (n = 7) to selectively deplete MDMs but not microglia. Expression is normalized to Gapdh housekeeping gene. (F) Assessing the contribution of CXCR3 function to the survival of LVRshp53 animals subjected to the indicated treatments. Treatment cohorts: αCXCR3 (n = 6), IM + anti-VEGF + αCXCR3 (n = 6), IM + anti-VEGF (n = 5). (G) Representative images of CD8 T cells aimed to assess the effects of αCXCR3. Representative of whole-slide image analysis of three tumors per treatment. Scale bar, 50 mm (H) Flow cytometry analysis of CD8 T cells in tumors subjected to indicated treatments. (I) Ex vivo co-culture of tumor-derived CD11b cells and CFSE-labeled CD8 or CD4 T cells. Myeloid cells were isolated from tumors treated with IM + anti-VEGF (n = 4), IM + anti-VEGF + αCXCR3 (n = 4), or untreated Ctrl (n = 5). Each dot represents an average of two or three technical replicates. (J) Minimal effect on IFNγ secretion by CD8 T cells in tumors treated with αCXCR3, IM + anti-VEGF, or the triple combination. (K and L) No effect of αCXCR3 on (K) GzB or (L) TNFα secretion by CD8 T cells co-treated with IM + anti-VEGF. (M) Quantification of immunostaining for HEVs in tumors treated with IM + anti-VEGF (n = 8) or IM + anti-VEGF + αCXCR3 (n = 4). The data are shown as number of HEVs per square millimeter of tumor tissue. (Para break) Data in all quantitative panels are presented as mean ± SEM. p < 0.05; ∗∗p < 0.01; ∗∗∗p < 0.001; ∗∗∗∗p < 0.0001; ns, no statistical significance. Statistical analysis by Mann-Whitney test or one-way ANOVA, unless otherwise stated.
Figure 7
Figure 7
PD-L1 is induced in relapsing tumors and its blockade potentiates T cell function to prolong survival benefit in GBM mice (A) FACS analysis of PD-L1 in the live cell compartment of tumors treated as indicated. Ctrl (n = 4 tumors), responding to IM + anti-VEGF (n = 4), and relapsing from IM + anti-VEGF (n = 8). Responding tumors were collected after 12 days of treatment. Relapsing tumors were collected when mice became symptomatic or when tumors started to re-grow following a stable phase. (B) Representative image of immunostaining to reveal PD-L1 (red), CD45 (green), and DAPI nuclei (blue) in relapsing tumors after IM + anti-VEGF. Scale bar, 50 μm. Assessed in four relapsing tumors, n = 8–10 fields imaged per tumor. (C) Percentage of PD-L1-positive live cells comparing the CD45and CD45+ compartments of n = 4 relapsing GBM tumors as revealed by flow cytometry. (D) PD-L1 expression in the CD11b− and CD11b+ compartments of CD45+ cells in n = 8 tumors assessed by flow cytometry. (E) Percentage of PD-L1-positive TAMs assessed by FACS. Ctrl (n = 4), responding tumor (n = 4), relapsing tumor (n = 8). (F) Representative immunostaining to reveal PD-L1 expression in TAMs. CD206 (magenta), PD-L1 (red), and DAPI in n = 3 relapsing tumors, 8–10 images per tumor. Scale bar, 50 μm. (G) Expression of PD-L1 in MDMs and microglia of n = 8 relapsing tumors assessed by flow cytometry. (H) MHC-II expression in microglia comparing responding (n = 4) and non-responding tumors (n = 4), assessed by flow cytometry. (I and J) Representative images (I) and quantification (J) of CD8 T cells in untreated (n = 3), responding (n = 4), and relapsing (n = 3) tumors under IM + anti-VEGF treatment. CD8 (magenta) and DAPI-stained nuclei. Scale bar, 50 μm. Each dot indicates the total number of CD8 T cells in an entire tissue section from a tumor. (K) Abundance of CD8 T cells from tumors treated short term with IM + anti-VEGF (n = 5) or IM + anti-VEGF + αPD-L1 (n = 5), assessed by flow cytometry. (L–N) GzB (L), IFNγ (M), and TNFα (N) expression in CD8 T cells from tumors treated as in (K). (O) Assessment of the benefits of early versus late incorporation of anti-PD-L1. Ctrl (n = 5), IM + anti-VEGF (n = 7), IM + anti-VEGF + late anti-PD-L1 (n = 4), IM + anti-VEGF + early anti-PD-L1 (n = 7), anti-VEGF + anti-PD-L1 (n = 6). (P) The combination of a TCA (e.g., imipramine) and VEGF/VEGFR inhibitors induces autophagy in cancer cells and remodels the tumor vasculature, conveying survival benefit for mice bearing GBM. Imipramine reprograms M2-like TAMs to more pro-inflammatory phenotype, via inhibition of histamine receptor signaling. Consequent to the dual treatment, CD8 and CD4 T cells are recruited and activated to evoke their cytotoxic effects. The inclusion of anti-PD-L1 in the therapeutic regimen helps sustain the immune response and increases survival benefit. (Para break) Data in all quantitative panels are presented as mean ± SEM. p < 0.05; ∗∗p < 0.01; ∗∗∗p < 0.001; ∗∗∗∗p < 0.0001; ns, no statistical significance. Statistical analysis by Mann-Whitney test or one-way ANOVA, unless otherwise stated.

Comment in

Similar articles

Cited by

References

    1. Akkari L., Bowman R.L., Tessier J., Klemm F., Handgraaf S.M., de Groot M., Quail D.F., Tillard L., Gadiot J., Huse J.T., et al. Dynamic changes in glioma macrophage populations after radiotherapy reveal CSF-1R inhibition as a strategy to overcome resistance. Sci. Transl. Med. 2020;12:eaaw7843. doi: 10.1126/scitranslmed.aaw7843. - DOI - PubMed
    1. Allen E., Jabouille A., Rivera L.B., Lodewijckx I., Missiaen R., Steri V., Feyen K., Tawney J., Hanahan D., Michael I.P., Bergers G. Combined antiangiogenic and anti-PD-L1 therapy stimulates tumor immunity through HEV formation. Sci. Transl. Med. 2017;9:eaak9679. doi: 10.1126/scitranslmed.aak9679. - DOI - PMC - PubMed
    1. Alspach E., Lussier D.M., Miceli A.P., Kizhvatov I., DuPage M., Luoma A.M., Meng W., Lichti C.F., Esaulova E., Vomund A.N., et al. MHC-II neoantigens shape tumour immunity and response to immunotherapy. Nature. 2019;574:696–701. doi: 10.1038/s41586-019-1671-8. - DOI - PMC - PubMed
    1. Aroldi F., Saleh R., Jafferji I., Barreto C., Saberian C., Middleton M.R. Lag3: from bench to bedside. Cancer Treat Res. 2022;183:185–199. doi: 10.1007/978-3-030-96376-7_6. - DOI - PubMed
    1. Bankhead P., Loughrey M.B., Fernández J.A., Dombrowski Y., McArt D.G., Dunne P.D., McQuaid S., Gray R.T., Murray L.J., Coleman H.G., et al. QuPath: open source software for digital pathology image analysis. Sci. Rep. 2017;7:16878. doi: 10.1038/s41598-017-17204-5. - DOI - PMC - PubMed

Publication types

MeSH terms

Substances