. 2023 Jan;164(1):89-102.
doi: 10.1053/j.gastro.2022.09.006. Epub 2022 Sep 13.

Th17 Cell-Derived Amphiregulin Promotes Colitis-Associated Intestinal Fibrosis Through Activation of mTOR and MEK in Intestinal Myofibroblasts

Affiliations

Th17 Cell-Derived Amphiregulin Promotes Colitis-Associated Intestinal Fibrosis Through Activation of mTOR and MEK in Intestinal Myofibroblasts

Xiaojing Zhao et al. Gastroenterology. 2023 Jan.

Abstract

Background & aims: Intestinal fibrosis is a significant complication of Crohn's disease (CD). Gut microbiota reactive Th17 cells are crucial in the pathogenesis of CD; however, how Th17 cells induce intestinal fibrosis is still not completely understood.

Methods: In this study, T-cell transfer model with wild-type (WT) and Areg-/- Th17 cells and dextran sulfate sodium (DSS)-induced chronic colitis model in WT and Areg-/- mice were used. CD4+ T-cell expression of AREG was determined by quantitative reverse-transcriptase polymerase chain reaction and enzyme-linked immunosorbent assay. The effect of AREG on proliferation/migration/collagen expression in human intestinal myofibroblasts was determined. AREG expression was assessed in healthy controls and patients with CD with or without intestinal fibrosis.

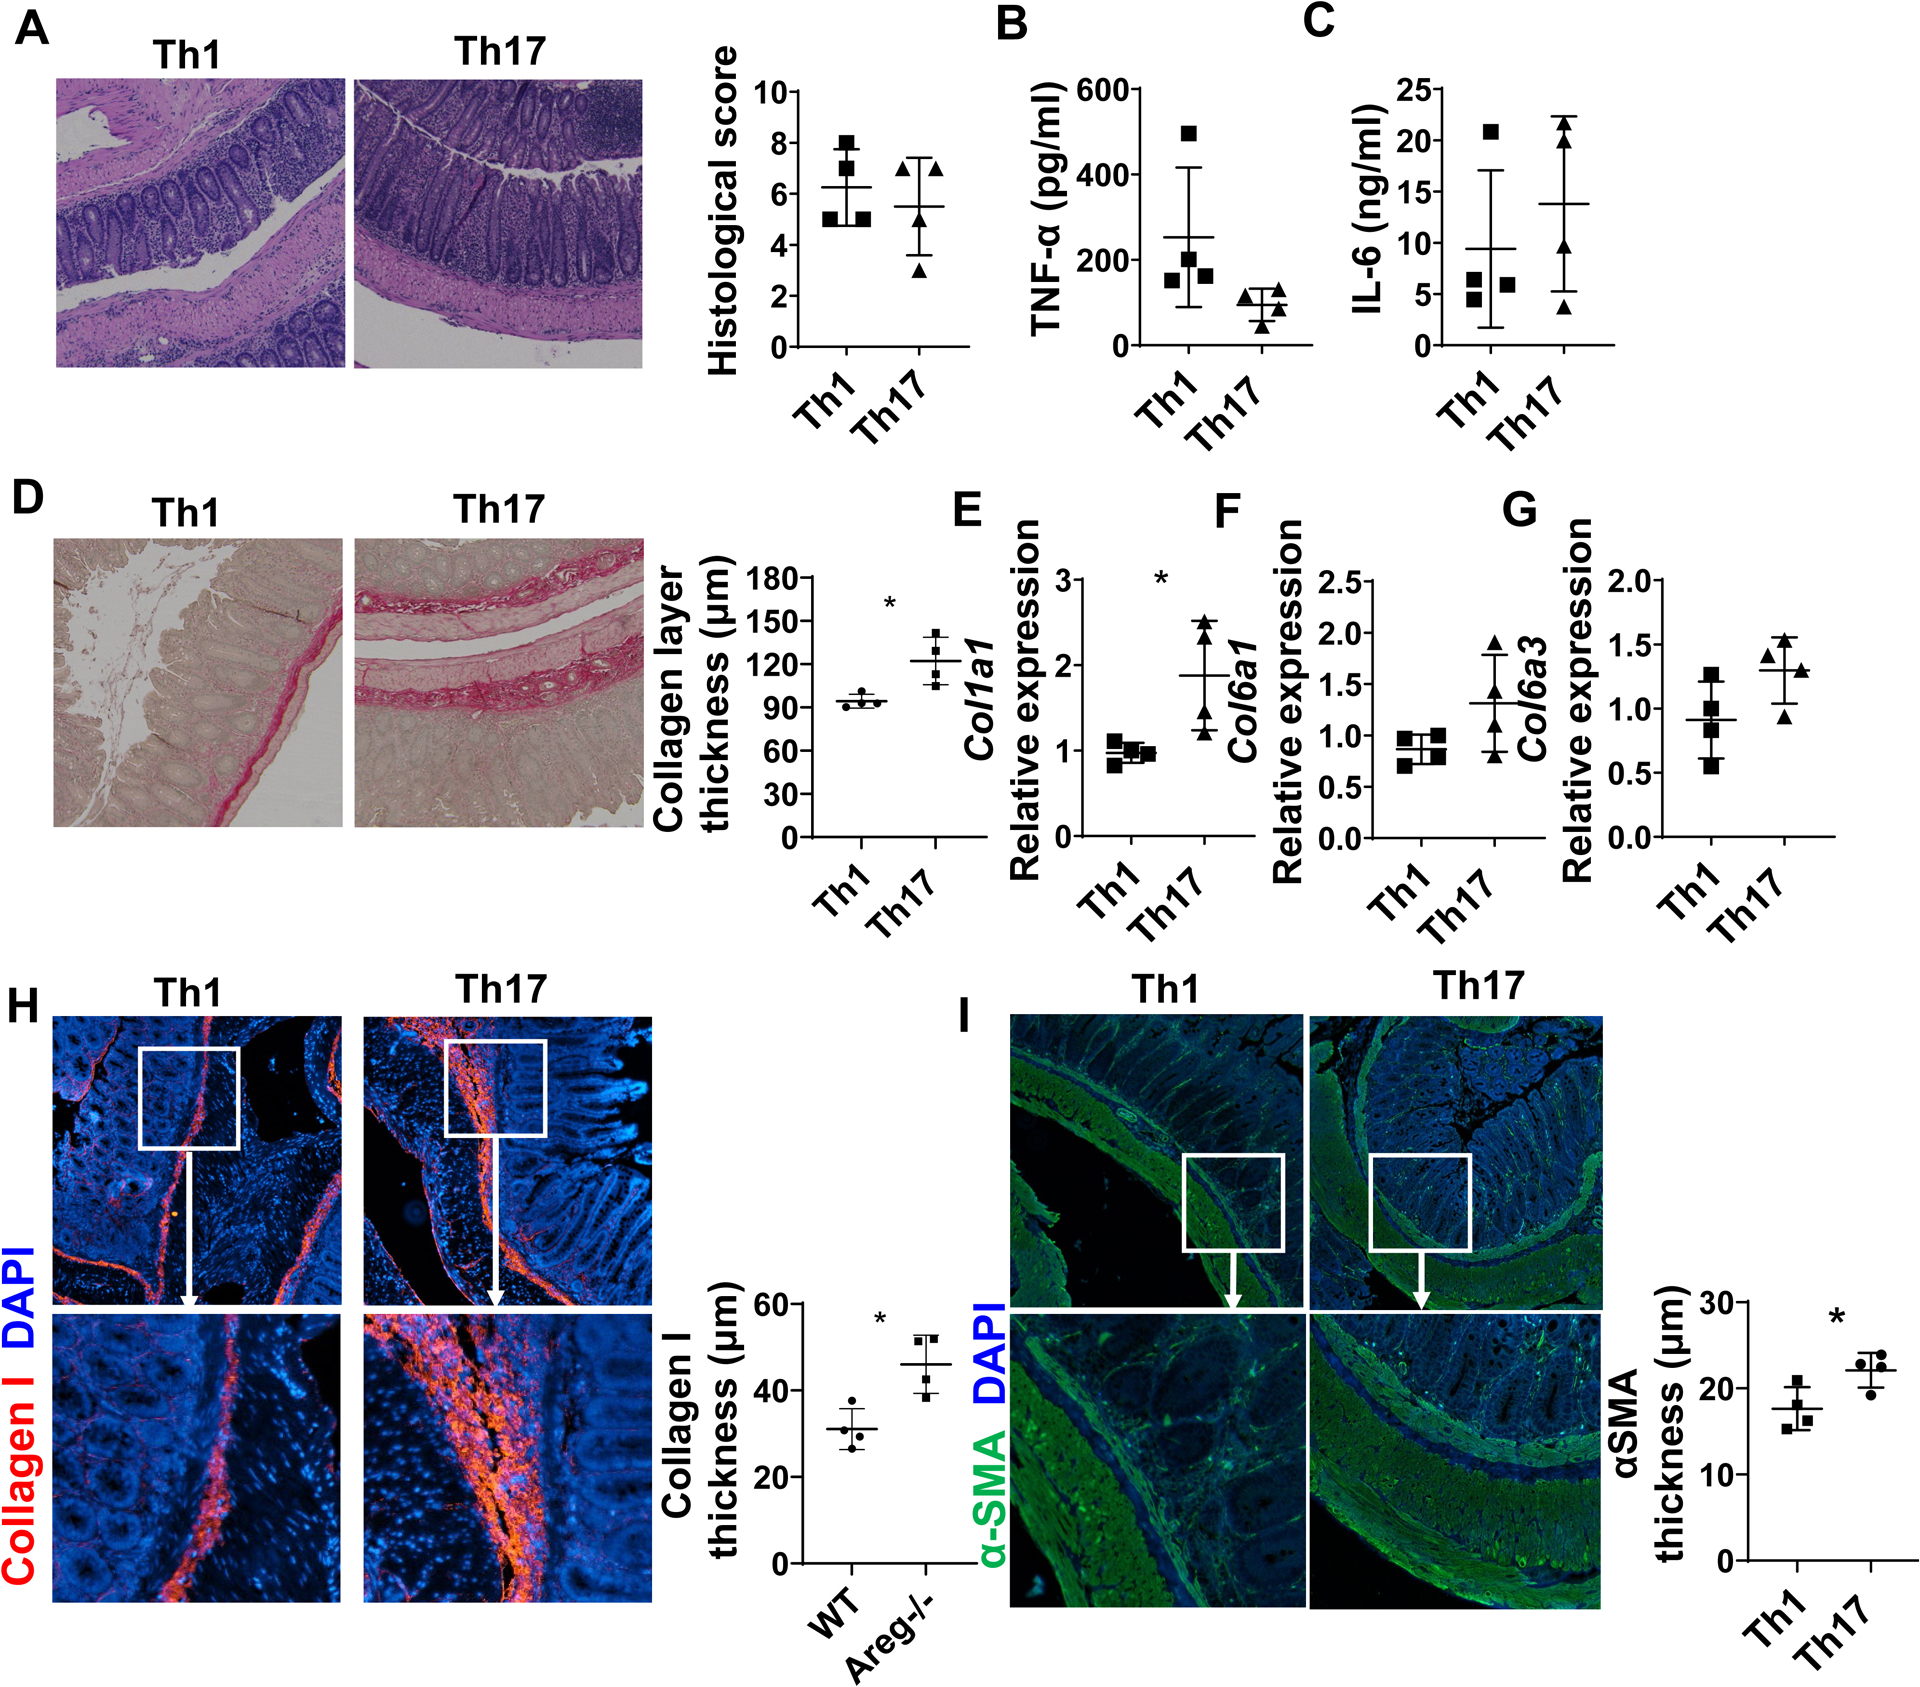
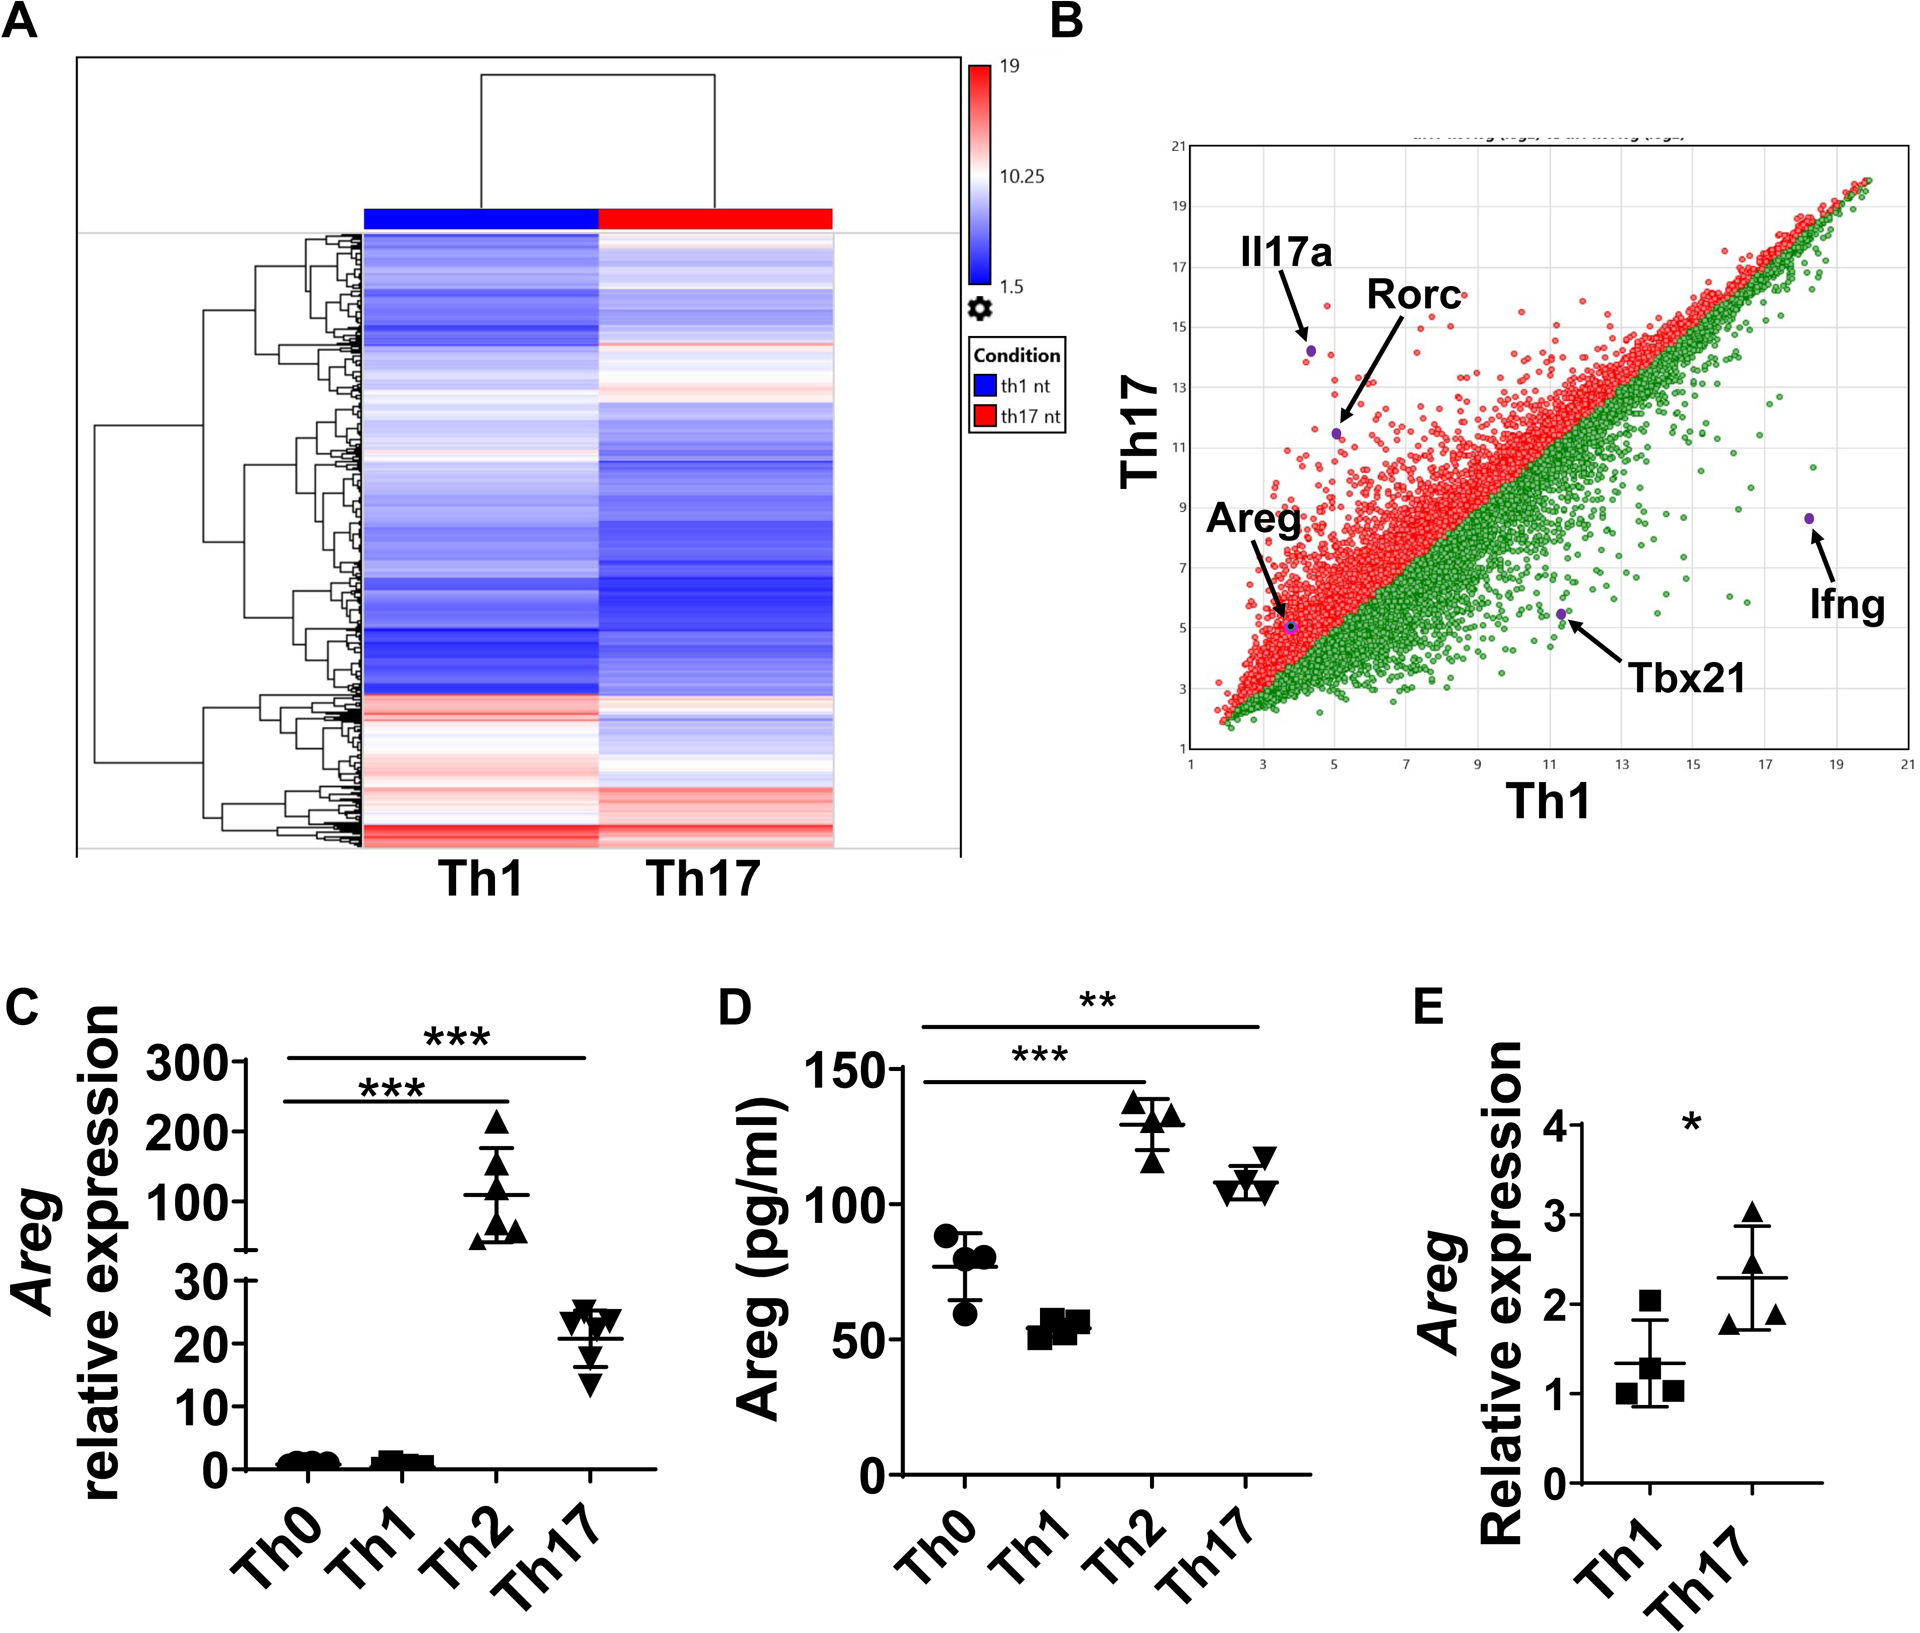
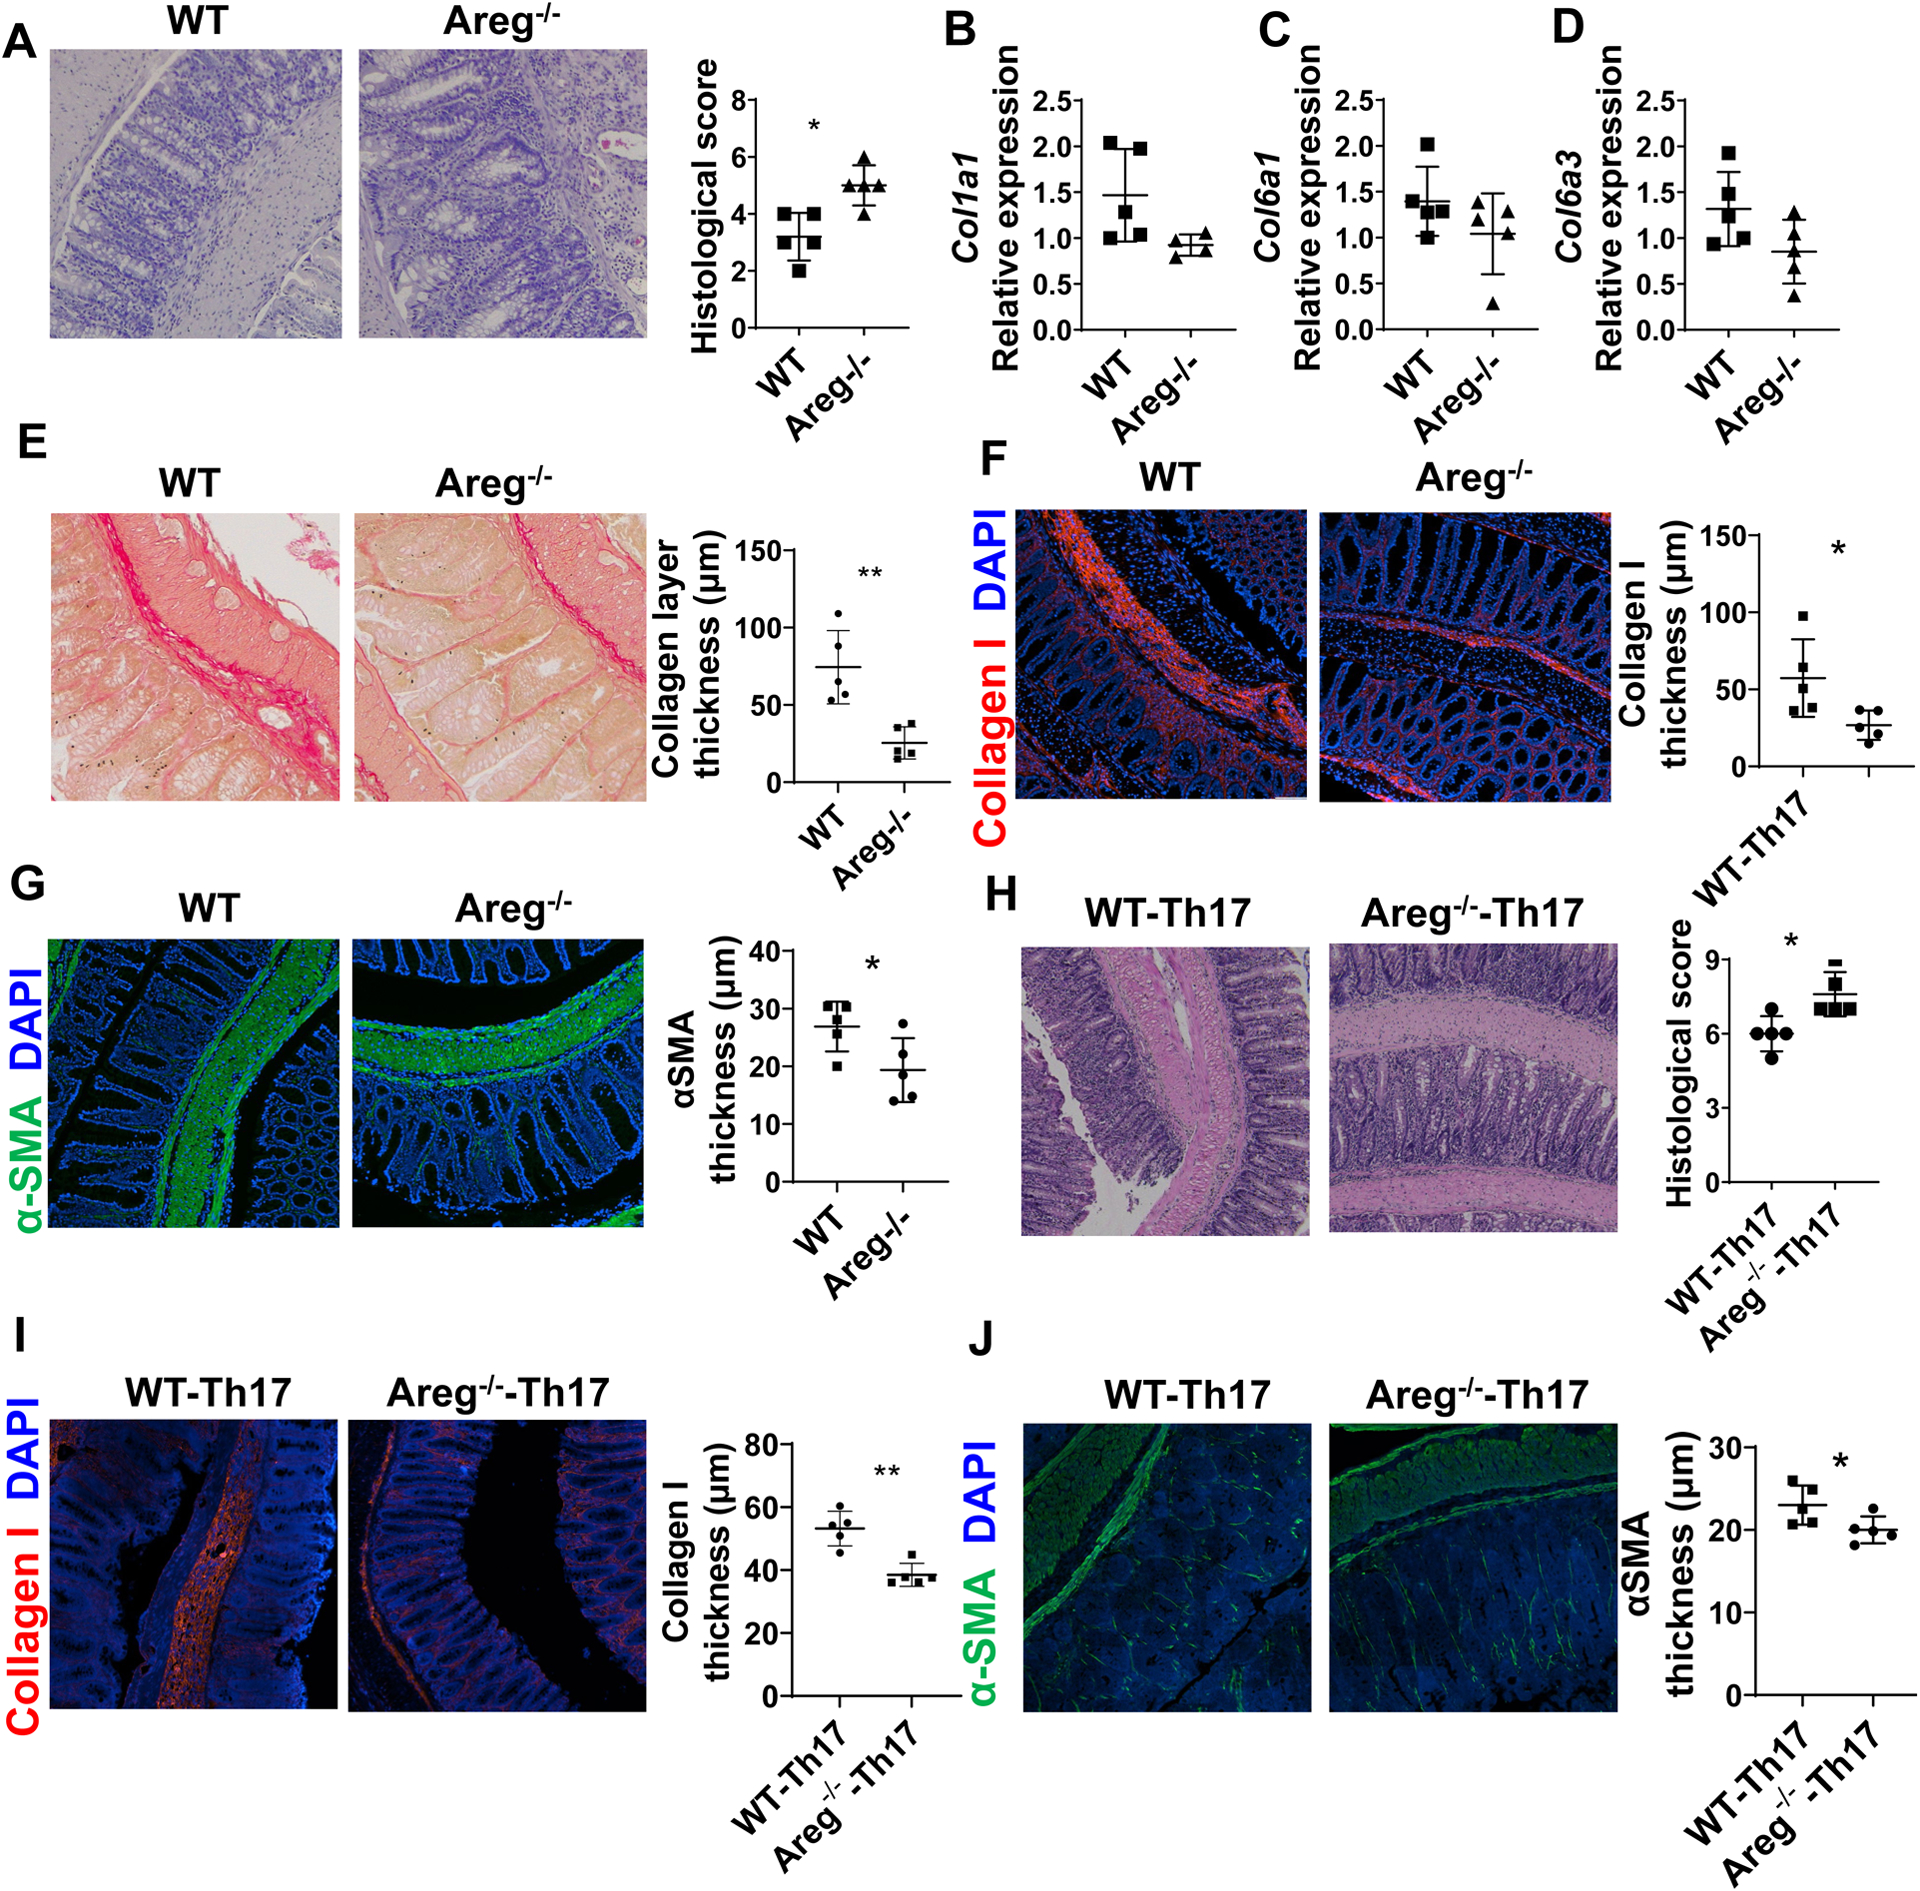
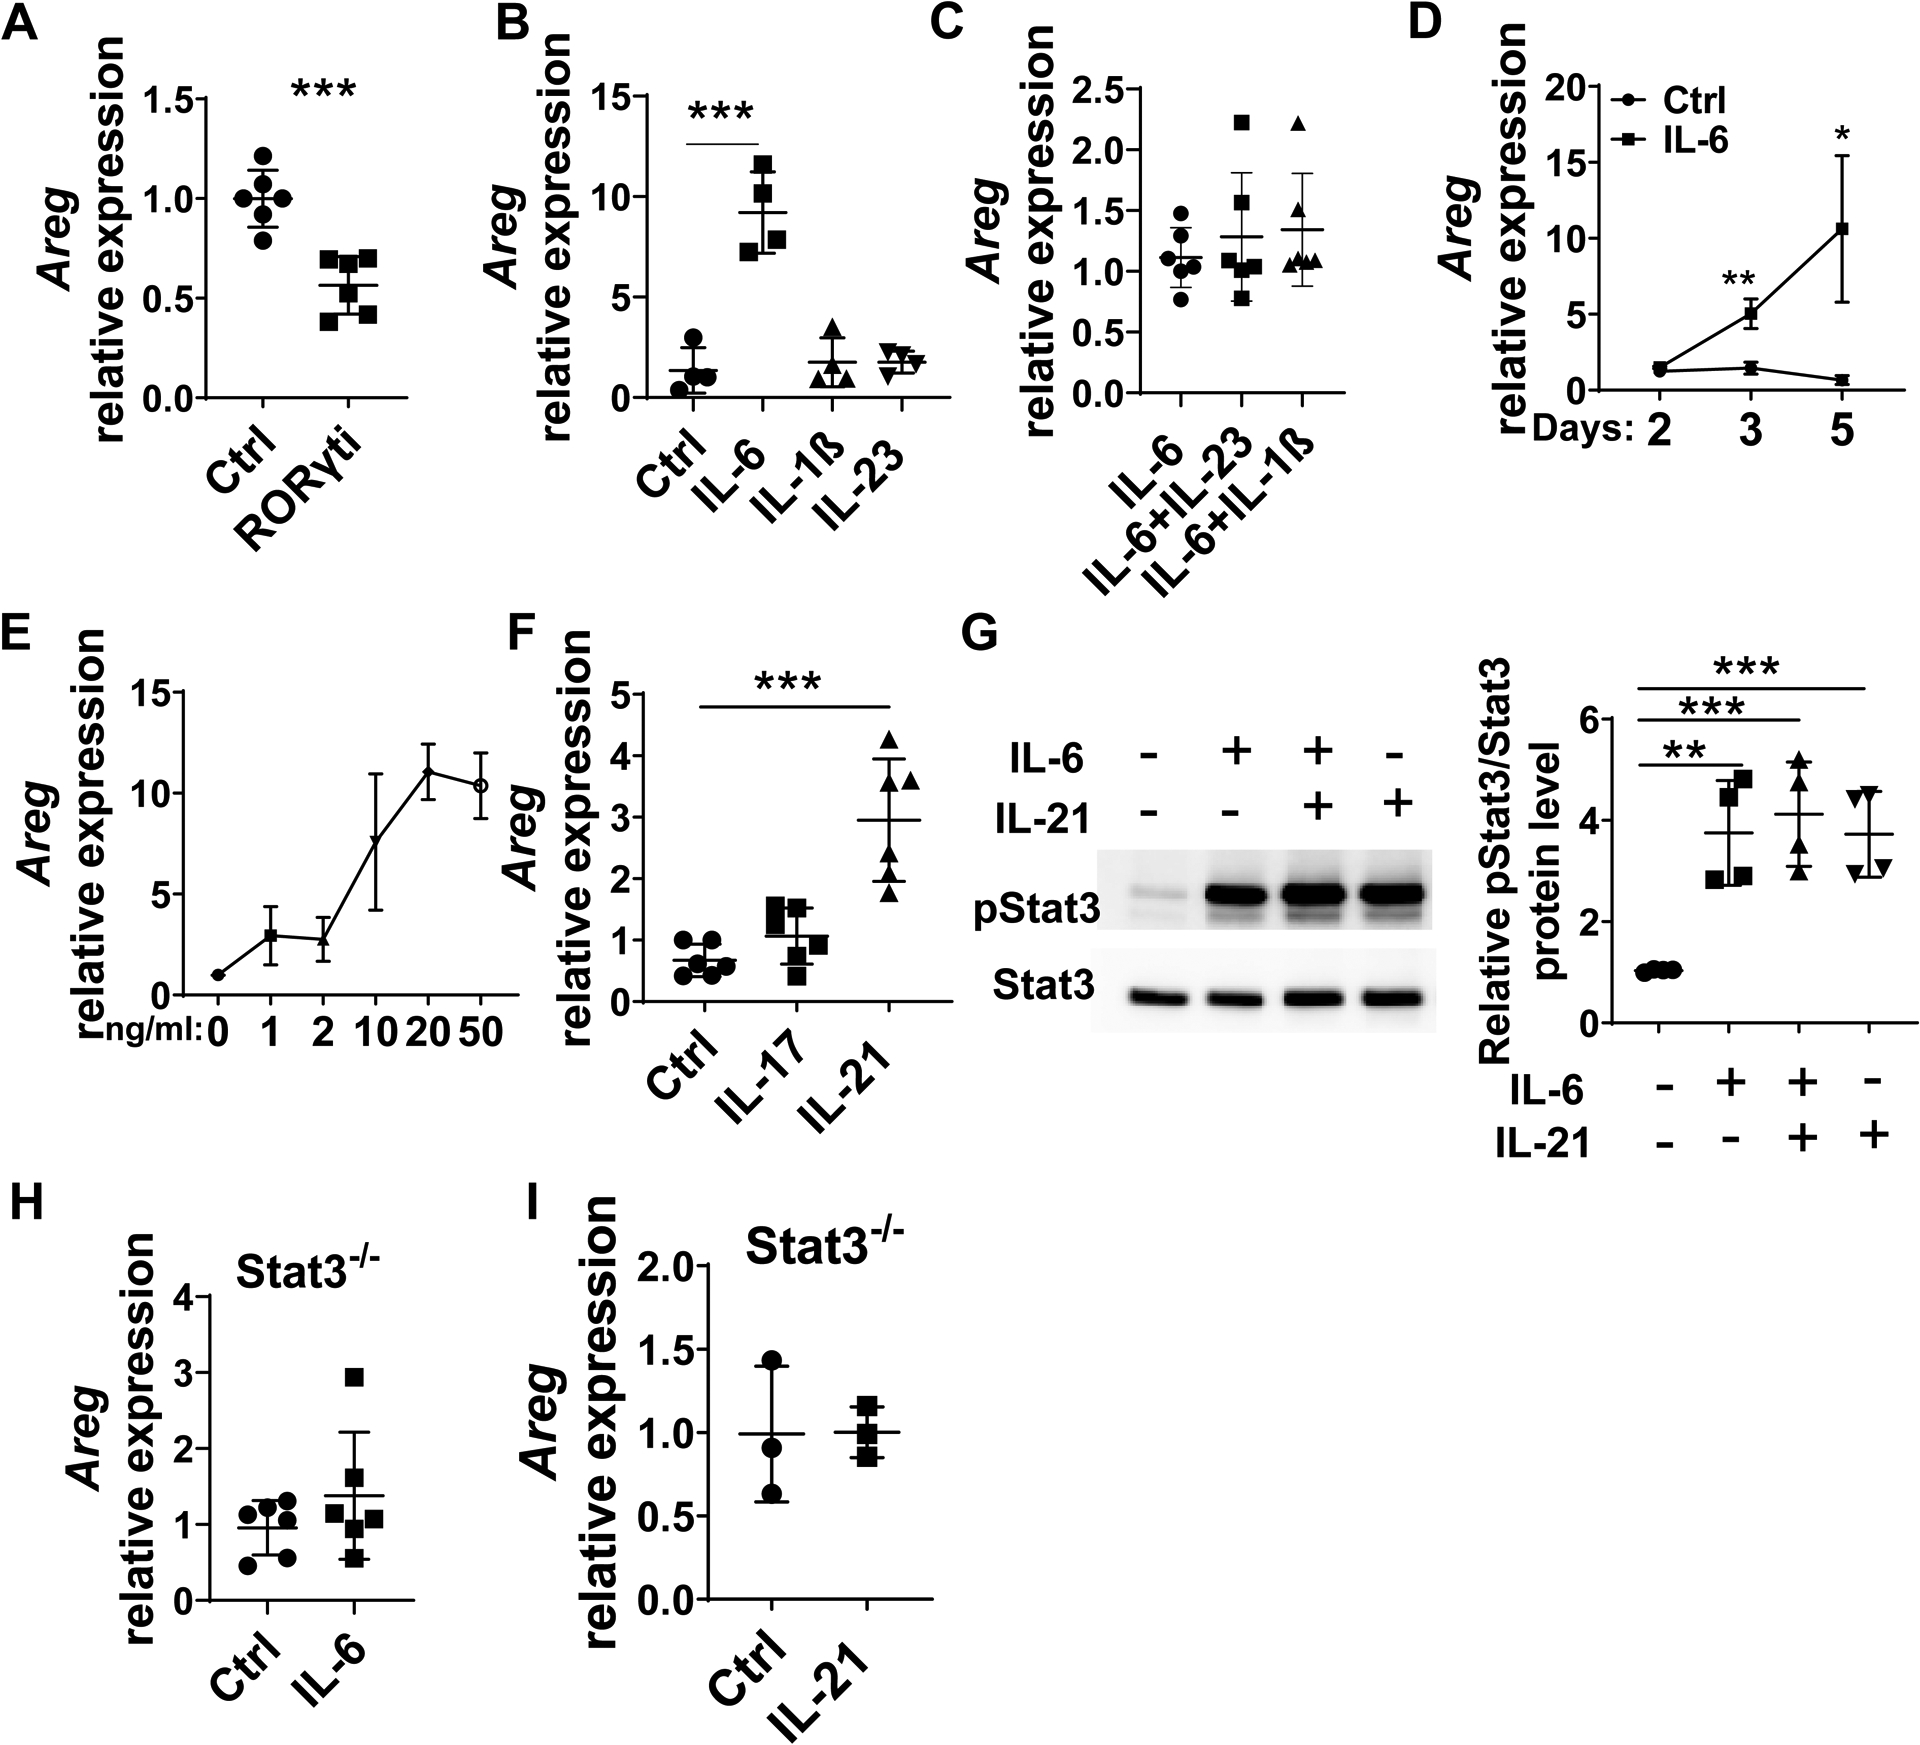
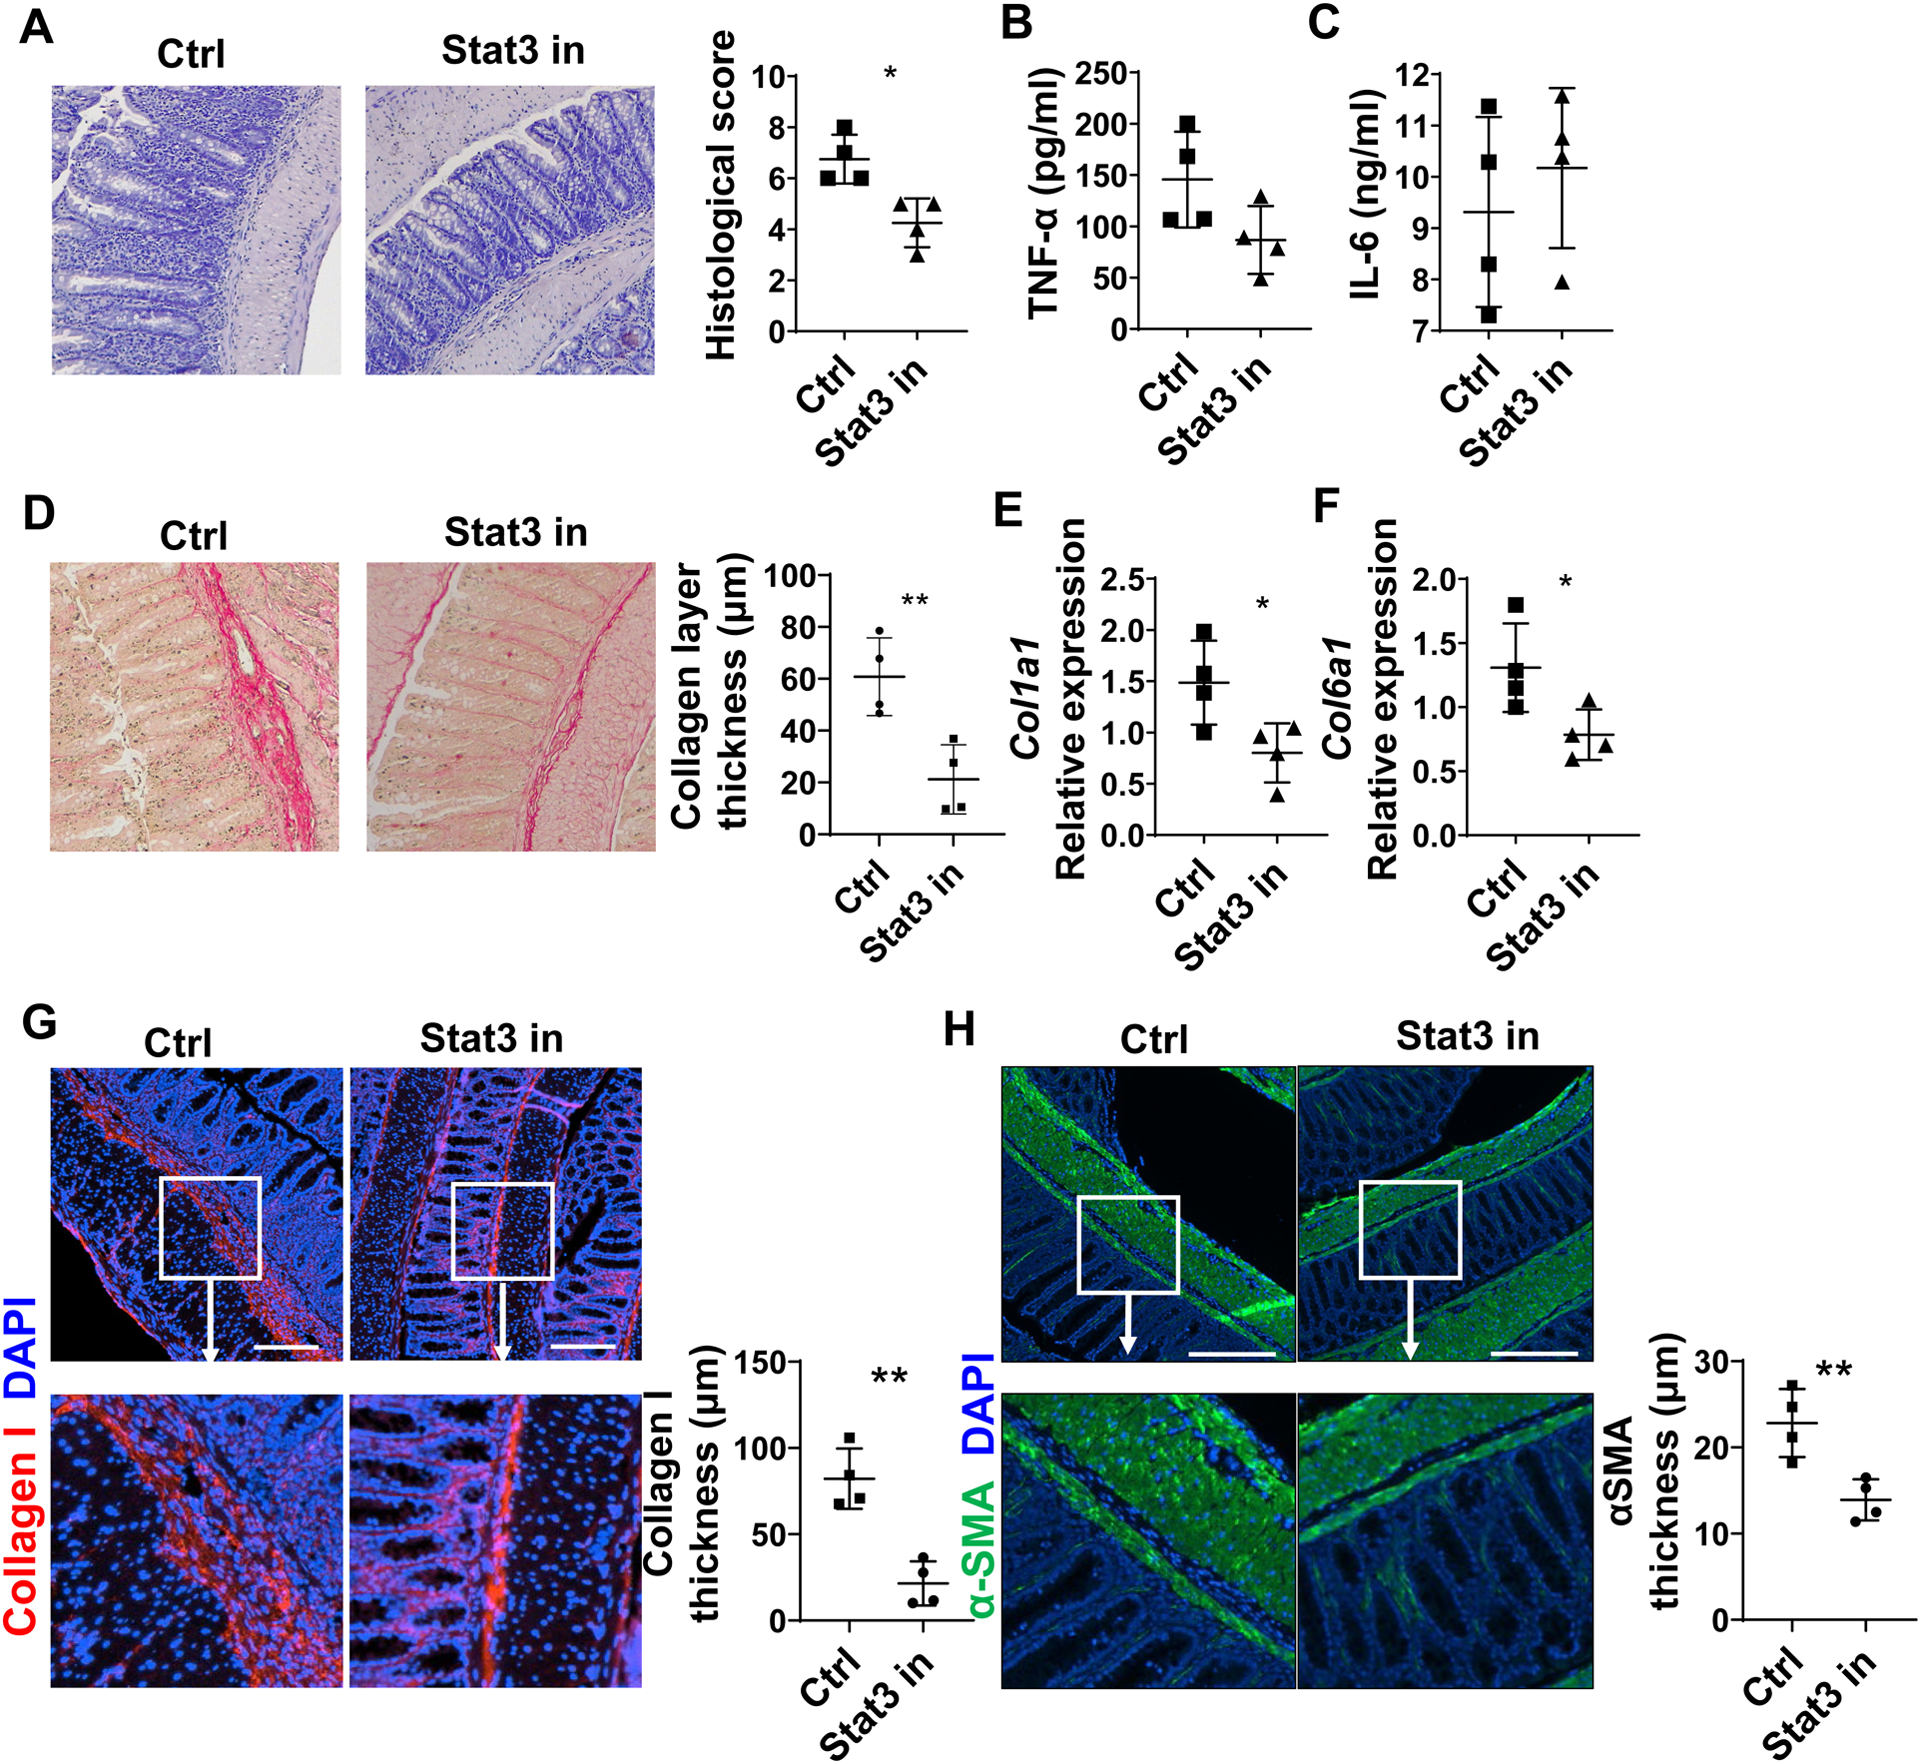
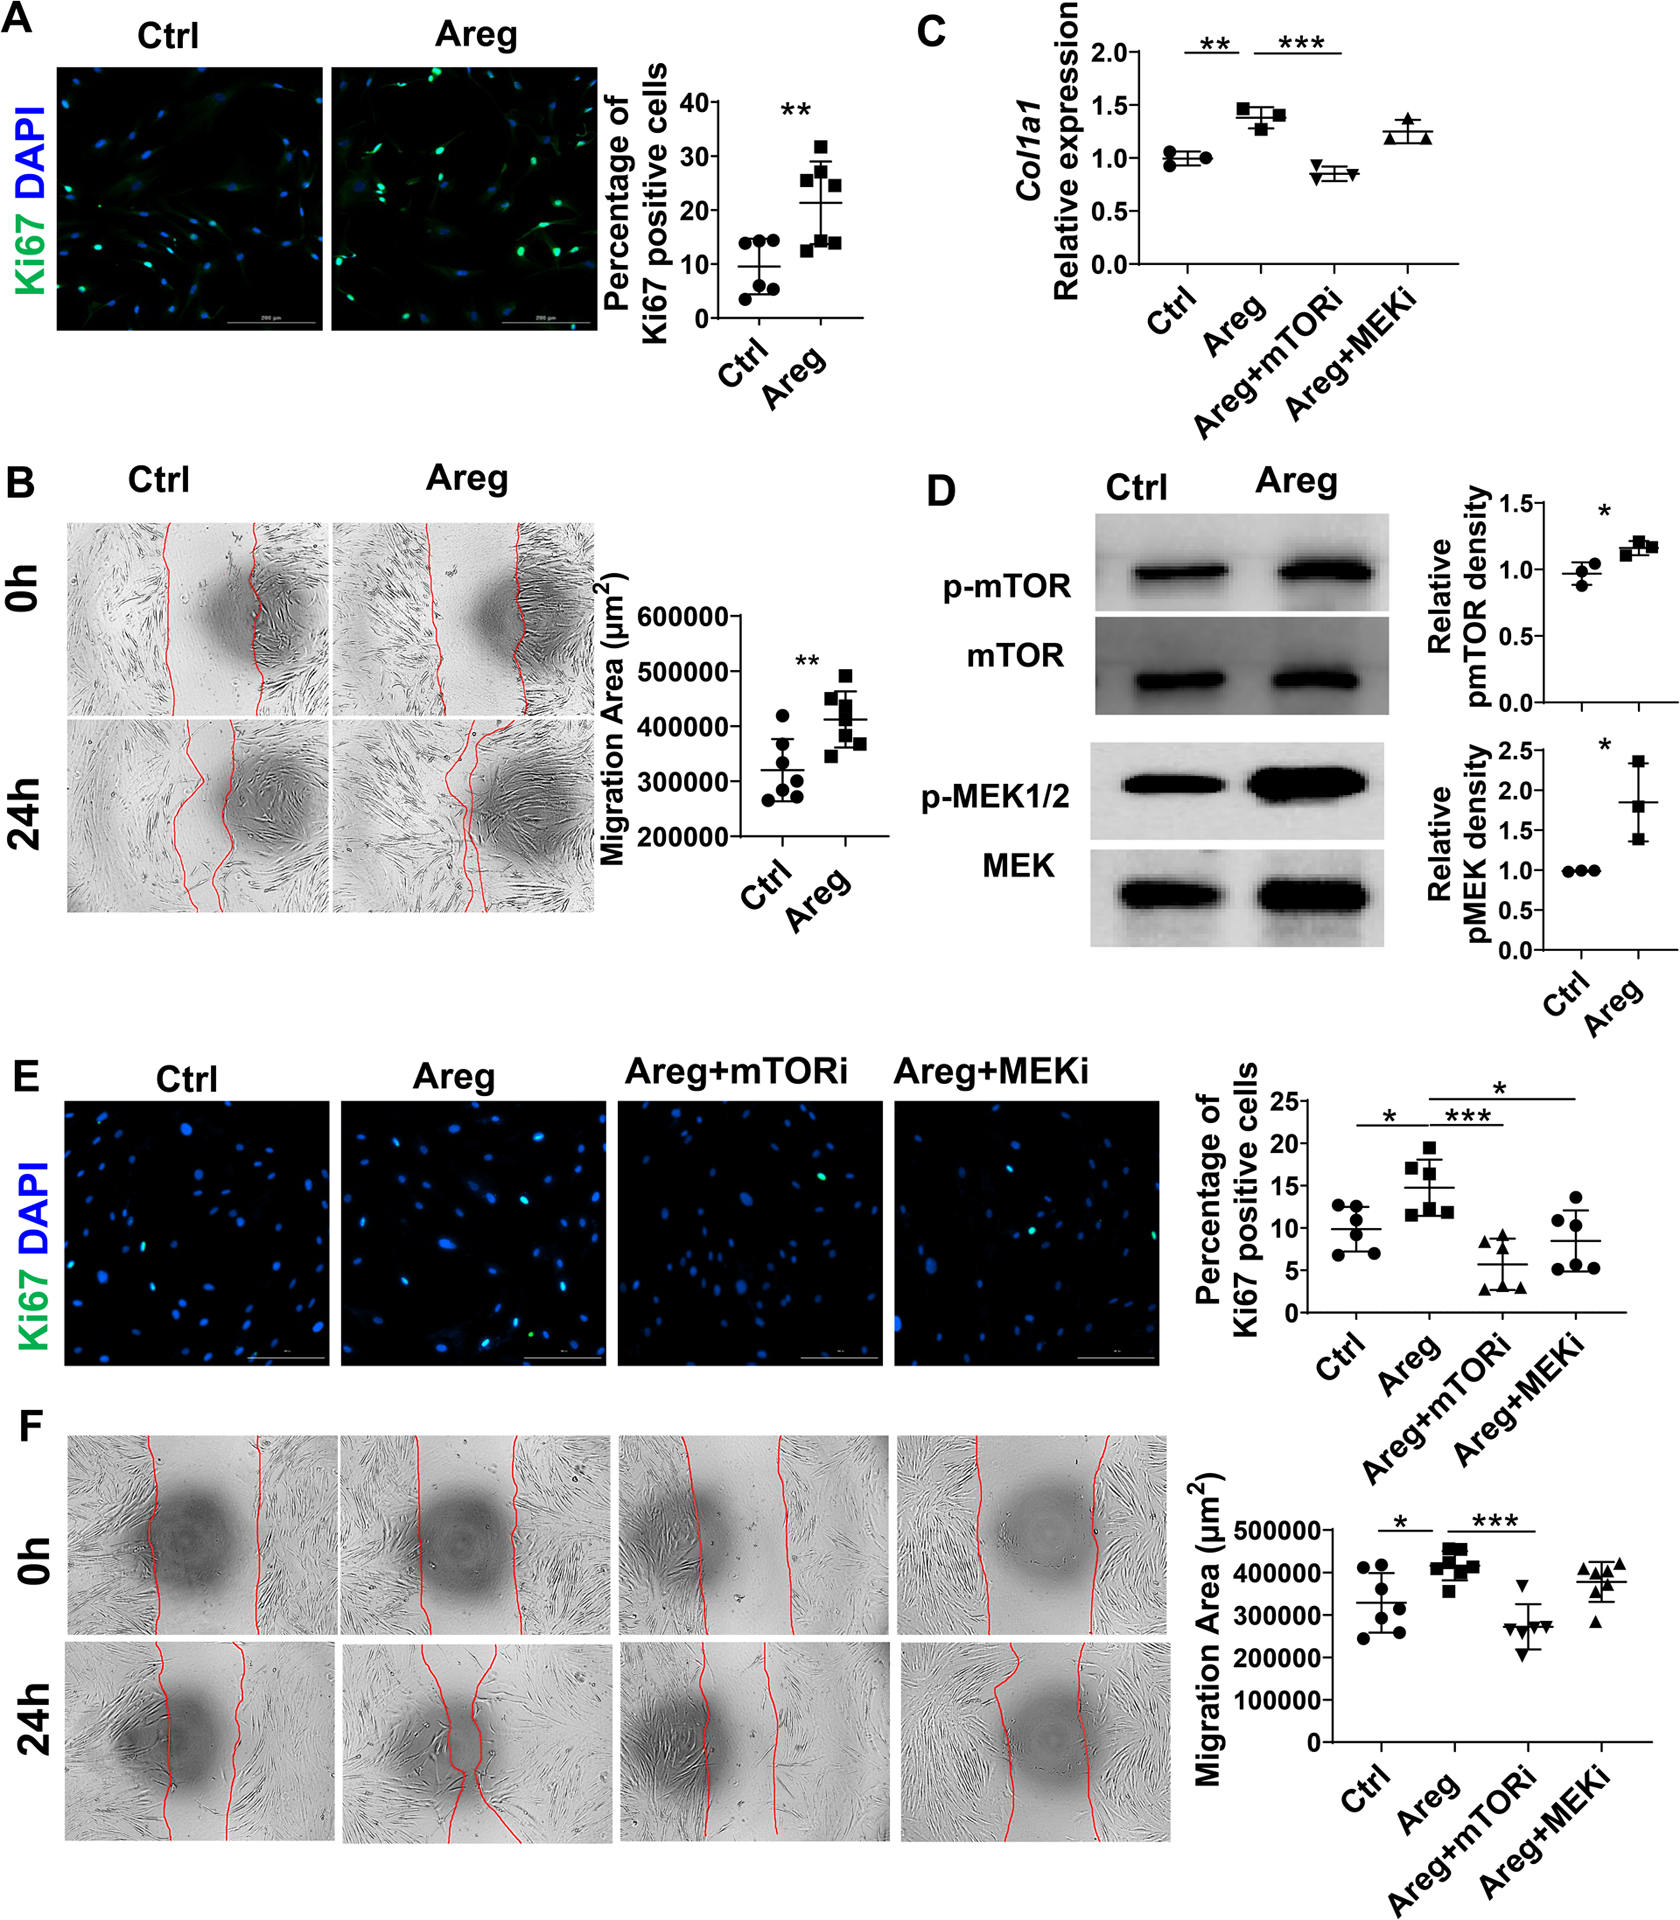
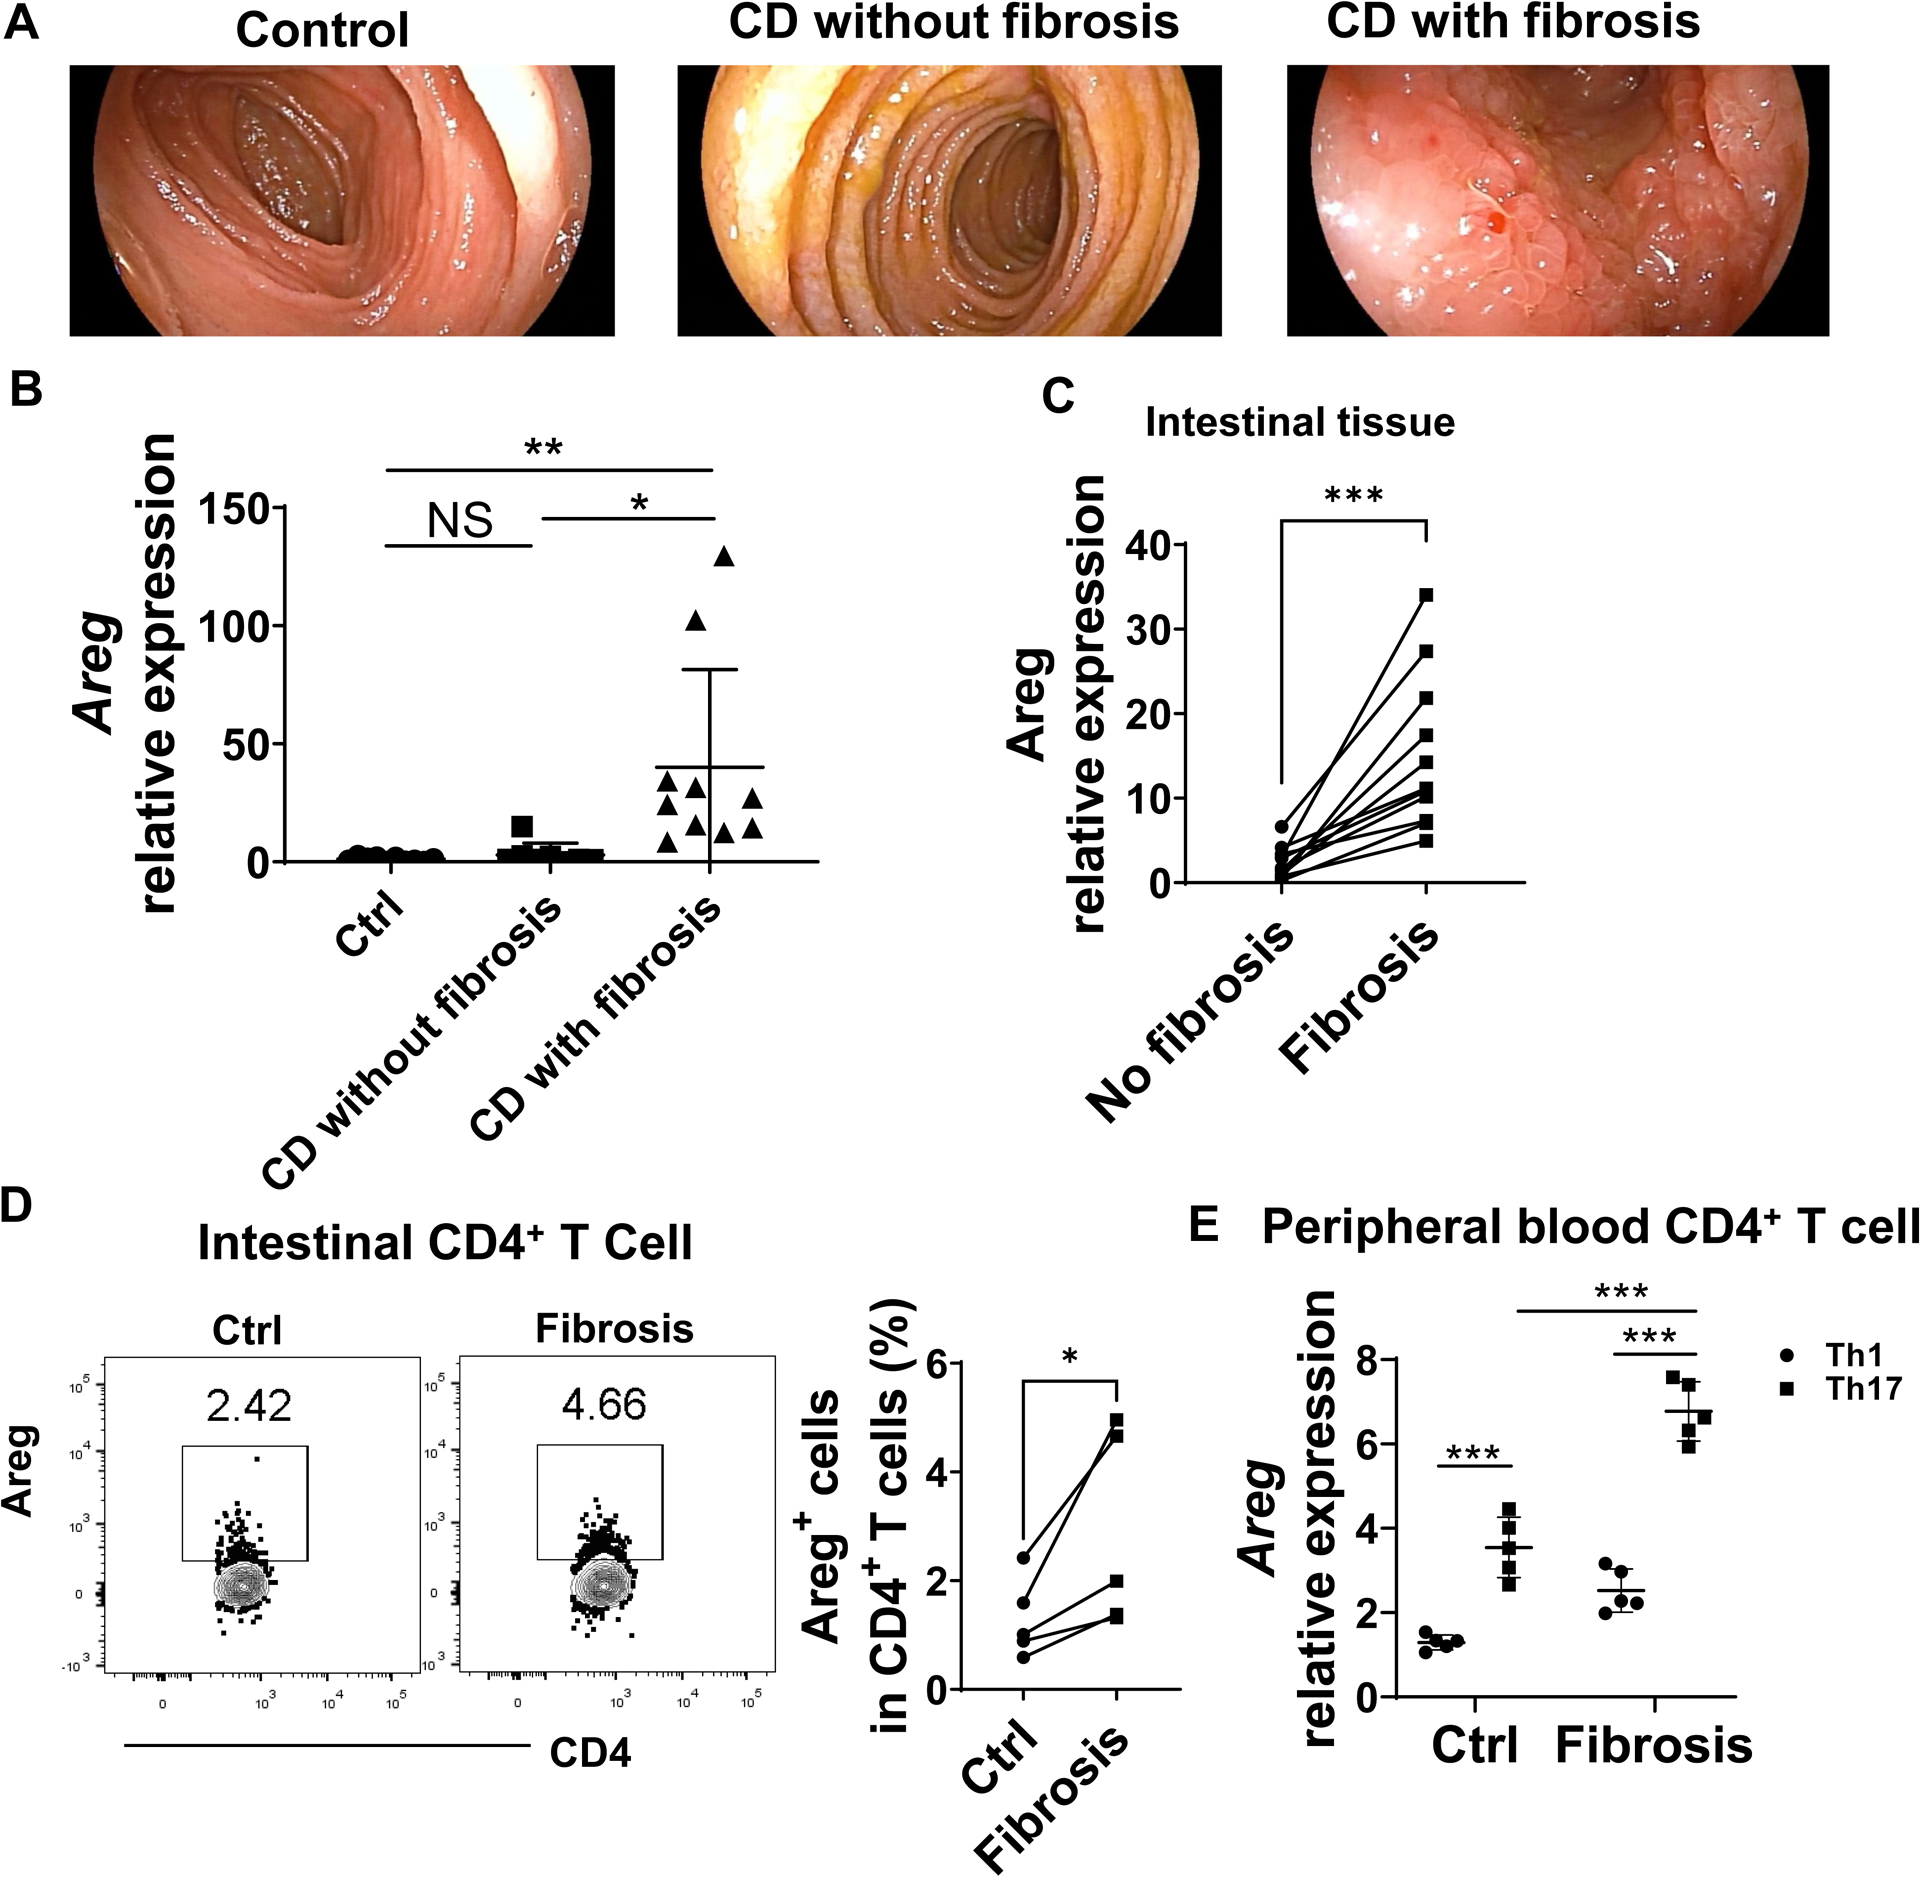
Results: Although Th1 and Th17 cells induced intestinal inflammation at similar levels when transferred into Tcrβxδ-/- mice, Th17 cells induced more severe intestinal fibrosis. Th17 cells expressed higher levels of AREG than Th1 cells. Areg-/- mice developed less severe intestinal fibrosis compared with WT mice on DSS insults. Transfer of Areg-/- Th17 cells induced less severe fibrosis in Tcrβxδ-/- mice compared with WT Th17 cells. Interleukin (IL)6 and IL21 promoted AREG expression in Th17 cells by activating Stat3. Stat3 inhibitor suppressed Th17-induced intestinal fibrosis. AREG promoted human intestinal myofibroblast proliferation, motility, and collagen I expression, which was mediated by activating mammalian target of rapamycin and MEK. AREG expression was increased in intestinal CD4+ T cells in fibrotic sites compared with nonfibrotic sites from patients with CD.

Conclusions: These findings reveal that Th17-derived AREG promotes intestinal fibrotic responses in experimental colitis and human patients with CD. Thereby, AREG might serve as a potential therapeutic target for fibrosis in CD.

Keywords: Effector CD4(+)T Cells; Inflammatory Bowel Diseases; Intestinal Inflammation; Intestinal Myofibroblasts.


Conflict of interest statement

Disclosures: No authors have conflicting financial, professional, or personal interests.

Figures

Figure 1.
Figure 1.. Th17 cells induce more severe intestinal fibrosis in Tcrβxδ−/− mice.
CD4+T cells were isolated from CBir1 TCR transgenic (CBir1 Tg) mice and cultured under Th1 and Th17 conditions and then transferred into Tcrβxδ−/− mice (n=4/group). The mice were sacrificed 6 weeks after cell transfer. (A) Disease severity was measured by histopathology. (B-C) TNF-α (B) and IL-6 (C) levels in supernatants of colonic organ cultures were measured by ELISA. (D) Colon tissues were stained with Sirius Red, and collagen layer thickness were measured. (E-G) Col1a1, Col6a1, and Col6a3 levels in colonic tissues were measured by RT-PCR. (H-I) Colon tissues were stained with immunofluorescence. Collagen I thickness and αSMA layer thickness were analyzed. Representative data from 3 independent experiments. (A) Mann–Whitney U test; (B-I) unpaired Student’s t-test. *p < .05.
Figure 2.
Figure 2.. Th17 cells produce high levels of Areg.
(A-B) WT spleen CD4+T cells were activated with α-CD3 and α-CD28 mAb under Th1 and Th17-polarization conditions for 24h for analysis of gene differences by microarray analysis. (A) The expression of different genes is shown in the heatmap. (B) Scatterplot displaying the log2 fold change in expression between the two groups. (C-D) Splenic CD4+T cells of CBir1 Tg mice were cultured with irradiated APCs and CBir1 peptide under neutral, Th1, Th2, and Th17 polarization conditions for 5 days. Areg expression was detected by qRT-PCR (C). Areg production was determined by ELISA (D). (E) Intestinal Areg expression in CBir1 Tg Th1-recipient mice and Th17-recipient mice was determined by qRT-PCR. Representative data from 3 independent experiments. (C-D) One-way ANOVA; (E) unpaired Student’s t-test. *p < .05; **p < .01; ***p < .001; ****p < .0001.
Figure 3.
Figure 3.. The deficiency of Areg induces less severe intestinal fibrosis.
(A-G) WT mice and Areg−/− mice (n=5/group) were administered with 3 cycles of DSS insults. In each cycle, mice were given 2.0% DSS (w/v) in drinking water for 7 days and control drinking water for 7 days. (A) Colitis severity was measured by histopathology and pathological scores. (B-D) Col1a1, Col6a1, and Col6a3 levels in colonic tissues were measured by RT-PCR. (E-G) Colon tissues were stained with (E) Sirius Red and (F-G) immunofluorescence. Collagen layer thickness, Collagen I thickness, and αSMA layer thickness were analyzed. (H-J) WT and Areg−/− T cells were cultured under Th17 conditions for 5 days and then transferred into Tcrβxδ−/− mice (n=5/group). The mice were sacrificed 4 weeks later. (H) Colitis severity was measured by histopathology and pathological scores. (I-J) Intestinal fibrosis was determined by Collagen I staining (I) and αSMA staining (J). Representative data from 2 independent experiments with similar results. (A and H) Mann–Whitney U test; (B-G and I-J) unpaired Student’s t-test. *p < .05; **p < .01.
Figure 4.
Figure 4.. IL-6 and IL-21 promote Areg expression through activation of Stat3 in CD4+ T cells.
(A) CD4+T cells were cultured under Th17-polarization conditions with or without the RORγt inhibitor. Areg expression was detected by qRT-PCR. (B) CD4+T cells were cultured with or without 10 ng/ml IL-6, 10 ng/ml IL-23, or 10 ng/ml IL-1β for 5 days. Areg expression was detected by qRT-PCR. (C) CD4+T cells were cultured with IL-6 alone or together with IL-23 and IL-1β for 5 days. Areg expression was detected by RT-PCR. (D) CD4+T cells were cultured with 10 ng/ml IL-6 for indicated days. Areg expression was detected by qRT-PCR. (E) CD4+T cells were cultured with IL-6 at indicated dose for 5 days. Areg expression was detected by qRT-PCR. (F) CD4+T cells were cultured in the presence of IL-17 or IL-21 for 5 days. Areg expression was detected by qRT-PCR. (G) CD4+T cells were cultured with or without IL-6 and IL-21 for 5 minutes. Phosphorylated Stat3 and total Stat3 were detected by western blot. (H-I) CD4+T cells were isolated from Stat3−/− mice and treated with IL-6 or IL-21 for 5 days. Areg expression was detected by qRT-PCR. Representative data from 2–3 independent experiments with similar results. (A, D, H, and I) Unpaired Student’s t-test; (B, C, F, and G) one-way ANOVA. *p < .05; **p < .01; ***p < .001.
Figure 5.
Figure 5.. Stat3 inhibitor attenuates intestinal fibrosis induced by Th17 cells.
CBir1 Th17 cell were transferred into Tcrβxδ−/− mice (n=4/group). Mice were injected with or without Stat3 inhibitor (10 mg/kg, HJC0152) every other day starting from the day of cell transfer. (A) Disease severity was measured by histopathology and pathological scores. (B) TNF-α and (C) IL-6 levels in supernatants of colonic organ cultures were measured by ELISA. (D) Colon tissues were stained with Sirius Red, and Collagen layer thickness were analyzed. (E-F) Col1a1 and Col6a1 levels in colonic tissues were measured by RT-PCR. (G-H) Colon tissues were stained with immunofluorescence. Collagen I thickness (G) and αSMA layer thickness (H) were measured. Representative data from 2 independent experiments with similar results. (A) Mann–Whitney U test; (B-H) unpaired Student’s t-test. *p < .05; **p < .01.
Figure 6.
Figure 6.. Areg promotes human intestinal myofibroblast proliferation and motility through activation of mTOR and MEK.
(A) Intestinal MFs isolated from CD patients were treated with or without 100 ng/ml Areg for 48h, and Ki67+ cells were analyzed by immunofluorescence. (B) Human intestinal MFs were wounded and treated with the 100 ng/ml Areg. Images were recorded with Biotek Cytation 5. (C) Human intestinal MFs were treated with or without the 100 ng/ml Areg in the presence or absence of Rapamycin or U0126 for 48h, and Col1a1 expression was determined by qRT-PCR. (D) Intestinal MFs were treated with Areg for 48h, and phosphorylation of mTOR and MEK was determined by western blot. (E) Human intestinal MFs were treated with or without 100 ng/ml Areg in the presence or absence of Rapamycin (mTOR inhibitor) or U0126 (MEK inhibitor) for 48h, and Ki67+ cells were analyzed by immunofluorescence. (F) Human intestinal MFs were wounded and treated with or without the 100 ng/ml Areg in the presence or absence of Rapamycin or U0126, and images were recorded by Biotek Cytation 5. Representative data from 2–3 independent experiments with similar results. (A-B, and D) Unpaired Student’s t-test; (C, and E-F) one-way ANOVA. *p < .05; **p < .01; ***p < .001; ****p < .0001.
Figure 7.
Figure 7.. Areg expression is increased in CD patients with fibrosis.
(A) Endoscopic images of the intestinal tract of healthy control, CD patients with or without intestinal fibrosis. (B) Intestinal biopsies were taken from healthy controls (Control, n=10), CD patients without fibrosis (n=8), and CD patients with fibrosis (n=10). The expression of Areg in intestinal biopsies was measured by qRT-PCR. (C) Areg expression in non-fibrotic (Ctrl) and fibrotic sites from the same CD patients (n=11) was determined by qRT-PCR. (D) Intestinal lamina propria lymphocytes were isolated from fibrotic and non-fibrotic sites of the same CD patients (n=5). Areg+ CD4+ T cells were determined by flow cytometry. (E) Peripheral blood CD4+ T cells were isolated from healthy controls (n=5) and CD patients with intestinal fibrosis (n=5) and then cultured under Th1 or Th17 conditions. Areg expression in T cells was measured by qRT-PCR. (B) One-way ANOVA; paired Student’s t-test(C-D); unpaired Student’s t-test (E). *p < .05; ***p < 0.001.

Comment in

References

    1. Cosnes J, Gower-Rousseau C, Seksik P, et al. Epidemiology and natural history of inflammatory bowel diseases. Gastroenterology 2011;140(6): 1785–94. - PubMed
    1. Rieder F Managing Intestinal Fibrosis in Patients With Inflammatory Bowel Disease. Gastroenterol Hepatol (N Y) 2018;14(2): 120–122. - PMC - PubMed
    1. Peyrin-Biroulet L, Harmsen WS, Tremaine WJ, et al. Surgery in a population-based cohort of Crohn’s disease from Olmsted County, Minnesota (1970–2004). Am J Gastroenterol 2012;107(11): 1693–701. - PMC - PubMed
    1. Rieder F, Fiocchi C. Intestinal fibrosis in inflammatory bowel disease – Current knowledge and future perspectives. J Crohns Colitis 2008;2(4): 279–90. - PubMed
    1. Torle J, Dabir PD, Korsgaard U, et al. Levels of Intestinal Inflammation and Fibrosis in Resection Specimens after Preoperative Anti-Tumor Necrosis Factor Alpha Treatment in Patients with Crohn’s Disease: A Comparative Pilot Study. Surg Res Pract 2020;2020(6085678. - PMC - PubMed

Publication types