. 2022 Sep;10(9):e005551.
doi: 10.1136/jitc-2022-005551.

HSP90α induces immunosuppressive myeloid cells in melanoma via TLR4 signaling

Affiliations

HSP90α induces immunosuppressive myeloid cells in melanoma via TLR4 signaling

Ihor Arkhypov et al. J Immunother Cancer. 2022 Sep.

Abstract

Background: Tumor cells modulate host immunity by secreting extracellular vesicles (EV) and soluble factors. Their interactions with myeloid cells lead to the generation of myeloid-derived suppressor cells (MDSC), which inhibit the antitumor function of T and NK cells. We demonstrated previously that EV derived from mouse and human melanoma cells induced immunosuppressive activity via increased expression of programmed cell death ligand 1 (PD-L1) on myeloid cells that was dependent on the heat-shock protein 90α (HSP90α) in EV. Here, we investigated whether soluble HSP90α could convert monocytes into MDSC.

Methods: CD14 monocytes were isolated from the peripheral blood of healthy donors, incubated with human recombinant HSP90α (rHSP90α) alone or in the presence of inhibitors of TLR4 signaling and analyzed by flow cytometry. Inhibition of T cell proliferation assay was applied to assess the immunosuppressive function of rHSP90α-treated monocytes. HSP90α levels were measured by ELISA in plasma of patients with advanced melanoma and correlated with clinical outcome.

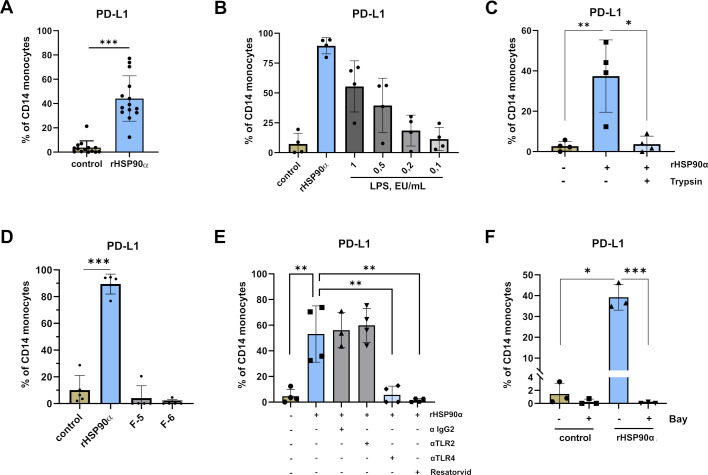
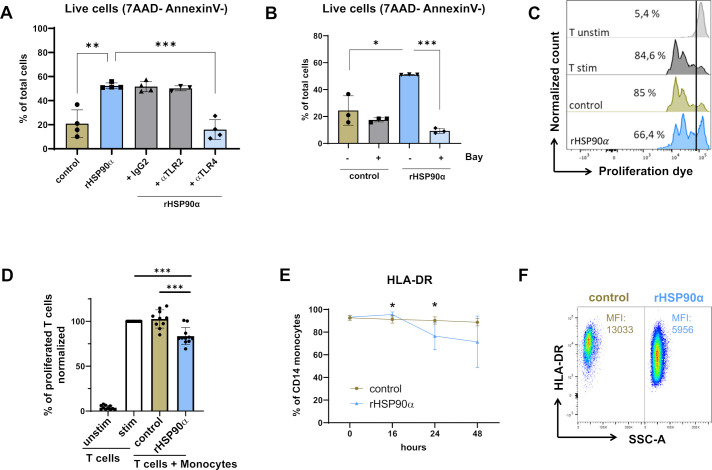
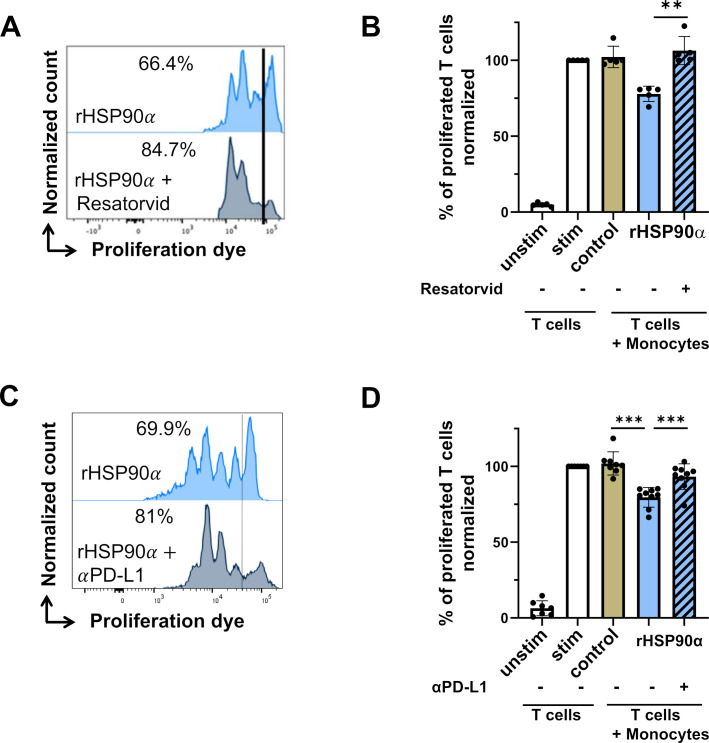
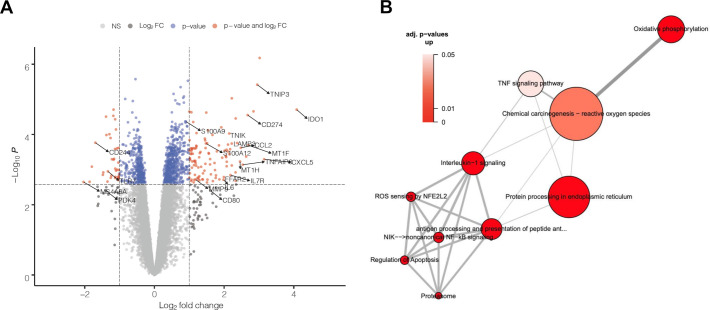
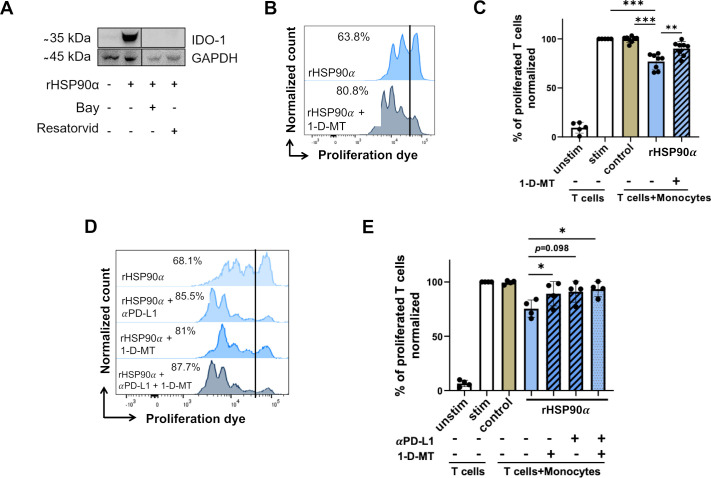
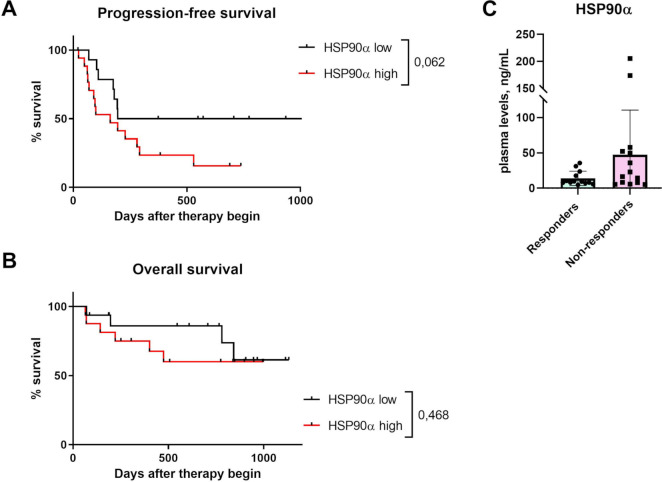
Results: We found that the incubation of monocytes with rHSP90α resulted in a strong upregulation of PD-L1 expression, whereas reactive oxygen species (ROS) and nitric oxide (NO) production as well as the expression of arginase-1, ectoenzymes CD39 and CD73 remained unchanged. The PD-L1 upregulation was blocked by anti-TLR4 antibodies and a nuclear factor-κB inhibitor. rHSP90α-treated monocytes displayed the downregulation of HLA-DR expression and acquired the resistance to apoptosis. Moreover, these monocytes were converted into MDSC as indicated by their capacity to inhibit T cell proliferation, which was mediated by TLR4 signaling as well as PD-L1 and indoleamine 2,3-dioxygenase (IDO) 1 expression. Higher levels of HSP90α in plasma of patients with melanoma correlated with augmented PD-L1 expression on circulating monocytic (M)-MDSC. Patients with melanoma with high levels of HSP90α displayed shorter progression-free survival (PFS) on the treatment with immune checkpoint inhibitors (ICIs).

Conclusion: Our findings demonstrated that soluble rHSP90α increased the resistance of normal human monocytes to apoptosis and converted them into immunosuppressive MDSC via TLR4 signaling that stimulated PD-L1 and IDO-1 expression. Furthermore, patients with melanoma with high concentrations of HSP90α displayed increased PD-L1 expression on M-MDSC and reduced PFS after ICI therapy, suggesting HSP90α as a promising therapeutic target for overcoming immunosuppression in melanoma.

Keywords: Melanoma; Myeloid-Derived Suppressor Cells; Tumor Escape; Tumor Microenvironment.


Conflict of interest statement

Competing interests: None declared.

Figures

Figure 1
Figure 1
Induction of PD-L1 on human monocytes by rHSP90α is dependent on the TLR4-NF-κB signaling. (A) Human monocytes were treated with 2 µg/mL rHSP90α or PBS (control) for 16 hours in vitro. The expression of PD-L1 was analyzed by flow cytometry. (B) PD-L1 expression on human monocytes on treatment with lipopolysaccharide (LPS). (C) PD-L1 expression on human monocytes stimulated with trypsin-digested rHSP90α. (D) PD-L1 expression on monocytes stimulated with F-5 and F-6 subfragments of HSP90α for 16 hours. (E) Monocytes were treated with rHSP90α in the presence of anti-TLR2 (10 µg/mL) or anti-TLR4 mAbs (10 µg/mL) or the TLR4 inhibitor resatorvid (5 µM). (F) Monocytes were stimulated with rHSP90α in the presence of the NF-κB inhibitor Bay (2 µM). Results (mean±SD) are presented as the percentage of PD-L1+ monocytes among total monocytes. *p<0.05, **p<0.01, ***p<0.001. mAbs, monoclonal antibodies; NF, nuclear factor; PD-L1, programmed cell death ligand 1; rHSP90α, recombinant heat-shock protein 90α.
Figure 2
Figure 2
rHSP90α converts human monocytes into immunosuppressive MDSC. (A) Human monocytes were treated for 24 hours with PBS (control) or 2 µg/mL rHSP90α alone or in the presence of anti-TLR2 (10 µg/mL) or anti-TLR4 mAbs (10 µg/mL). Apoptosis of monocytes was measured by flow cytometry. Data are presented as the percentage of live (Annexin V7AAD) cells among total monocytes (mean±SD; n=3–4). (B) Monocytes were treated with rHSP90α alone or together with the NF-κB inhibitor Bay (2 µM). Results are presented as the percentage of live (Annexin V7AAD) cells within total monocytes (mean±SD; n=3). (C) Representative histograms for proliferated T cells cultured for 96 hours alone or together with non-treated (control) monocytes or cells treated with 2 µg/mL rHSP90α. (D) Cumulative data for T cell proliferation are presented as the percentage of divided T cells normalized (norm) to the respective control of stimulated T cells alone (mean±SD; n=11). (E) HLA-DR expression on rHSP90α-treated monocytes was shown as the percentage of HLA-DR+ cells among total monocytes (mean±SD; n=5). (F) Representative dot plot showing HLA-DR expression on CD14 monocytes treated with rHSP90α for 24 hours. Data are presented as mean fluorescence intensity (MFI). *p<0.05, **p<0.01, ***p<0.001. mAbs, monoclonal antibodies; rHSP90α, recombinant heat-shock protein 90α; PBS, phosphate-buffered saline; AAD, aminoactinomycin D; HLA-DR, human leukocyte antigen-DR isotype; SSC-A, side scatter-area.
Figure 3
Figure 3
Role of TLR4 signaling and PD-L1 expression in immunosuppressive capacity of rHSP90α-treated monocytes. (A) Representative histograms for proliferated T cells co-cultured with rHSP90α-treated monocytes with or without the TLR-4 inhibitor resatorvid (5 µM). (B) Cumulative data for T cell proliferation co-cultured with rHSP90α-treated monocytes and resatorvid. Results are presented as the percentage of divided T cells normalized (norm) to the respective control of stimulated T cells alone (mean±SD; n=5). (C) Representative histograms for proliferated T cells co-cultured with rHSP90α-treated monocytes with or without blocking anti-PD-L1 mAbs (0.5 µg/mL). (D) Cumulative data for T cell proliferation co-cultured with rHSP90α-treated monocytes and anti-PD-L1 mAbs. Data are shown as the percentage of divided T cells normalized (norm) to the respective control of stimulated T cells alone (mean±SD; n=7–9). **p<0.01, ***p<0.001. mAbs, monoclonal antibodies; PD-L1, programmed cell death ligand 1; rHSP90α, recombinant heat-shock protein 90α.
Figure 4
Figure 4
Microarray analysis of rHSP90α-treated monocytes. Transcriptome of monocytes treated for 24 hours with 2 µg/mL rHSP90α versus control (untreated) monocytes (n=4). (A) Volcano plot representing differentially expressed genes. Arrows indicate selected differentially regulated genes. Horizontal dashed line indicates the significance threshold (p<0.05). Vertical dashed line indicates twofold change. (B) Enrichment map representing selected upregulated pathways in rHSP90α-treated versus control monocytes. Intensity of the red color indicates significance, and the size of the circle indicates the number of genes. The line thickness indicates the number of overlapping genes. FC, fold change; NF-κB, nuclear factor κB; rHSP90α, recombinant heat-shock protein 90α; ROS, reactive oxygen species;TNF, tumor necrosis factor; TNIK, Traf2 and Nck interacting kinase.
Figure 5
Figure 5
Impact of IDO-1 on immunosuppressive activity of rHSP90α-treated monocytes. (A) Expression of IDO-1 in monocytes treated with 2 µg/mL rHSP90α was measured by Western blot. The representative experiment out of three is shown. (B) Representative histograms for proliferated T cells co-cultured with rHSP90α-treated monocytes with or without the IDO-1 inhibitor 1-methyl-D-tryptophan (1-D-MT, 0.5 mM). (C) Cumulative data for T cell proliferation co-cultured with rHSP90α-treated monocytes and 1-D-MT. Data are shown as the percentage of divided T cells normalized (norm) to the respective control of stimulated T cells alone (mean±SD; n=5–8). (D) Representative histograms for proliferated T cells co-cultured with rHSP90α-treated monocytes alone or together with anti-PD-L1 mAbs (0.5 µg/mL) and/or 1-D-MT (0.5 mM). (E) Cumulative data for T cell proliferation co-cultured with rHSP90α-treated monocytes together with anti-PD-L1 mAb and/or 1-D-MT 1-D-MT. Results are presented as the percentage of divided T cells normalized (norm) to the respective control of stimulated T cells alone (mean±SD; n=4). *p<0.05, **p<0.01, ***p<0.001. IDO, indoleamine 2,3-dioxygenase; mAbs, monoclonal antibodies; PD-L1, programmed cell death ligand 1; rHSP90α, recombinant heat-shock protein 90α.
Figure 6
Figure 6
Association between concentration of HSP90α and clinical outcome of patients with metastatic melanoma. The concentration of HSP90α was measured by ELISA in plasma taken before the treatment starts. (A) Progression-free and (B) overall survival of patients with melanoma with high (>12.42 ng/mL; n=16) and low (<12.42 ng/mL; n=16) HSP90α levels at the baseline are shown as a Kaplan-Meier curve. (C) The level of HSP90α in patients with melanoma responding (n=13) and non-responding (n=14) to ICI treatment was expressed in ng/mL (mean±SD). HSP90α, heat-shock protein 90α; ICI, immune checkpoint inhibitors.

References

    1. Passarelli A, Mannavola F, Stucci LS, et al. . Immune system and melanoma biology: a balance between immunosurveillance and immune escape. Oncotarget 2017;8:106132–42. 10.18632/oncotarget.22190 - DOI - PMC - PubMed
    1. Marzagalli M, Ebelt ND, Manuel ER. Unraveling the crosstalk between melanoma and immune cells in the tumor microenvironment. Semin Cancer Biol 2019;59:236–50. 10.1016/j.semcancer.2019.08.002 - DOI - PubMed
    1. Veglia F, Perego M, Gabrilovich D. Myeloid-derived suppressor cells coming of age. Nat Immunol 2018;19:108–19. 10.1038/s41590-017-0022-x - DOI - PMC - PubMed
    1. Huber V, Di Guardo L, Lalli L, et al. . Back to simplicity: a four-marker blood cell score to quantify prognostically relevant myeloid cells in melanoma patients. J Immunother Cancer 2021;9:e001167. 10.1136/jitc-2020-001167 - DOI - PMC - PubMed
    1. Jiang H, Gebhardt C, Umansky L, et al. . Elevated chronic inflammatory factors and myeloid-derived suppressor cells indicate poor prognosis in advanced melanoma patients. Int J Cancer 2015;136:2352–60. 10.1002/ijc.29297 - DOI - PubMed

MeSH terms