. 2022 Sep 16;13(1):5442.
doi: 10.1038/s41467-022-33010-8.

A temporal sequence of thalamic activity unfolds at transitions in behavioral arousal state

Affiliations

A temporal sequence of thalamic activity unfolds at transitions in behavioral arousal state

Beverly Setzer et al. Nat Commun. .

Abstract

Awakening from sleep reflects a profound transformation in neural activity and behavior. The thalamus is a key controller of arousal state, but whether its diverse nuclei exhibit coordinated or distinct activity at transitions in behavioral arousal state is unknown. Using fast fMRI at ultra-high field (7 Tesla), we measured sub-second activity across thalamocortical networks and within nine thalamic nuclei to delineate these dynamics during spontaneous transitions in behavioral arousal state. We discovered a stereotyped sequence of activity across thalamic nuclei and cingulate cortex that preceded behavioral arousal after a period of inactivity, followed by widespread deactivation. These thalamic dynamics were linked to whether participants subsequently fell back into unresponsiveness, with unified thalamic activation reflecting maintenance of behavior. These results provide an outline of the complex interactions across thalamocortical circuits that orchestrate behavioral arousal state transitions, and additionally, demonstrate that fast fMRI can resolve sub-second subcortical dynamics in the human brain.


Conflict of interest statement

The authors declare no competing interests.

Figures
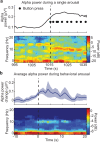
Fig. 1
Fig. 1. Behavioral arousals are linked to a transition in cortical EEG.
a An example behavioral arousal (dashed line) is accompanied by an increase in occipital alpha power (8–13 Hz). Top: the alpha power increase coincides with the return of behavior. Power is temporally smoothed in 2 s sliding windows. Bottom: the spectrogram demonstrates a return of occipital alpha directly following behavioral arousal. b Top: the mean alpha power significantly increases at behavioral arousal, consistent with a transition to the awake state (6 subjects, 66 arousals). Power is temporally smoothed in 2 s sliding windows. Shading is a standard error. Bottom: average spectrogram shows a specific increase in alpha power during behavioral arousal. Source data are provided in “Fig. 1 Source Data” file.
Fig. 2
Fig. 2. Thalamus activates seconds before behavioral arousal, while most of the cortex deactivates after arousal.
a Arousal-locked blood oxygenation-level-dependent (BOLD) signals in the whole cortex and thalamus. Thalamus (red) begins to activate (20% latency denoted by red arrow) seconds before behavioral arousal (vertical dashed line), while the cortex (blue) deactivates afterward (blue arrow). Data were presented as mean values, and shading represents standard error. b Most of the cortex deactivates during arousal, but a subset of regions, including the caudal anterior cingulate cortex (cACC, purple), activate before behavioral arousal, similarly to the thalamus. The rostral middle frontal (rmF, pink) and superior temporal (sT, dark blue) are shown as representative regions of frontal and temporal lobes. Results from all cortical ROIs can be seen in Supplementary Fig. 2. Shading represents standard error. c Correlation between each individual cortical region and the whole cortex or thalamus. While cortical activity is largely distinct from the thalamic rise, a subset of cortical regions is correlated with the thalamus, notably the caudal anterior cingulate and the posterior cingulate. Source data are provided in the “Fig. 2 Source Data” file.
Fig. 3
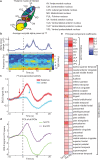
Fig. 3. 7 T imaging shows two primary activity modes at behavioral arousal, largely segregated into thalamic activation and cortical deactivation.
a Schematic of the thalamic nuclei of interest that were resolved with this imaging protocol. This image was created by the authors and was inspired by the Allen Brain Atlas. b In one subject scanned with simultaneous EEG (n = 6 arousals), mean alpha power significantly increases during behavioral arousal (dashed line), consistent with Experiment 1. Shading is a standard error. c Experiment 2 replicates the result that the thalamus activates (20% latency indicated by red arrow) prior to behavioral arousal, while cortical deactivation (blue arrow) follows (n = 13 subjects, 99 arousals). Shading is standard error. d A principal component analysis of all nine thalamic regions and 30 cortical regions reveals two primary modes of activity in the thalamus and cortex: one which increases before arousal and one which decreases after arousal. e The first principal component is more heavily influenced by cortical regions, and the second is influenced primarily by thalamic regions, demonstrating segregation of thalamic and cortical activity during arousal. Source data are provided in the “Fig. 3 Source Data” file.
Fig. 4
Fig. 4. A sequence of activity occurs across thalamic nuclei during behavioral arousal.
a The relative timing of thalamic activation differs significantly across nuclei (mean lag shown by the solid vertical line; shading is 95% confidence interval, colored from red to purple based on the order in sequence). Zero represents the timing of the whole thalamus (dashed line). The centromedian (CM, red) and ventral posterolateral (VPL, orange) thalamic nuclei lead the rest of the thalamus during behavioral arousal, while the ventral anterior (VA, light blue), anteroventral (AV, dark blue), and ventral lateral anterior (VLA, purple) lag behind. b Image of mean lag times per nucleus in one subject. Color represents precise lag. c The activation onset times (arrows) and the hemodynamic response (solid lines) show a sequence in activation across nuclei. Color represents the order in a lag sequence. d Thalamic nuclei activation onset is sequenced similarly to the lag values. Source data are provided in the “Fig. 4 Source Data” file.
Fig. 5
Fig. 5. Hemodynamic latencies cannot explain the arousal-locked temporal dynamics in the thalamus.
a fMRI signals increase after breathhold release (purple dashed line). The time of the breathhold is shaded in light purple. The thalamus leads the cortex by 0.12 s. Data were presented as mean values, and shading represents standard error. b Small hemodynamic lags between thalamic nuclei exist but are not large enough to account for the arousal-locked sequence. The color and ordering of thalamic nuclei represent the lag sequence during arousal. Mean lag (solid line) and 95% confidence interval (shading) were calculated by the same method as Fig. 4d. Purple dashed line represents a zero-lag relative to the whole thalamus. c Respiration amplitude increases at behavioral arousal (dashed line). Data were presented as mean values, and shading is the standard error. d Amplitude of the pulse signal decreases after behavioral arousal. Shading is a standard error. Source data are provided in the “Fig. 5 Source Data” file.
Fig. 6
Fig. 6. The late plateau of thalamic activity differs across transient and sustained arousals.
a During sustained arousals (pink), the behavior continues after the moment of arousal, whereas in transient arousals (purple), participants lapse back into unresponsiveness. b The post-arousal plateau in thalamic activity is significantly higher (starred, black line, Bonferroni corrected paired t-test, p < 0.05) in sustained arousals. Data were presented as mean values, and shading represents standard error. c In the global cortex, there is no significant difference in sustained versus transient arousals. Shading is a standard error. (Individual cortical ROIs are in Supplementary Fig. 11.) Source data are provided in the “Fig. 6 Source Data” file.
Fig. 7
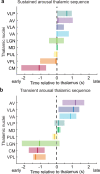
Fig. 7. Sequence of thalamic activity in sustained and transient arousals.
a The sequence at sustained arousals demonstrated that CM was still the first to activate, and the subsequent sequence across nuclei occurs closely together in time. The vertical line is the mean lag, shading is a 95% confidence interval. b The sequence at transient arousals evolved more slowly across nuclei. Source data are provided in the “Fig. 7 Source Data” file.

Similar articles

Cited by

References

    1. Bonnet MH, et al. The scoring of arousal in sleep: reliability, validity, and alternatives. J. Clin. Sleep. Med. 2007;3:133–145. doi: 10.5664/jcsm.26815. - DOI - PubMed
    1. Iber, C. & American Academy of Sleep Medicine. The AASM Manual for the Scoring of Sleep and Associated Events: Rules, Terminology and Technical Specifications (American Academy of Sleep Medicine, 2007).
    1. Lendner JD, et al. An electrophysiological marker of arousal level in humans. eLife. 2020;9:e55092. doi: 10.7554/eLife.55092. - DOI - PMC - PubMed
    1. Wright KP, Jr, Badia P, Wauquier A. Topographical and temporal patterns of brain activity during the transition from wakefulness to sleep. Sleep. 1995;18:880–889. doi: 10.1093/sleep/18.10.880. - DOI - PubMed
    1. Adamantidis AR, Gutierrez Herrera C, Gent TC. Oscillating circuitries in the sleeping brain. Nat. Rev. Neurosci. 2019;20:746–762. doi: 10.1038/s41583-019-0223-4. - DOI - PubMed

Publication types