. 2022 Sep 16;12(1):15558.
doi: 10.1038/s41598-022-19471-3.

Reconstituted TAD-size chromatin fibers feature heterogeneous nucleosome clusters

Affiliations

Reconstituted TAD-size chromatin fibers feature heterogeneous nucleosome clusters

Nikolay Korolev et al. Sci Rep. .

Abstract

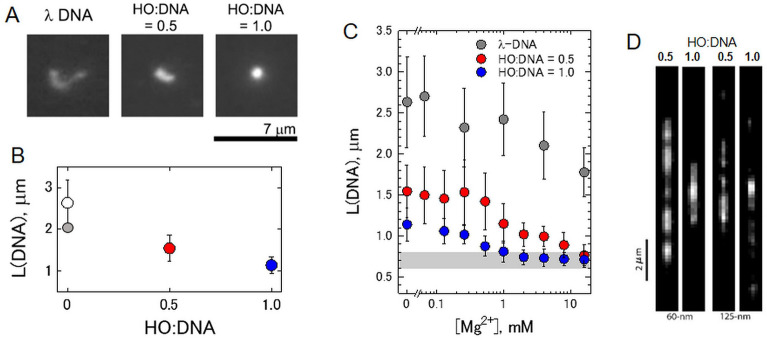
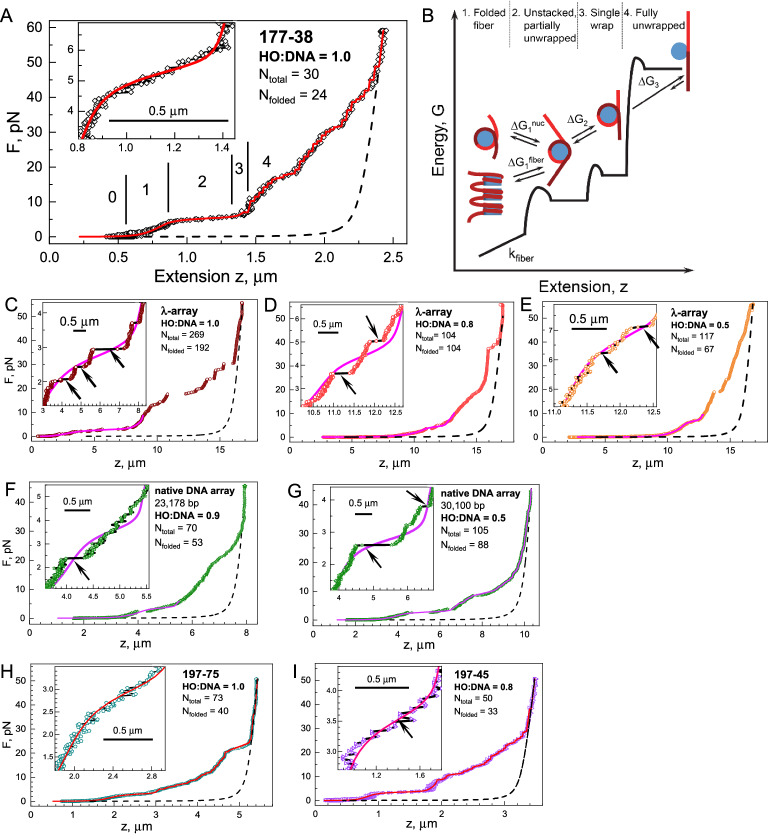
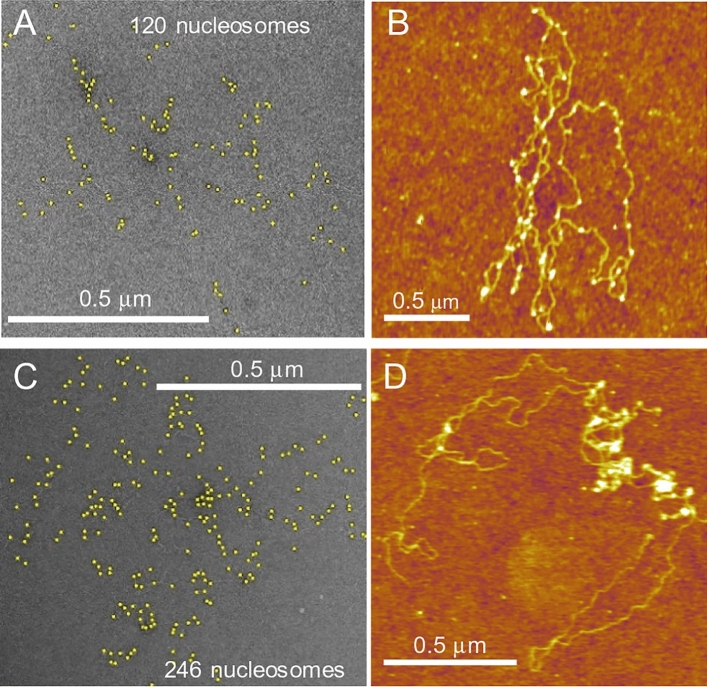
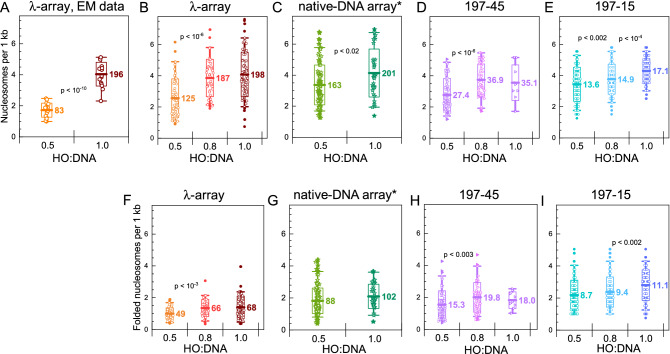
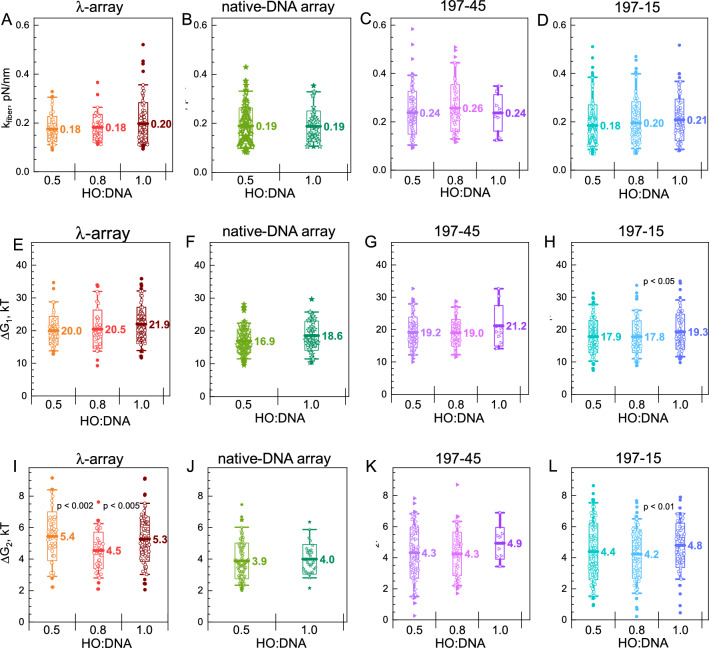
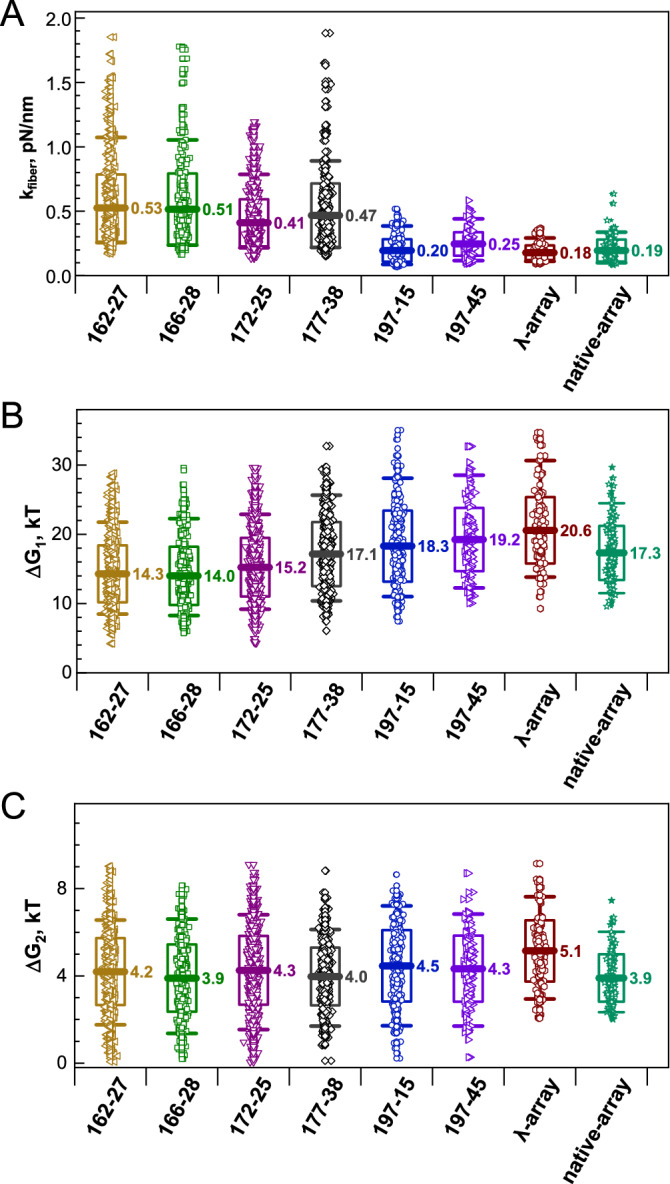
Large topologically associated domains (TADs) contain irregularly spaced nucleosome clutches, and interactions between such clutches are thought to aid the compaction of these domains. Here, we reconstituted TAD-sized chromatin fibers containing hundreds of nucleosomes on native source human and lambda-phage DNA and compared their mechanical properties at the single-molecule level with shorter '601' arrays with various nucleosome repeat lengths. Fluorescent imaging showed increased compaction upon saturation of the DNA with histones and increasing magnesium concentration. Nucleosome clusters and their structural fluctuations were visualized in confined nanochannels. Force spectroscopy revealed not only similar mechanical properties of the TAD-sized fibers as shorter fibers but also large rupture events, consistent with breaking the interactions between distant clutches of nucleosomes. Though the arrays of native human DNA, lambda-phage and '601' DNA featured minor differences in reconstitution yield and nucleosome stability, the fibers' global structural and mechanical properties were similar, including the interactions between nucleosome clutches. These single-molecule experiments quantify the mechanical forces that stabilize large TAD-sized chromatin domains consisting of disordered, dynamically interacting nucleosome clutches and their effect on the condensation of large chromatin domains.


Conflict of interest statement

The authors declare no competing interests.

Figures

Figure 1
Figure 1
Fluorescence microscopy of reconstituted chromatin on λ-DNA show Mg2+-dependent compaction into dynamic clusters. (A). Typical fluorescence micrographs of a YOYO-labeled single λ-DNA molecule (left) and the nucleosome arrays reconstituted with 0.5 (center) and 1.0 (right) HO:DNA ratios. (B). Average long-axis length of λ-DNA and λ-DNA reconstituted with HOs as a function of a loading degree. The error bars indicate the standard deviations of the average values measured of ca. 100 individual DNA molecules or chromatin fibers. (C). Mg2+-induced compaction of λ-DNA and reconstituted nucleosome arrays. Changes in the average long-axis length of λ-DNA and nucleosome arrays at 0.5 and 1.0 HO:DNA ratios in the solution containing different concentrations of MgCl2. The error bars indicate the standard deviations of the average values measured of ca. 100 individual λ-DNA molecules or chromatin fibers. Shadowed areas indicate the long-axis length corresponding to the globular DNA conformation (0.6–0.8 μm). All solutions contain TE buffer with 100 mM NaCl. (D). Fluorescence still images of the λ-arrays in nanofluidic channels with HO:DNA ratios 0.5 and 1.0 in the 60-nm and 125-nm channels (see Supplementary Movies 1–4). OriginPro software (http://www.originlab.com) was used to create the graphs in (B) and (C).
Figure 2
Figure 2
Single-molecule force spectroscopy reveals not only unstacking and unwrapping of nucleosomes in chromatin fibers but also large rupture events indicative of trans-interactions between remote parts of the chromatin fiber. (A). Example of an experimental stretching curve. Points are recorded data; the red line shows the model fitting. Different stages of the fiber stretching are indicated with numbers referring to the respective transition shown in (B). “0” indicates the extension of the bare DNA. (B). Statistical mechanics model for the single-molecule nucleosome array stretching. Free energy—extension scheme illustrating different stages of the nucleosome array extension under the influence of the stretching force. Deformation of the fiber includes (1) extension of the folded array; (2) transition of the array from a fiber to a bead-on-a-string chain accompanied by nucleosome unstacking and partial DNA unwinding; (3) deformation of the nucleosomes with further DNA unpeeling and possible dissociation of the histone dimer(s); (4) largely irreversible one-step rupture of the last turn of the DNA wrapped on the histone core. A detailed description of the model is given in the Material and Methods section. (CE) λ-arrays form heterogeneous nucleosome clusters. Sample curves of the λ-array stretching recorded for the HO:DNA ratios 1.0 (C), 0.8 (D), and 0.5 (E). (F,G) native DNA array at HO:DNA ratio 0.9 (F) and ratio 0.5 (G). (H,I) Stretching curves of the arrays reconstituted on the ‘601’ positioning DNA template: (H) 197-75 array; (I) 197-45 array. Inserts show low-force regions corresponding to the stretching of the compacted arrays. Arrows indicate cluster–cluster ruptures. In each panel, the horizontal bar corresponds to 0.5 μm. Points connected by the lines are experimential data, smooth curves are statistical mechanics model fitting, and arrows indicate cluster–cluster ruptures. Dashed lines show the extension of the bare DNA calculated using the DNA contour length and the WLC model. OriginPro software (http://www.originlab.com) was used to create the graphs in (A) and (CI). Microsoft PowerPoint 2016 (http://www.microsoft.com) was used to draw the image in (B).
Figure 3
Figure 3
EM and AFM images illustrate the formation of heterogeneous nucleosome clusters in the λ-arrays. (AD) Images of the λ-DNA arrays obtained for the HO:DNA 0.5 (A,B) and 1.0 (C,D) by the negative staining EM (A,C) and the AFM (B,D) methods.
Figure 4
Figure 4
Nucleosome count in the arrays reconstituted on the λ-DNA (A,B), MNnase-digested genomic DNA (C), and 197 bp NRL ‘601’ DNA templates (D,E). The relative number of nucleosomes (per 1 kb of the DNA template) in dependence on the HO:DNA ratio is shown for the EM images (A), for the MMT measurements of the λ-array (B), native DNA array (C), 197-45 (D), and 197-15 arrays (E). For the EM data in (A), nucleosomes were counted in the 17 arrays for each HO: DNA ratio. (FI) Show the dependence of the number of nucleosomes in the folded domains of the arrays on the DNA ratio determined by the MMT method. Mean values of the nucleosomes are displayed in the graphs. *For the native-DNA arrays in which the DNA lengths varied in a broad range, the observed values Ntotal (C) and Nfolded (G) were projected to an imaginary DNA length equal to that of the λ-DNA: Nprojected = Nobserved·(48,548 bp/LDNA,observed). If a pair of mean numbers have a significant statistical difference, the respective p-value is displayed. In the graphs, thick lines with labels indicate mean value; boxes show range ± standard deviation; whiskers show 5–95% range of data; solid points indicate outliers. Numerical data are given in Supplementary Table S3. OriginPro software (http://www.originlab.com) was used to create the graphs.
Figure 5
Figure 5
Analysis of the cluster–cluster ruptures in the λ-arrays, native DNA arrays, and 197-45 arrays. (A). Distribution of rupture force (Frupture) observed for the λ-arrays with HO:DNA ratios 0.5 (top, orange bars) and 1.0 (bottom, dark red bars) in comparison with the data obtained for the native arrays with similar HO:DNA ratios (green bars). The total number of ruptures recorded for each array type is indicated in the graphs. (B). Normalized distribution of the cluster–cluster distance determined for the λ-arrays for Frupture < 8 pN. HO:DNA ratios and numbers of the observed ruptures are indicated on the graphs. The distance is expressed in kbp DNA. The data obtained for the λ-arrays at HO:DNA = 0.8 and for the 45-197 arrays HO:DNA = 0.5, 0.8, and 1.0 are presented in Fig. S9 of the Supplementary Data. (C). The number of the cluster–cluster ruptures normalized to 10 kb DNA using Frupture < 8 pN cutoff and the number of the recorded traces at different HO:DNA ratios. The number of ruptures obtained for the 197-45 array at HO:DNA = 1.0 is not shown due to the small number of data (9 traces and 11 cluster–cluster ruptures). OriginPro software (http://www.originlab.com) was used to create the graphs.
Figure 6
Figure 6
Mechanical properties of the λ-arrays, arrays reconstituted on the MNase-digested genomic DNA, positioned 197 bp NRL arrays obtained for different HO:DNA ratios by fitting experimental data to the statistical mechanics model. (AD) stiffness (kfiber) of the folded arrays; (EH) free energy of the nucleosome folding and unwinding of the first 53 bp of the DNA from the histone core (∆G1); (IL) free energy of the further unwinding of the 13 bp DNA (∆G2). The left columns (A,E,I) is the data for the λ-arrays; second, the left column (B,F,J) is for the native DNA arrays; second, the right column (C,G,K) is for the 197-45 arrays; and the right column (D,H,L) is for the 197-15 arrays. In the graphs, thick lines with labels indicate the mean; boxes show the range within mean ± sd; whiskers show a 5–95% range of data; solid points indicate outliers. OriginPro software (http://www.originlab.com) was used to create the graphs.
Figure 7
Figure 7
Summary of the mechanical parameters determined for the arrays studied in this work. Nucleosome array (A) stiffness (kfiber; the first stage of pulling), free energies of (B) the second (∆G1) and (C) third (∆G2) stages of the array pulling. For the arrays reconstituted on the ‘601’ positioning DNA, the nucleosome repeat length and number of the repeats are indicated on the x-axis. Mean values of the respective parameters are displayed in the graphs. Boxes show the range within the mean ± sd; whiskers show the range from 5 to 95% around the median value. OriginPro software (http://www.originlab.com) was used to create the graphs.

Similar articles

Cited by

References

    1. Valouev A, et al. Determinants of nucleosome organization in primary human cells. Nature. 2011;474:516–520. doi: 10.1038/nature10002. - DOI - PMC - PubMed
    1. Buitrago D, et al. Nucleosome dynamics: A new tool for the dynamic analysis of nucleosome positioning. Nucleic Acids Res. 2019;47:9511–9523. doi: 10.1093/nar/gkz759. - DOI - PMC - PubMed
    1. Lorch Y, Maier-Davis B, Kornberg RD. Role of DNA sequence in chromatin remodeling and the formation of nucleosome-free regions. Genes Dev. 2014;28:2492–2497. doi: 10.1101/gad.250704.114. - DOI - PMC - PubMed
    1. Schwarzbauer K, Bodenhofer U, Hochreiter S. Genome-wide chromatin remodeling identified at GC-rich long nucleosome-free regions. PLoS ONE. 2012;7:e47924. doi: 10.1371/journal.pone.0047924. - DOI - PMC - PubMed
    1. Ishihara S, et al. Local states of chromatin compaction at transcription start sites control transcription levels. Nucleic Acids Res. 2021;49:8007–8023. doi: 10.1093/nar/gkab587. - DOI - PMC - PubMed

Publication types