. 2022 Jun;15(6):1375-1388.
doi: 10.1038/s41385-022-00567-y. Epub 2022 Sep 16.

B-cell receptor physical properties affect relative IgG1 and IgE responses in mouse egg allergy

Affiliations

B-cell receptor physical properties affect relative IgG1 and IgE responses in mouse egg allergy

Christopher C Udoye et al. Mucosal Immunol. 2022 Jun.

Abstract

Mutated and unmutated IgE and IgG play different and partly opposing roles in allergy development, but the mechanisms controlling their relative production are incompletely understood. Here, we analyzed the IgE-response in murine food allergy. Deep sequencing of the complementary-determining region (CDR) repertoires indicated that an ongoing unmutated extrafollicular IgE response coexists with a germinal center response, even after long-lasting allergen challenges. Despite overall IgG1-dominance, a significant proportion of clonotypes contained several-fold more IgE than IgG1. Clonotypes with differential bias to either IgE or IgG1 showed distinct hypermutation and clonal expansion. Hypermutation rates were associated with different physiochemical binding properties of individual B-cell receptors (BCR). Increasing BCR signaling strength inhibited class switching from IgG1 to IgE in vitro, preferentially constraining IgE formation. These data indicate that antigen-binding properties of individual BCRs determine differential IgE hypermutation and IgE versus IgG1 production on the level of single B-cell clones.


Conflict of interest statement

The authors declare no competing interests.

Figures

Fig. 1
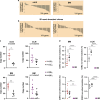
Fig. 1. The food allergy model.
Mice were sensitized to and challenged with EG/EYP and analyzed for the development of allergic symptoms. a Experimental outline. b Based on the development of symptoms, mice were categorized into different groups: mice that had at least 2× diarrhea but never a temperature drop ≥ 1 °C in response to a challenge (blue dot, diarrhea only; n = 11); mice that had at least 1× diarrhea and 2× a maximum temperature drop (max. ΔT) ≥ 1 °C in response to a challenge (red triangle, both symptoms; n = 14) and mice that never showed diarrhea or a max. ΔT ≥ 0.5 °C (black triangle No symptoms; n = 28), as indicated. The average drop in body temperature (left) and the occurrence of diarrhea (right) are shown. Data presented as mean ± SEM. c Mice were bled and EW-specific antibodies were measured by ELISA. EW-specific Ig subclasses and the ratio of IgG1 to IgE are shown. Pooled serum from EW/EYP-allergic mice was used as a standard that was defined as having 100 units of each Ab. Each symbol represents data form one mouse. Total number of mice: 53. No sample was excluded from the analysis. Statistics: two-way ANOVA with Bonferroni post test; not significant (no mark): p > 0.05 *p < 0.05, **p < 0.01, ***p < 0.001. Mean ± SEM is shown.
Fig. 2
Fig. 2. IgE and IgG1 sequences and clonotypes.
cDNA from naive mice and allergic mice challenged o.g. 13 times with EG/EYP was analyzed by NGS. Individual clonotypes within the IgG1 and IgE IgH-repertoires were defined by unique VDJ-rearrangements. a Number of sequences and clonotypes in BM and mLN, as indicated. Colored bars represent the mean. b Ratios of IgG1 to IgE sequences and ratios of IgG1 to IgE clonotypes, as indicated. c Number and percentages of hypermutated and unmutated IgE and IgG1 clonotypes. Representative data from two samples from BM and mLN each are shown. d Clone size distribution of unmutated IgE clonotypes. Representative data from mLN and BM of one mouse are shown, as indicated. e Upper panel: clone size distribution of all mutated IgE clonotypes. Lower panel: Clone size distribution of mutated IgE clonotypes with a clone size of 10 or less. f Mean copy numbers. Each symbol represents the average copy numbers of mutated IgG1 clonotypes (muIgG1), mutated IgE clonotypes (muIgE), unmutated IgG1 clonotypes (umIgG1) and unmutated IgE clonotypes (umIgE) from the mLN or BM of one mouse, as indicated. g Number of high copy number clones, defined as clones with copy numbers greater than the average umIgE or umIgG1 copy number, respectively. a/b: samples from 5 allergic mice and 2 naive mice from one experiment were analyzed. One BM sample was excluded due to insufficient cDNA quality (mLN: n = 7, BM: n = 6). cf samples from mLN of 5 allergic mice from one experiment and pooled samples from BM of 7 allergic mice from two experiments are shown (mLN: n = 5, BM: n = 7). No sample was excluded from the analysis. Total number of mice: 7. Statistics a-c: Mann Whitney’s nonparametric test for comparisons within the BM or mLN; Wilcoxon nonparametric matched paired test for comparisons between BM and mLN. Data presented as mean ± SEM. Statistics dg: pairwise t-test. *p ≤ 0.05; **p ≤ 0.01; ***p ≤ 0.001; ****p ≤ 0.0001.
Fig. 3
Fig. 3. IgEG and IgEE clonotypes.
Sequences from allergic mice were analyzed after 13 o.g. allergen challenges. a Shared clonotypes (VH-genes) were ordered in accordance to the ratios of their IgE to IgG1 copy numbers. Representative data from one mLN and one BM sample are shown. b Shared clonotypes from the 50 most abundant clonotypes. c Shared clones were classified as IgE-biased (IgEE, IgE/IgG copy number ratio of ≥ 2), or IgG1-biased (IgEG, IgG/IgE copy number ratio of ≥ 2). Copy numbers of mutated IgEE (mIgEE), mutated IgEG (mIgEG), unmutated IgEE (umIgEE), and unmutated IgEG (umIgEG) from BM and mLN are shown, as indicated. Each symbol represents the mean copy numbers form one mouse for the IgE subtype indicated. mLN samples from 5 allergic mice from one experiment and BM samples from 7 mice pooled from two independent experiments were analyzed (mLN: n = 5, BM: n = 7). No sample was excluded from the analysis. d Hypermutation rates of IgEG and IgEE. Mean percentage of non-silent mutations within the IgH-CDR3 regions of mutated IgEE (muIgEE), mutated IgEG (muIgEG), unmutated IgEE (umIgEE) and unmutated IgEG (umIgEG) are shown for BM and mLN, as indicated. Data presented as mean ± SEM. Statistics: pairwise t-test. *p ≤ 0.05; **p ≤ 0.01; ***p ≤ 0.001; ****p ≤ 0.0001.
Fig. 4
Fig. 4. Physiochemical properties of IgEG and IgEE.
Sequences from mLN and BM of allergic mice were analyzed after 13 o.g. allergen challenges. Physiochemical properties of IgEE and IgEG clones were calculated using the “Peptide” package in the R program. Aliphatic index, hydrophobicity index according to Kyte-Doolittle, net charges and isoelectric point (PI), are shown for mutated IgEE (muIgEE), mutated IgEG (mIgEG), unmutated IgEE (umIgEE) and unmutated IgEG (umIgEG). mLN samples from 5 allergic mice from one experiment and BM samples from 7 mice pooled from two independent experiments were analyzed. Two BM samples did not contain detectable umIgEE/ umIgEG. a Data from BM (n = 5–7). b Data from mLN (n = 5). Each symbol represents the respective average ratios form one mouse. Data presented as mean ± SEM. Statistics: pairwise t-test. *p ≤ 0.05; **p ≤ 0.01.
Fig. 5
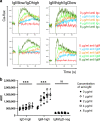
Fig. 5. BCR crosslinking induced calcium flux.
Single-cell suspensions from spleen were stained for IgM and IgD. After incubation with CalbryteTM 520 AM, separate samples were treated with various concentrations of polyclonal anti-IgM, or anti-Ig-kappa F(ab′)2, as indicated. Calcium flux was measured by flow cytometry (LSRII, BD, using a Flow Jo 10.7.1 software). a Representative histogram plots for IgMhigh/IgDlow naive B cells and IgMhigh/IgDlow marginal zone B cells, as indicated. b Statistical analysis of calcium flux after incubation with increasing concentrations of polyclonal anti-IgM F(ab′)2, for IgMhigh/IgDlow naive B cells, IgMhigh/IgDlow marginal zone B cells and IgMneg/IgDneg cells. Each symbol represents one cell culture well (n = 5 for all conditions). Representative data from one of three independent experiments, median and range are indicated. No sample was excluded from the analysis. Statistics: Friedmann-Test was calculated using R. ***p ≤ 0.001.
Fig. 6
Fig. 6. BCR stimulation alters the IgE to IgG1 ratio for class-switched cells.
Naive B cells were cultured together with CD40L / BAFF-transfected feeder cells and IL-4, and stimulated with various concentrations of anti-IgM F(ab’)2 fragments. Subsequently, the frequencies of IgE+ and IgG1+ cells were analyzed by flow cytometry. Dead cells, debris, doublets, and feeder cells were excluded by Life/Dead stain and forward/sideward scatter and B cells were identified by CD19 expression. a Representative FACS plots of CD19+ B cells on day four of culture, stimulated with increasing concentrations of anti-IgM, as indicated. b Percentages of IgE+ and IgG1+ B cells, and the ratios between IgE:IgG1+ cells are shown at day four of culture, as indicated. c IgG1+ cells were sorted from B-cell cultures by FACS-sorting, stimulated with IL-4 and various concentrations of anti-Ig kappa F(ab’)2 fragments, re-cultured for another three days and subsequently analyzed by flow cytometry. Percentages of IgE+ and IgG1+ cells in cultures stimulated with various concentrations of anti-Ig kappa F(ab′)2 fragments, as indicated. Statistics: Each dot represents data from a culture of cells from one mouse (n = 8 for all conditions using anti-IgM; (n = 6 for all conditions using anti-Ig kappa). No sample was excluded from the analysis. b Data are pooled from three independent experiments. Data presented as mean ± SEM. Statistics: Friedman-test, ***p ≤ 0.001. C: paired t-test, **p ≤ 0.01; ****p ≤ 0.0001.
Fig. 7
Fig. 7. IL-21 reduces the IgE to IgG1 ratio for class-switched cells.
Naive B cells were cultured together with CD40L / BAFF-transfected feeder cells and IL-4. At day 0 and day 1, various concentrations of IL-21 were added. The frequencies of IgE+ and IgG1+ cells were analyzed by flow cytometry at day 4. Dead cells, debris, doublets and feeder cells were excluded by Life/Dead stain and forward/sideward scatter and B cells were identified by CD19 expression. a Representative FACS plots of CD19+ B cells, stimulated with IL-21 in concentrations of 0, 10 or 20 ng/ml, as indicated. b Statistical analysis of the percentages of IgE+ and IgG1+ B cells, and the ratios between IgE:IgG1+ cells. Representative data from one of two independent experiments are shown. No sample was excluded from the analysis. Data presented as mean ± SEM. Statistics: Each symbol represents data from a culture of cells from one mouse (n = 5 for all conditions). Unpaired parametric t-test *p ≤ 0.05; **p ≤ 0.01; ****p ≤ 0.0001.
Fig. 8
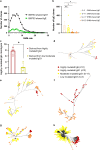
Fig. 8. Clonal distribution of somatic hypermutation rates and lineage tree analysis.
cDNA from allergic mice challenged o.g. 13 times with EG/EYP was analyzed by NGS. Individual clonotypes within the IgG1 and IgE IgH-repertoires were defined by unique VDJ-rearrangements. a Distribution of somatic hypermutation (SHM) rates of shared IgE and IgG1 clonotypes in one representative samples. b Statistical analysis of the distribution of somatic hypermutation of shared clonotypes in samples from BM of a total of 7 mice from two independent experiments (n = 7). Number of shared IgE clones with various hypermutation rates are shown, as indicated. c Analysis of lineages trees of highly mutated BM IgE clonotypes. Three samples containing less than 10 highly mutated IgE clonotypes were excluded from the analysis (n = 4). The number of highly mutated IgE (≥ 12 mutations) clonally related to highly mutated IgG1 (≥ 12 mutations) and low/moderately mutated IgG1 (≤ 11 mutations) are shown. (b, c) Each symbol represents data from one mouse and colored bars represent the mean. In total, lineage trees of 40 highly mutated IgE clonotypes were analyzed. dh Examples of lineage trees of highly mutated IgE clonotypes are shown. Data presented as mean ± SEM. Statistics: Paired parametric t-test *p ≤ 0.05; **p ≤ 0.01.

References

    1. Khass M, Vale AM, Burrows PD, Schroeder HW., Jr The sequences encoded by immunoglobulin diversity (DH) gene segments play key roles in controlling B-cell development, antigen-binding site diversity, and antibody production. Immunol. Rev. 2018;284:106–119. doi: 10.1111/imr.12669. - DOI - PubMed
    1. Schroeder HW, Jr., Cavacini L. Structure and function of immunoglobulins. J. Allergy Clin. Immunol. 2010;125:S41–S52. doi: 10.1016/j.jaci.2009.09.046. - DOI - PMC - PubMed
    1. Kulathu Y, Grothe G, Reth M. Autoinhibition and adapter function of Syk. Immunol. Rev. 2009;232:286–299. doi: 10.1111/j.1600-065X.2009.00837.x. - DOI - PubMed
    1. Engels N, Wienands J. Memory control by the B cell antigen receptor. Immunol. Rev. 2018;283:150–160. doi: 10.1111/imr.12651. - DOI - PubMed
    1. Yang, Z. et al. Regulation of B cell fate by chronic activity of the IgE B cell receptor. Elife5, e21238 (2016). - PMC - PubMed

Publication types