. 2022 Sep 16;5(1):983.
doi: 10.1038/s42003-022-03939-z.

Genomic adaptation of the picoeukaryote Pelagomonas calceolata to iron-poor oceans revealed by a chromosome-scale genome sequence

Affiliations

Genomic adaptation of the picoeukaryote Pelagomonas calceolata to iron-poor oceans revealed by a chromosome-scale genome sequence

Nina Guérin et al. Commun Biol. .

Abstract

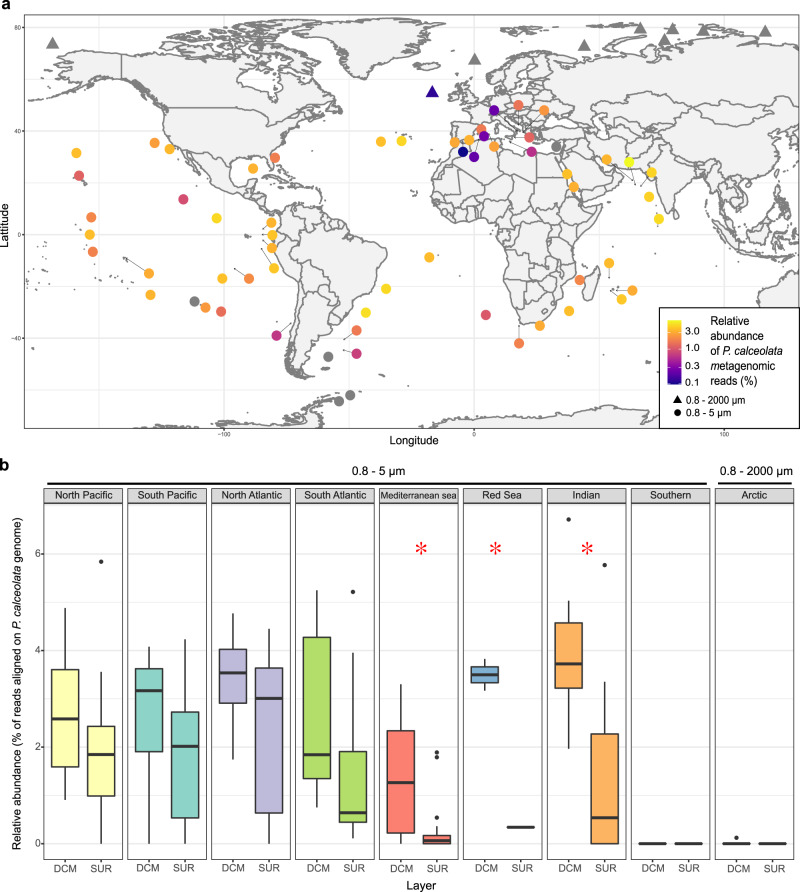
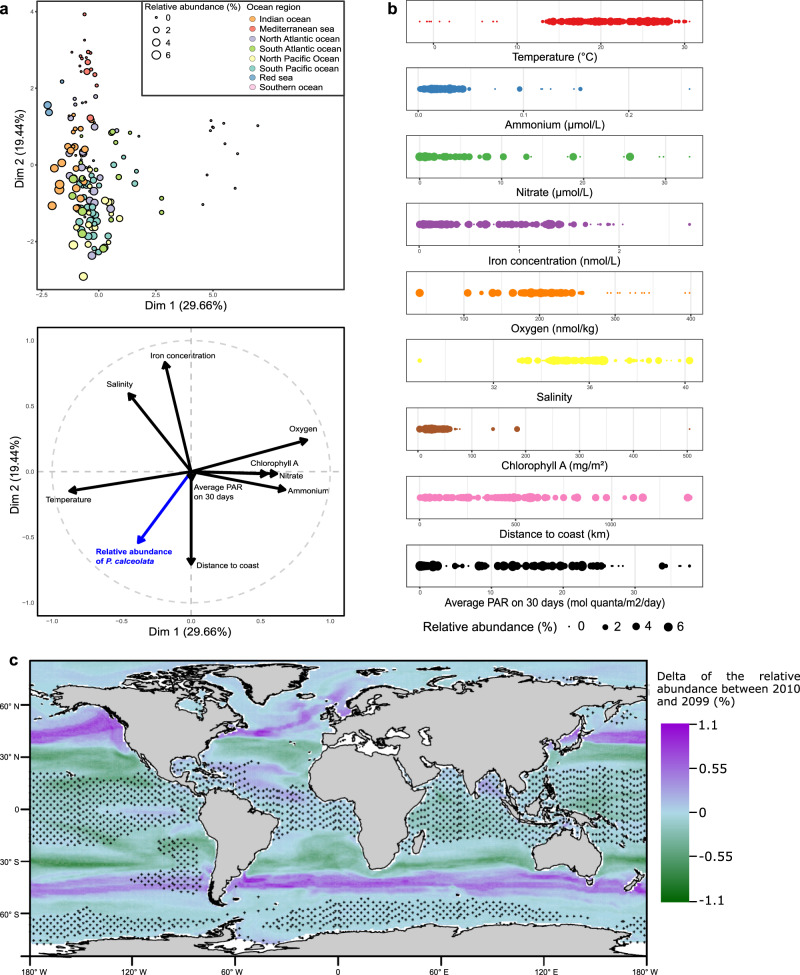
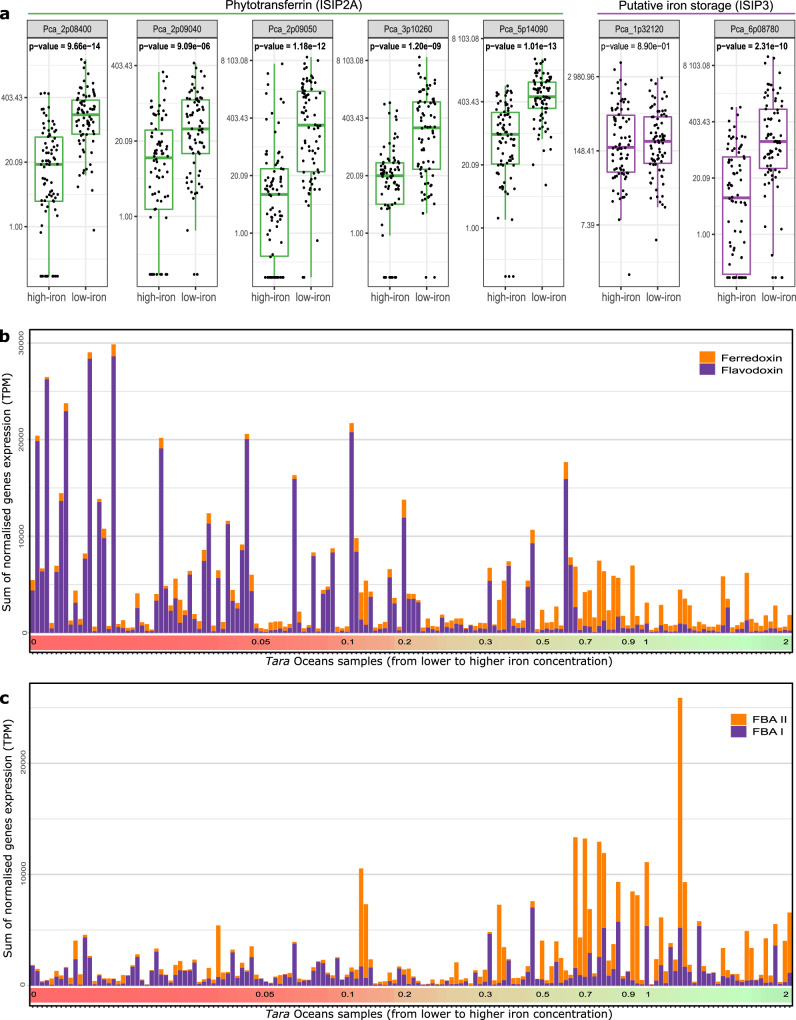
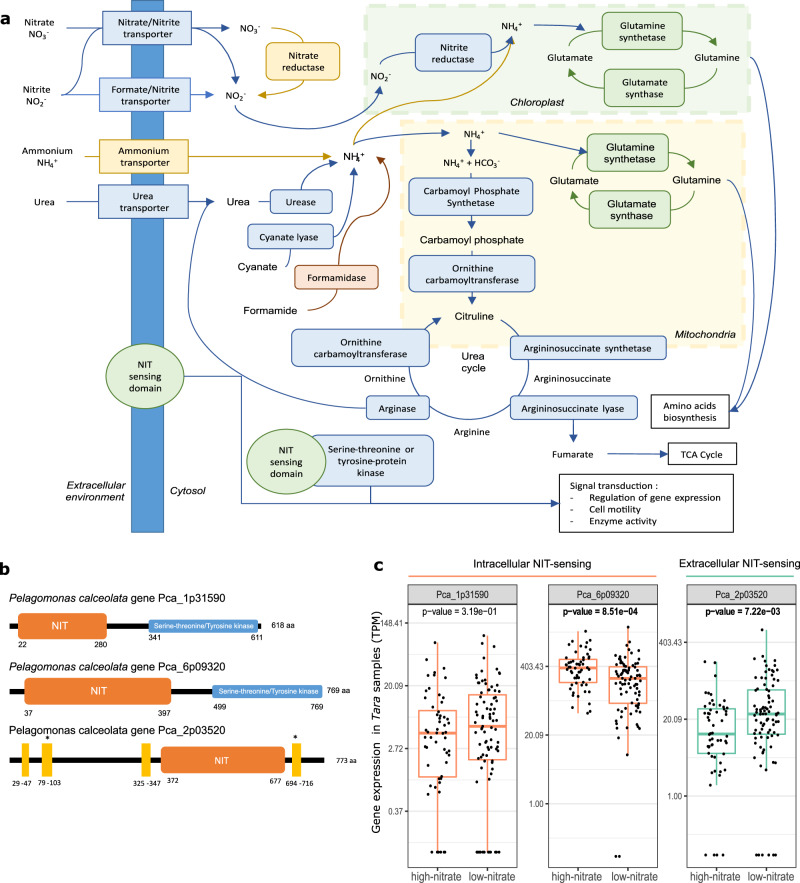
The smallest phytoplankton species are key actors in oceans biogeochemical cycling and their abundance and distribution are affected with global environmental changes. Among them, algae of the Pelagophyceae class encompass coastal species causative of harmful algal blooms while others are cosmopolitan and abundant. The lack of genomic reference in this lineage is a main limitation to study its ecological importance. Here, we analysed Pelagomonas calceolata relative abundance, ecological niche and potential for the adaptation in all oceans using a complete chromosome-scale assembled genome sequence. Our results show that P. calceolata is one of the most abundant eukaryotic species in the oceans with a relative abundance favoured by high temperature, low-light and iron-poor conditions. Climate change projections based on its relative abundance suggest an extension of the P. calceolata habitat toward the poles at the end of this century. Finally, we observed a specific gene repertoire and expression level variations potentially explaining its ecological success in low-iron and low-nitrate environments. Collectively, these findings reveal the ecological importance of P. calceolata and lay the foundation for a global scale analysis of the adaptation and acclimation strategies of this small phytoplankton in a changing environment.


Conflict of interest statement

The authors declare no competing interests.

Figures

Fig. 1
Fig. 1. Pelagomonas calceolata nuclear genome.
Representation of the 6 nuclear contigs of P. calceolata. The top layer indicates the number of genes per 100 Kb (black bars), the middle layer represents the GC content in percentage over a window of 200 Kb and the bottom layer is the position of DNA repeats of more than 500 bases repeated at least five times over the entire genome. Red, orange, and yellow bars indicate three different repeats in low-GC regions present in at least three different contigs. Dashed red and blue rectangles are duplicated chromosomic regions.
Fig. 2
Fig. 2. Relative abundance and distribution of P. calceolata in the oceans.
a World map of the relative abundance of P. calceolata metagenomic reads. The color code indicates the percentage of sequenced reads aligned on the genome. The DCM samples of size fractions 0.8–5 µm (circles) or 0.8–2000 µm (triangles) are shown. P. calceolata is considered to be absent when the horizontal coverage is below 25% of the genome (gray dots). b Boxplot of the relative abundance in each oceanic region in surface and DCM samples. Red stars indicate a significant difference between SUR and DCM samples (Wilcoxon test, P value <0.01).
Fig. 3
Fig. 3. Ecological niche of P. calceolata.
a Principal component analysis of the metagenomic-based relative abundance of P. calceolata in the 0.8–5 µm size fraction. Percentages of variance explained by each axis are indicated on axis titles. Top panel: each dot represents a sample with a size proportional to the relative abundance of P. calceolata and the colors indicate the oceanic basins. Bottom panel: nine environmental parameters are represented as vectors alongside the relative abundance of P. calceolata (blue vector). b Bubble plot of the relative abundance of P. calceolata for the 0.8–5 µm size fraction according to the nine environmental parameters. c Delta of the modeled relative abundance of P. calceolata between 2010 and 2099. Green areas correspond to a decrease while purple areas correspond to an increase of P. calceolata relative abundance. Small stars indicate locations where at least one of the predictor drivers is out of range compared to the training dataset values.
Fig. 4
Fig. 4. Expression of iron-related genes in P. calceolata.
a Relative gene expression levels normalized in transcript per million (TPM) of five phytotransferrins (ISIP2A) and two putative iron storage (ISIP3) in low-iron (<0.2 nM) and high-iron (>0.2 nM) oceanic stations. P values of Wilcoxon statistical tests between low- and high-iron conditions are indicated for each gene. Significant P values (<0.01) are in bold. b Relative expression levels (TPM) of genes coding for ferredoxin (orange) and its non-ferrous equivalent flavodoxin (purple) in each Tara Oceans sample. Samples are sorted from low-iron (left) to high-iron (right) conditions. Iron concentrations are indicated in nM on the colored horizontal bar. c Same representation for genes coding for fructose-bisphosphate aldolase II (orange) and its non-ferrous equivalent fructose-bisphosphate aldolase I (purple).
Fig. 5
Fig. 5. Nitrogen sensing and metabolism in P. calceolata.
a Schematic representation of N transport and assimilation in P. calceolata based on the gene content. The color code indicates if the number of gene copies for a specific function is overrepresented (green), equally represented (blue), underrepresented (orange) or absent (red) in P. calceolata genome compared to the mean of eight pico-nano photosynthetic eukaryotes. Gene copy number for each function is indicated in Supplementary Data 9. b Domain organization of NIT-sensing proteins in P. calceolata. Orange boxes are NIT-sensing domains (IPR13587), blue boxes are serine–threonine/tyrosine-kinase domain (IPR20635), and yellow rectangles are transmembrane domains. c Relative expression levels (TPM) of three NIT-sensing genes in low-nitrate (<2 µM) and high-nitrate (>2 µM) environments. P values of Mann–Withney–Wilcoxon tests between low- and high-nitrate samples are indicated for each gene. Significant P values (<0.01) are in bold.

References

    1. Field CB, Behrenfeld MJ, Randerson JT, Falkowski P. Primary production of the biosphere: integrating terrestrial and oceanic components. Science. 1998;281:237–240. doi: 10.1126/science.281.5374.237. - DOI - PubMed
    1. Boyce DG, Lewis MR, Worm B. Global phytoplankton decline over the past century. Nature. 2010;466:591–596. doi: 10.1038/nature09268. - DOI - PubMed
    1. Henson SA, Cael BB, Allen SR, Dutkiewicz S. Future phytoplankton diversity in a changing climate. Nat. Commun. 2021;12:5372. doi: 10.1038/s41467-021-25699-w. - DOI - PMC - PubMed
    1. Vaulot D, Eikrem W, Viprey M, Moreau H. The diversity of small eukaryotic phytoplankton (≤3 μm) in marine ecosystems. FEMS Microbiol. Rev. 2008;32:795–820. doi: 10.1111/j.1574-6976.2008.00121.x. - DOI - PubMed
    1. Agawin NSR, Duarte CM, Agustí S. Nutrient and temperature control of the contribution of picoplankton to phytoplankton biomass and production. Limnol. Oceanogr. 2000;45:591–600. doi: 10.4319/lo.2000.45.3.0591. - DOI

Publication types