. 2023 Jan;30(1):108-123.
doi: 10.1038/s41417-022-00531-9. Epub 2022 Sep 16.

Knock-out of 5-lipoxygenase in overexpressing tumor cells-consequences on gene expression and cellular function

Affiliations

Knock-out of 5-lipoxygenase in overexpressing tumor cells-consequences on gene expression and cellular function

Hannah Weisser et al. Cancer Gene Ther. 2023 Jan.

Abstract

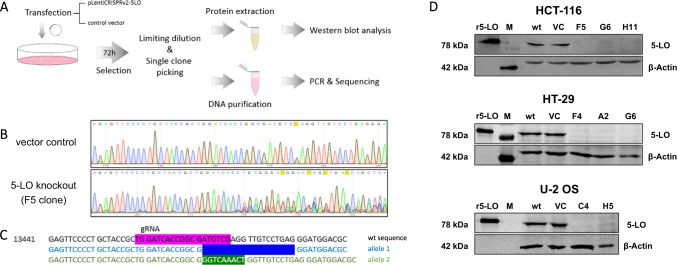
5-Lipoxygenase (5-LO), the central enzyme in the biosynthesis of leukotrienes, is frequently expressed in human solid malignancies even though the enzyme is not present in the corresponding healthy tissues. There is little knowledge on the consequences of this expression for the tumor cells regarding gene expression and cellular function. We established a knockout (KO) of 5-LO in different cancer cell lines (HCT-116, HT-29, U-2 OS) and studied the consequences on global gene expression using next generation sequencing. Furthermore, cell viability, proliferation, migration and multicellular tumor spheroid (MCTS) formation were studied in these cells. Our results show that 5-LO influences the gene expression and cancer cell function in a cell type-dependent manner. The enzyme affected genes involved in cell adhesion, extracellular matrix formation, G protein signaling and cytoskeleton organization. Furthermore, absence of 5-LO elevated TGFβ2 expression in HCT-116 cells while MCP-1, fractalkine and platelet-derived growth factor expression was attenuated in U-2 OS cells suggesting that tumor cell-derived 5-LO shapes the tumor microenvironment. In line with the gene expression data, KO of 5-LO had an impact on cell proliferation, motility and MCTS formation. Interestingly, pharmacological inhibition of 5-LO only partly mimicked the KO suggesting that also noncanonical functions are involved.


Conflict of interest statement

The authors declare no competing interests.

Figures

Fig. 1
Fig. 1. HCT-116, HT-29, Capan-2 and U-2 OS cells express the complete LT biosynthesis machinery but lipid mediator formation is low.
A Western Blots showing the 5-LO protein expression in several tumor cell lines derived from solid malignancies. B Protein expression of 5-LO, FLAP, cPLA and LTA4 hydrolase in HCT-116, HT-29, U-2 OS and Capan-2 cells. C mRNA expression of LTC4 synthase (LTC4S) in the four cell lines. D Confocal microscopy images showing the cellular localization of 5-LO in HT-29, HCT-116, U-2 OS and Capan-2 cells. E Comparison of LTB4 and 5-HETE formation in intact cells, cell homogenates and 100,000 g supernatants (S100) of human PMNL, HT-29, HCT-116, U-2 OS and Capan-2 cells. The cells were incubated in PGC buffer supplemented with 20 µM ARA and 1 mM Ca2+. For formation of 5-LO products the intact cells were stimulated with Ca2+ ionophore (A23187, 2.5 μM). The broken cell preparations received 1 mM ATP instead. The samples were then incubated for 10 min at 37 °C and lipid mediator formation was analyzed by LC/MS-MS. The values represent the mean + SD of 3–11 independent experiments. Intact, intact cells; hom, cell homogenates; M, size marker; r5-LO, recombinant human 5-LO; S100, 100,000 g supernatants.
Fig. 2
Fig. 2. Generation and validation of the 5-lipoxygenase knockout cell lines.
A Workflow for generation of the 5-LO knockout cell lines. To validate the KO, clones were subjected to Sanger sequencing and compared to the vector control. B Depicted here are the sequencing data of the HCT-116 clone F5 and C the resulting gene alterations on both alleles compared to the wildtype sequence. The gRNA binding site is marked in pink. Allele 1: Deletion of 19 bases (dark blue); Allele 2: Substitution of 7 bases (ATGTCGA) by nine different bases (GGTCAAACT) (green). The complete sequencing data for all KO clones used in this study can be found in the supplementary information (Supplementary Figs. 1–3). D Validation of the 5-LO KO on protein level in HCT-116, HT-29 and U-2 OS single cell clones analyzed by Western blotting. Recombinant human 5-LO was used as positive control. VC empty vector control, M marker, r5-LO recombinant human 5-LO, wt wild-type cells.
Fig. 3
Fig. 3. Genome-wide RNA sequencing of the differentially regulated genes after 5-LO KO.
Each KO clone and the corresponding empty vector control were measured in three biological replicates during genome-wide RNA sequencing. Genes showing a log2-fold change > 1 and an adjusted p-value < 0.05 compared to the empty vector control in each KO clone of a respective cell line were considered differentially expressed. The resulting means for each clone are depicted in heat maps: (A) HCT-116, (B) HT-29, (C) U-2 OS cells. Upregulated genes compared to control vector cells are marked in red while downregulated genes are marked in blue.
Fig. 4
Fig. 4. Validation of the RNAseq data via mRNA and protein expression employing RT-qPCR, ELISA and CBA.
The DEGs were further validated by RT-qPCR and analysis of protein expression. Four differentially regulated genes per cell line are depicted. Gene expression was normalized to ACTB (housekeeping gene) and the corresponding control vector cells (2−ΔΔct method). A qPCR analysis of four representative DEGs from HCT-116 5-LO KO cells. B Secretion of TGFβ2 into the cell culture supernatants of HCT-116 5-LO KO cells measured via ELISA. Depicted are the relative TGFβ2 amounts in % compared to the vector control (mean TGFβ2 secretion from vector control cells: 231.9 ± 140 pg/µg total protein). C qPCR analysis of four representative DEGs from HT-29 5-LO KO cells and D U-2 OS cells. E Cytokine release from U-2 OS 5-LO KO cells. Data are depicted as relative cytokine amounts in % compared to the corresponding control vector cells. PDGF-AA was assessed by ELISA while fractalkine (CX3CL1) and MCP-1 (CCL2) were measured via FACS employing a cytometric bead array (mean secretion from vector control cells: fractalkine, 64.9 ± 9.2 pg/µg protein; MCP-1, 978.2 ± 101.8 pg/µg protein; PDGF-AA, 255,6 ± 95.6 pg/µg protein). The complete mRNA expression data can be found in supplementary Fig. 4 and supplementary table 1. All data are presented as mean + SD of three independent experiments. Asterisks indicate significant changes vs. control vector cells. *P ≤ 0.05, **P ≤ 0.01, ***P ≤ 0.001.
Fig. 5
Fig. 5. Influence of the 5-LO KO on cell growth and survival of HCT-116, HT-29 and U-2 OS cells.
A Cell proliferation of the cells was assessed by counting the cells on a daily basis for 4 days. B In addition, pictures of the proliferating cells were taken on a daily basis. C Cell death analysis of the cells after treatment with actinomycin D (5, 10 nM), etoposide (20, 40 µM) or 5-fluorouracil (50 µM). DMSO treated cells were used as negative control. After 48 h the cells were stained with annexinV and propidium iodide and cell death was analyzed by flow cytometry. Data are presented as mean + SD from three independent experiments. Asterisks indicate significant changes vs. control vector treated cells. *P ≤ 0.05, **P ≤ 0.01, ***P ≤ 0.001. ActD actinomycin D, Eto etoposide, VC empty vector control, 5-FU 5-fluorouracil.
Fig. 6
Fig. 6. Influence of the 5-LO KO on MCTS formation of HCT-116, HT-29 and U-2 OS cells.
A Three dimensional growth of the 5-LO KO clones and vector control cells as multicellular tumor spheroids. For this, cells were seeded in low-attachment plates and the spheroid diameter (in µm) was monitored for 11–16 days. Data are presented as mean ± SD of 3–9 independent experiments. B Number of living (left graph) and total (right graph) cells per spheroid. Data are presented as mean + SD of three independent experiments. C Cell viability in spheroids was assessed by the CellTiter-Glo® 3D cell viability assay. Data are presented as mean + SD of three independent experiments. Data depicted in B and C are depicted as % vector control. Asterisks indicate significant changes vs. control vector treated cells. *P ≤ 0.05, **P ≤ 0.01, ***P ≤ 0.001.
Fig. 7
Fig. 7. Influence of the 5-LO KO on colony formation, migration and invasion of HCT-116, HT-29 and U-2 OS cells.
A Two dimensional colony formation of the 5-LO KO clones. Cells were seeded into 6-well plates at low density (400 cells/well) and the number of colonies formed after 7 days was assessed by Ponceau red staining. Data are presented as + SD of three independent experiments (Plating efficiency of control vector cells: HCT-116; 72%, HT-29; 70%, U-2 OS; 80%). B Three dimensional colony formation of the 5-LO clones in soft agar. Colonies formed after 3 weeks were stained with crystal violet and counted. U-2 OS cells did not form any colonies under these conditions. Data are presented as mean + SD of three independent experiments (Plating efficiency of control vector cells: HCT-116; 1.6%, HT-29; 0.6%). C Outgrowth/invasion of preformed spheroids into matrigel®. Growth (diameter in µm) was monitored for 14–19 days. Data are presented as mean ± SD of 3–9 independent experiments. D Directed cell migration towards serum was measured in a transwell assay for 3 h (U-2 OS) or 24 h (HCT-116, HT-29). E For investigations on invasive properties of the cells migration through matrigel® was measured. Data on cell migration and invasion in the transwell assay are presented as mean + SD from 3–5 independent experiments. Data depicted in A, B, D, and E are depicted as % vector control. Asterisks indicate significant changes vs. control vector treated cells. *P ≤ 0.05, **P ≤ 0.01, ***P ≤ 0.001.
Fig. 8
Fig. 8. Pharmacological inhibition of 5-LO partially mimics the 5-LO KO.
A mRNA expression of selected genes in HCT-116, HT-29 and U-2 OS cell expressing wild-type 5-LO after treatment with different 5-LO inhibitors (zileuton (3 or 10 µM)); CJ-13610 (0.3 or 3 µM) for 3 days measured by RT-qPCR. Each gene was normalized to ACTB as well as the DMSO treated control (2-ΔΔct method). Data are presented as mean + SD of three independent experiments. B Cell proliferation in HT-29 and U-2 OS cells treated with zileuton (3 or 10 µM) or CJ-13610 (0.3 or 3 µM) for 96 h. Data are presented as mean + SD of 3–5 independent experiments. C Three dimensional growth of HT-29 and U-2 OS cells treated with zileuton (3 or 10 µM) or CJ-13610 (0.3 or 3 µM) during MCTS formation. D Number of living HT-29 and U-2 OS cells per spheroid depicted as % of the corresponding DMSO control. Data are presented as mean + SD of three independent experiments. E Directed cell migration of HCT-116 and U-2 OS cells towards serum after treatment with zileuton (3 or 10 µM) or CJ-13610 (0.3 or 3 µM). After 3 h (U-2 OS) or 24 h (HCT-116), migrated cells were stained and fluorescence of the cell suspension was measured. Data are presented as mean ± SD from 3–5 independent experiments. Asterisks indicate significant changes vs. DMSO control. *P ≤ 0.05, **P ≤ 0.01, ***P ≤ 0.001.

Similar articles

Cited by

References

    1. Rådmark O, Werz O, Steinhilber D, Samuelsson B. 5-Lipoxygenase, a key enzyme for leukotriene biosynthesis in health and disease. Biochim Biophys Acta. 2015;1851:331–9. doi: 10.1016/j.bbalip.2014.08.012. - DOI - PubMed
    1. Haeggström JZ, Funk CD. Lipoxygenase and leukotriene pathways: biochemistry, biology, and roles in disease. Chem Rev. 2011;111:5866–98. doi: 10.1021/cr200246d. - DOI - PubMed
    1. Roos J, Oancea C, Heinssmann M, Khan D, Held H, Kahnt AS, et al. 5-Lipoxygenase is a candidate target for therapeutic management of stem cell-like cells in acute myeloid leukemia. Cancer Res. 2014;74:5244–55. doi: 10.1158/0008-5472.CAN-13-3012. - DOI - PubMed
    1. Chen Y, Hu Y, Zhang H, Peng C, Li S. Loss of the Alox5 gene impairs leukemia stem cells and prevents chronic myeloid leukemia. Nat Genet. 2009;41:783–92. doi: 10.1038/ng.389. - DOI - PMC - PubMed
    1. Ma D, Liu P, Wang P, Zhou Z, Fang Q, Wang J. PKC-β/Alox5 axis activation promotes Bcr-Abl-independent TKI-resistance in chronic myeloid leukemia. J Cell Physiol. 2021;236:6312–27.. doi: 10.1002/jcp.30301. - DOI - PubMed

Publication types

Substances