. 2022 Sep 16;12(1):15579.
doi: 10.1038/s41598-022-18726-3.

Discovery, isolation, heterologous expression and mode-of-action studies of the antibiotic polyketide tatiomicin from Amycolatopsis sp. DEM30355

Affiliations

Discovery, isolation, heterologous expression and mode-of-action studies of the antibiotic polyketide tatiomicin from Amycolatopsis sp. DEM30355

Bernhard Kepplinger et al. Sci Rep. .

Abstract

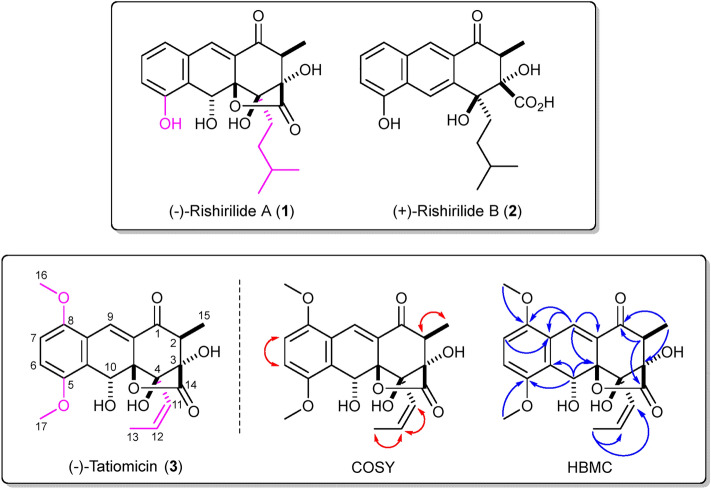
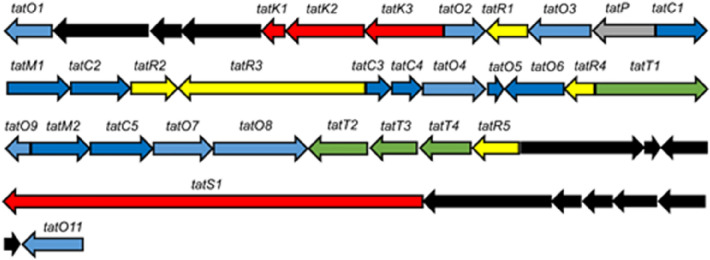
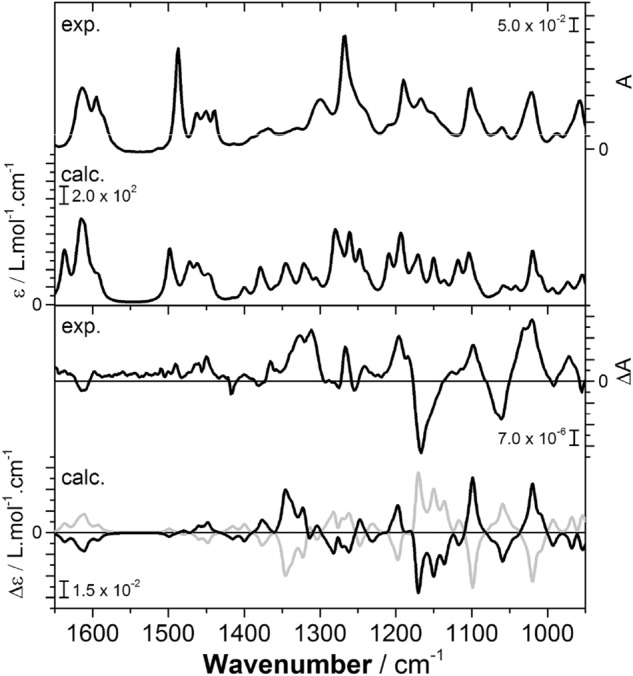
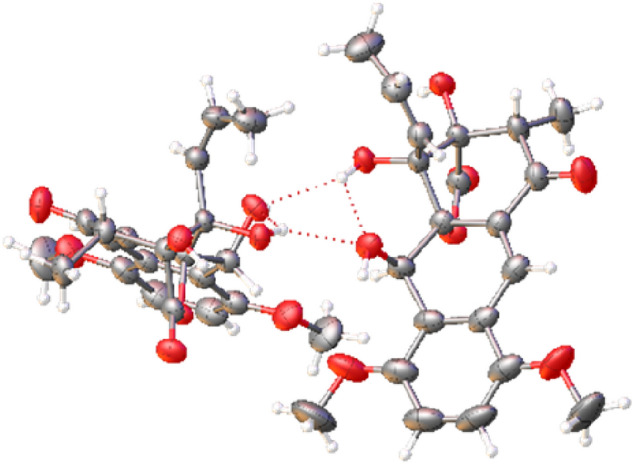
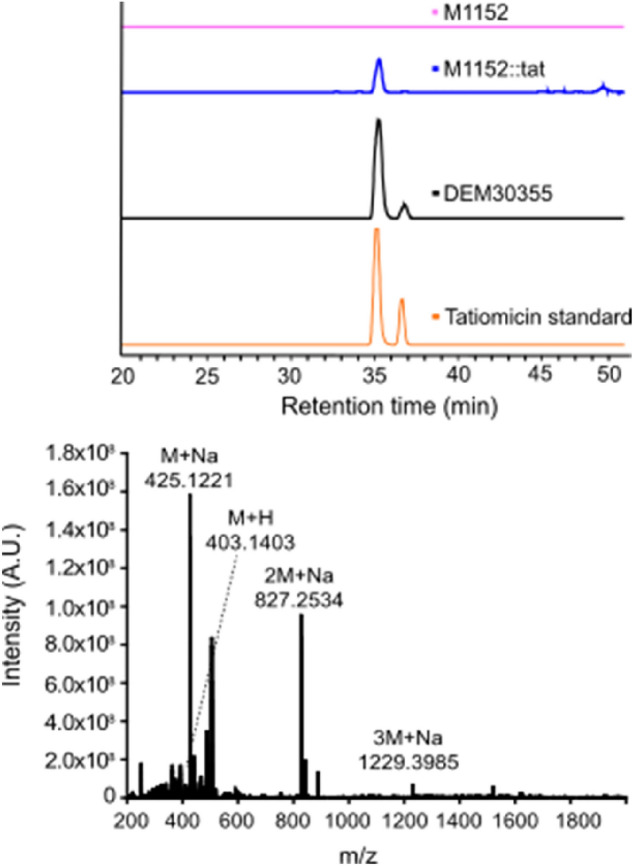
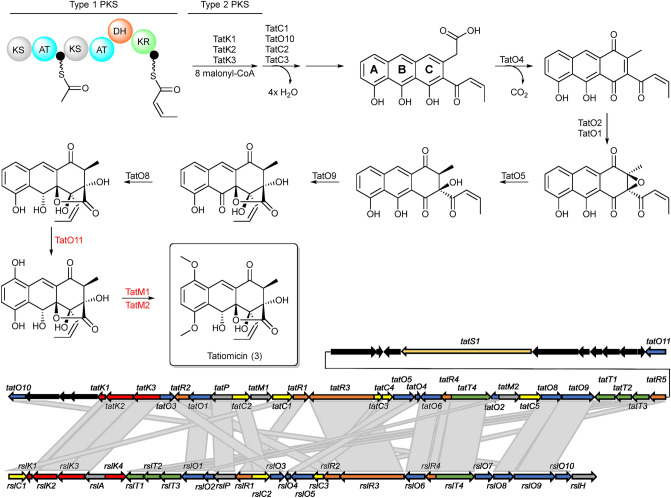
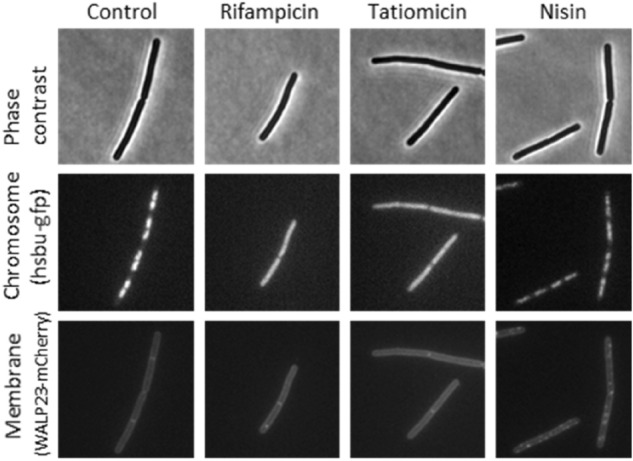
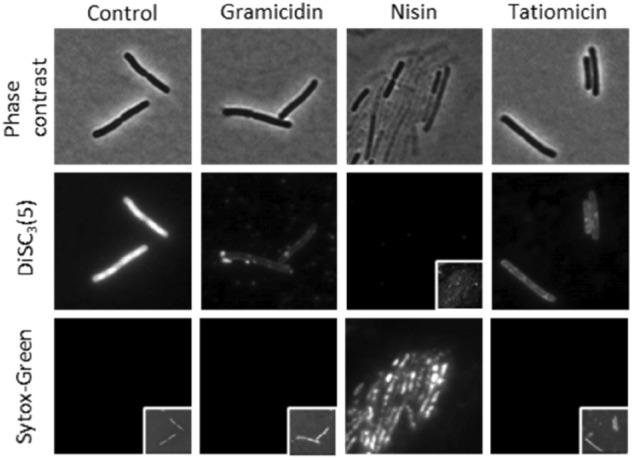
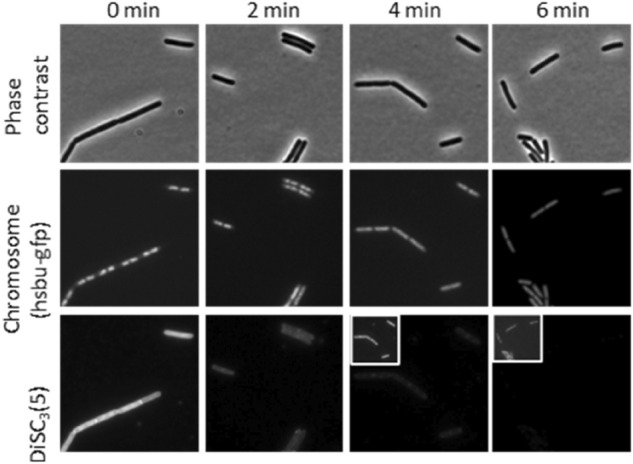
A genomic and bioactivity informed analysis of the metabolome of the extremophile Amycolatopsis sp. DEM30355 has allowed for the discovery and isolation of the polyketide antibiotic tatiomicin. Identification of the biosynthetic gene cluster was confirmed by heterologous expression in Streptomyces coelicolor M1152. Structural elucidation, including absolute stereochemical assignment, was performed using complementary crystallographic, spectroscopic and computational methods. Tatiomicin shows antibiotic activity against Gram-positive bacteria, including methicillin-resistant Staphylococcus aureus (MRSA). Cytological profiling experiments suggest a putative antibiotic mode-of-action, involving membrane depolarisation and chromosomal decondensation of the target bacteria.


Conflict of interest statement

N.E.E.A. is an employee of and J.E. scientific founder of and shareholder in Demuris, as is M.G. Demuris and Newcastle University have filed UK patent GB2009053.6. Other authors do not have any conflict of interest.

Figures

Figure 1
Figure 1
Top (–)-Rishirilide A (1) and ( +)-rishirilide B (2). Relative stereochemistry of (–)-1 and absolute stereochemistry of ( +)-2 shown. Bottom. Structure of (–)-tatiomicin (3) as derived from NMR and SCXRD experiments. Key COSY (red) and HMBC (blue) correlations shown. Absolute stereochemistry as shown by both vibrational circular dichroism (VCD) and single-crystal X-ray diffraction (SCXRD) resonant scattering experiments. Structural differences of rishirilide A and tatiomicin are highlighted (magenta).
Figure 2
Figure 2
Organization of the tatiomicin BGC. Genes coding for polyketide biosynthesis (red; tatS = starter unit biosynthesis, tatK = chain biosynthesis), polyketide modification (blue; tatO = oxidoreductases, tatC = cyclases, tatM = methyltransferases), regulation (yellow; tatR), transport (green, tatT) and others (grey; tatP = phosphorylase, black; genes not assigned to the tatiomicin BGC based on homology to the rishirilide BGC and proposed biosynthetic pathway)).
Figure 3
Figure 3
Experimental IR (top) and VCD spectra (bottom) of ( −)-tatiomicin 3 (CDCl3) with predicted spectra obtained at the B3LYP/PCM/6–311 +  + G(d,p) level of theory. VCD: Solid line = (2R,3R,4S,4aS,10S), dashed line = (2S,3S,4R,4aR,10R). Spectra have been frequency scaled Black line (σ = 0.987) to yield maximal similarity grey line between the computed and experimental VCD spectra.
Figure 4
Figure 4
Displacement ellipsoid plot of the molecular structure of (–)-tatiomicin (3), absolute stereochemistry as shown determined by resonant scattering the dimer molecular structure (Flack parameter = 0.05(6)). Displacement ellipsoids shown at 50% probability level.
Figure 5
Figure 5
Detection of tatiomicin from the fermentation of heterologous host S. coelicolor M1152::tat. Top) Extracted ion chromatogram (EIC) based on m/z = 827.25. S. coelicolor M1152 (purple), S. coelicolor M1152::tat (blue), Amycolatopsis sp. DEM30355 (black) and tatiomicin standard (red). Bottom) MS spectrum of tatiomicin (3) purified from the heterologous host S. coelicolor M1152::tat.
Figure 6
Figure 6
Top) Proposed pathway for the biosynthesis of (–)-tatiomicin (3) based on homology with the biosynthetic gene cluster for the rishirilides. Enzymes shown in red have no direct congener in the rishirilide BGC and their biosynthetic role is hypothesised, based on BLAST analysis. Bottom) comparison of the rishirilide and (-) tatiomicin gene cluter based on BLAST analysis. (red; tatS = starter unit biosynthesis, tatK or rslK = chain biosynthesis), polyketide modification (blue; tatO or rslO = oxidoreductases, tatC or rslO = cyclases), regulation (yellow; tatR or rslR), transport (green, tatT or rslT) and others (grey; tatP or rslP = phosphorylase; tatM = methyltransferases, black; genes not assigned to the tatiomicin BGC based on homology to the rishirilide BGC and proposed biosynthetic pathway)).
Figure 7
Figure 7
Single-cell analysis of chromosome and membrane integrity. Phase contrast (top panels) and fluorescence microscopy of B. subtilis cells treated with various antibiotics (indicated above). DNA was visualized with an HsbU-GFP fusion (middle panels) and the cytoplasmic membrane with a WALP23-mCherry fusion (bottom panels).
Figure 8
Figure 8
Single-cell measurement of membrane potential and permeability. Phase contrast (top panels) and fluorescence microscopy of B. subtilis cells stained with the voltage-sensitive dye DiSC3(5) (middle panels) and the membrane permeability indicator Sytox Green (bottom panels) in the presence and absence of 32 μg/mL of tatiomicin. As positive controls, the cells were treated with 5 μg/mL of gramicidin (membrane depolarisation without pore formation) and 10 μM nisin (membrane depolarisation through pore formation). Cellular DiSC3(5) and Sytox Green fluorescence values were quantified for cells treated with tatiomicin (32 μg/mL), gramicidin (5 μg/mL), and nisin (10 μM) (see SI).
Figure 9
Figure 9
Single-cell measurement of chromosome decondensation and membrane potential in a time course experiment in the presence of tatiomicin (32 μg/mL). Phase contrast (top panels), fluorescence microscopy of B. subtilis HsbUGFP (chromosome marker) (middle panel) and stained with the voltage sensitive dye DiSC3(5) bottom panel. Cellular DiSC3(5) fluorescence values where quantified over time. The bar chart depicts the fluorescent intensity values of individual cells (> 30) (see SI).

References

    1. Fischbach MA, Walsh CT. Antibiotics for emerging pathogens. Science. 2009;325:1089–1093. doi: 10.1126/science.1176667. - DOI - PMC - PubMed
    1. Boucher HW, et al. Bad bugs, no drugs: No ESKAPE! An update from the Infectious Diseases Society of America. Clin. Infect. Dis. 2009;48:1–12. doi: 10.1086/595011. - DOI - PubMed
    1. Silver LL. Challenges of antibacterial discovery. Clin. Microbiol. Rev. 2011;24:71–109. doi: 10.1128/CMR.00030-10. - DOI - PMC - PubMed
    1. Tommasi R, Brown DG, Walkup GK, Manchester JI, Miller AA. ESKAPEing the labyrinth of antibacterial discovery. Nat. Rev. Drug Discov. 2015;14:529–542. doi: 10.1038/nrd4572. - DOI - PubMed
    1. Butler MS, Paterson DL. Antibiotics in the clinical pipeline in October 2019. J. Antibiot. 2020;73:329–364. doi: 10.1038/s41429-020-0291-8. - DOI - PMC - PubMed

Publication types

MeSH terms

LinkOut - more resources