. 2022 Sep 16;5(1):976.
doi: 10.1038/s42003-022-03910-y.

Autoprocessing and oxyanion loop reorganization upon GC373 and nirmatrelvir binding of monomeric SARS-CoV-2 main protease catalytic domain

Affiliations

Autoprocessing and oxyanion loop reorganization upon GC373 and nirmatrelvir binding of monomeric SARS-CoV-2 main protease catalytic domain

Nashaat T Nashed et al. Commun Biol. .

Abstract

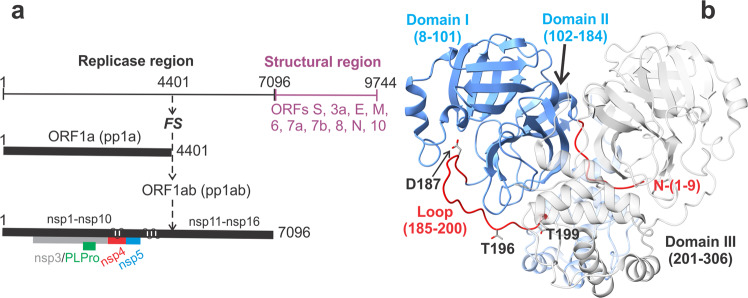
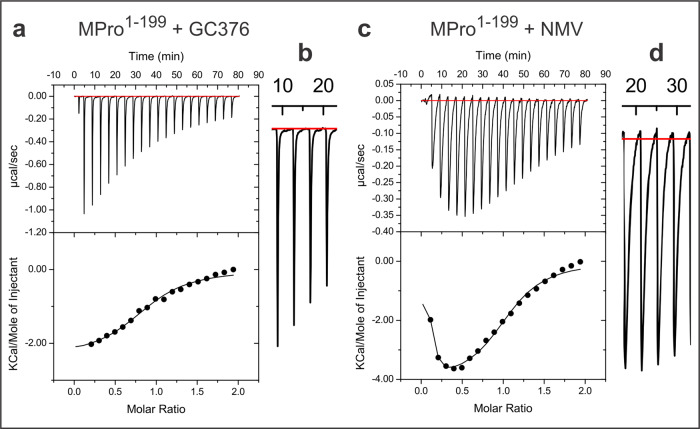
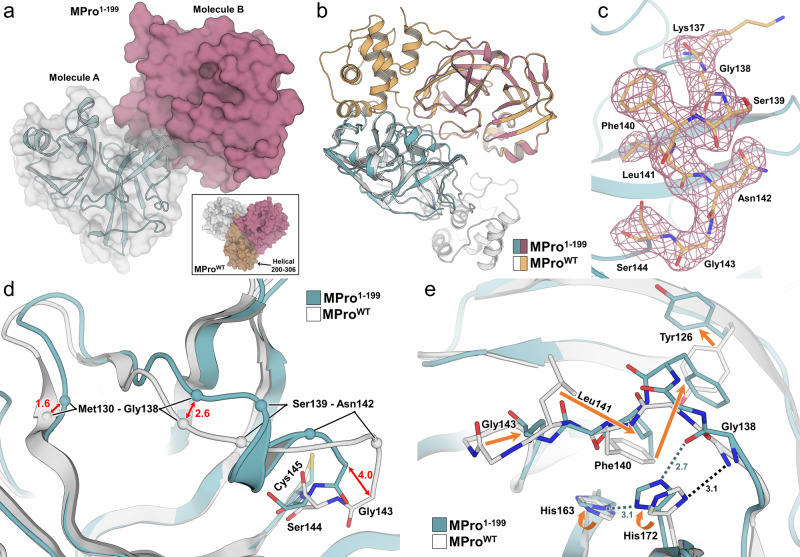
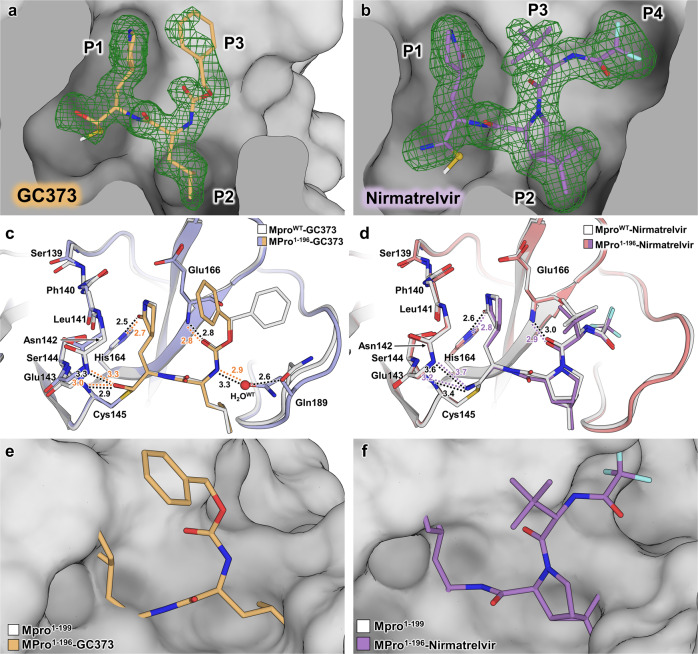
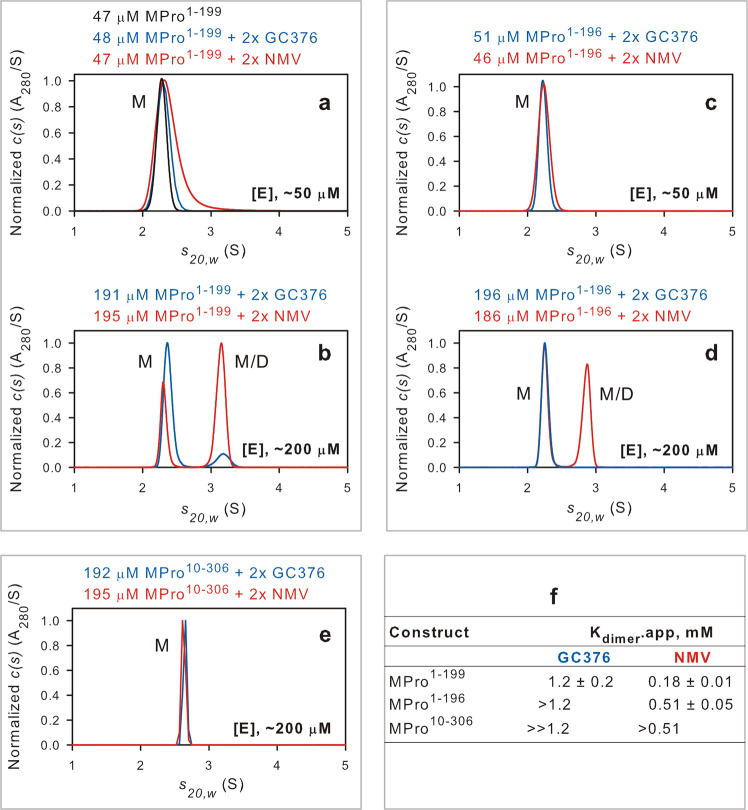
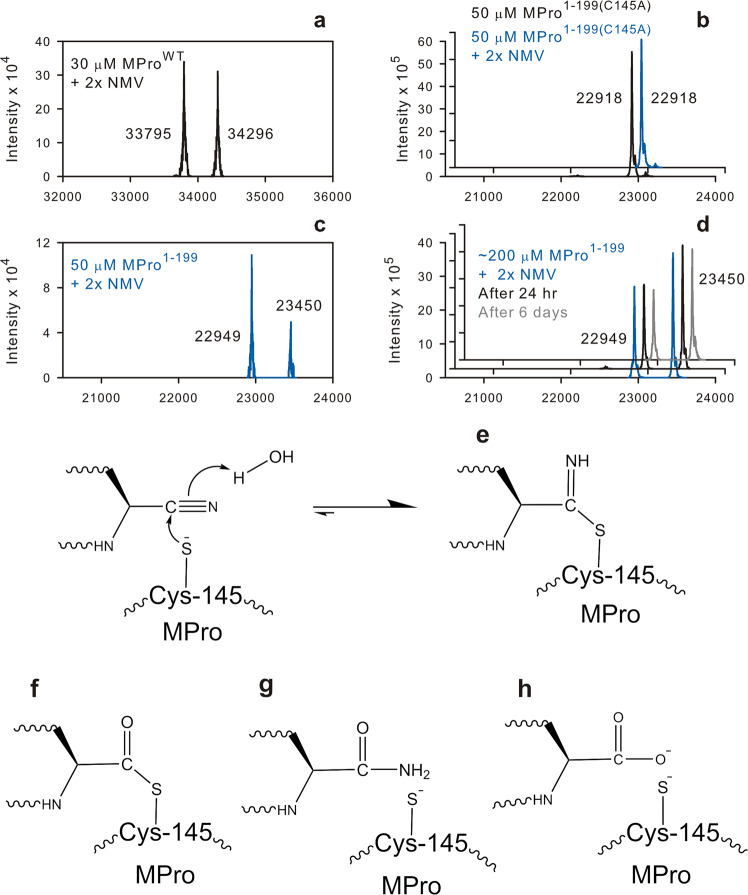
The monomeric catalytic domain (residues 1-199) of SARS-CoV-2 main protease (MPro1-199) fused to 25 amino acids of its flanking nsp4 region mediates its autoprocessing at the nsp4-MPro1-199 junction. We report the catalytic activity and the dissociation constants of MPro1-199 and its analogs with the covalent inhibitors GC373 and nirmatrelvir (NMV), and the estimated monomer-dimer equilibrium constants of these complexes. Mass spectrometry indicates the presence of the accumulated adduct of NMV bound to MProWT and MPro1-199 and not of GC373. A room temperature crystal structure reveals a native-like fold of the catalytic domain with an unwound oxyanion loop (E state). In contrast, the structure of a covalent complex of the catalytic domain-GC373 or NMV shows an oxyanion loop conformation (E* state) resembling the full-length mature dimer. These results suggest that the E-E* equilibrium modulates autoprocessing of the main protease when converting from a monomeric polyprotein precursor to the mature dimer.


Conflict of interest statement

The authors declare no competing interests.

Figures

Fig. 1
Fig. 1. Genome organization of SARS-CoV-2: molecular representation and role of the main protease (MPro).
a The ~30 kb genome codes for the various proteins in at least 12 open reading frames (ORFs). Two major polyproteins (pp) are encoded in ORFs, 1a (nsp1-nsp10) and 1ab (nsp1-nsp16), the processed proteins of which make up the replication/transcription complex. pp1ab is synthesized via a translation frameshifting (denoted FS) mechanism. The two virally encoded proteases PLPro (papain-like, green) and 3C-like main protease (MPro, blue) are responsible for the processing of pp1a and pp1ab. In the precursor form, MPro is anchored on either side with membrane spanning helices within nsp4 (red) and nsp6. MPro is responsible for its own release (termed self-cleavage or autoprocessing) and cleavage of the rest of the sites between nsp4 and nsp16. b Mature homodimeric MPro and regions critical for the modulation of the monomer-dimer (M-D) equilibrium. Subunits of the dimer are colored in blue and white. Regions defining the boundaries of domains are indicated. The loop region connecting the catalytic domain to the helical domain III (red) with D187, T196 and T199 residues shown as sticks. The free N-terminal strand, indispensable for inter- and intra-monomer interface contacts and dimer stability, is also shown in red just for the blue subunit.
Fig. 2
Fig. 2. Molecular mass estimation and catalytic activity of monomeric MPro1–199 and its miniprecursor.
a Molecular mass estimation of MPro1–199 by SEC-MALS. Fractionation was carried out as described in methods. The observed mass is indicated beside the peak. b SV-AUC absorbance c(s) distributions at loading concentrations of 201 and 184 µM of MPro1–199 and MPro1–196, respectively. c Linear relationship between the rate of catalyzed hydrolysis vs. the protein concentration of MPro1–199. d Lineweaver-Burk plot for hydrolysis of substrate by 90.5 µM MPro1–199. e N-terminal autoprocessing of the miniprecursor (−25)MPro1–199 upon its expression in E. coli. The precursor, product released upon cleavage at the N-terminus of MPro and molecular weight standards (M) are indicated in kDa. f Molecular mass estimation of (−25)MPro1-199(C145A) by SEC-MALS. The observed mass is indicated beside the peak. Fractionation was performed as described in Methods.
Fig. 3
Fig. 3. Binding isotherms of GC373 and NMV to MPro1–199.
Titrations were carried out with MPro1–199 (in the cell) vs. a GC373 and c NMV (in the syringe) in buffer C at 28 °C. Enlarged view of a few deflections are shown for comparison when titrated with GC373 (b) and NMV (d). A slow thermal response is observed for the interaction of NMV with MPro1–199. This slow response is not observed when titrating NMV with MProWT (ref. , Fig. S7a) or MProC145A (this work, Fig. S7b). Thermodynamic parameters are listed in Table 1.
Fig. 4
Fig. 4. Room-temperature X-ray crystal structures of inhibitor-free MPro1–199 display unwinding of oxyanion loop.
a MPro1–199 crystallized as two independent molecules in the asymmetric unit (molecule A: cyan cartoon with white surface, molecule B: mulberry surface). Inset shows MProWT (PDB ID 7JUN) crystallizes as one protomer per asymmetric unit with crystallographic symmetry generating the biologically active dimer assembly (helical domain from residues 201–306 shown as dark orange surface). b Superposition of MProWT to each independent MPro1–199 molecule indicates each MPro1–199 is a monomer that does not pack into the native dimer assembly. c Electron density of the oxyanion loop in MPro1–199 of molecule A (2Fo-Fc at 1σ, pink mesh). d Superposition of MProWT to MPro1–199 showing distance difference (Å) in protein backbone conformations as red arrows. In the absence of helical domain, Met130-Gly138 are in a different position and oxyanion loop residues 139–142 form a short helix. e Superposition of MProWT to MPro1–199 showing structural rearrangements of residues from positions in the native structure to the truncated structure as orange arrows. Hydrogen bonds for the flipped His172 sidechain are shown as dashed lines and all distances in Å. All superpositions performed as least-squares fit of Cα residues modeled in MPro1–199.
Fig. 5
Fig. 5. Room-temperature X-ray structures of MPro1–196 in complex with covalent inhibitors GC373 and NMV.
a, b Electron density of GC373 (orange sticks) and NMV (purple sticks) in the active site of MPro1–196 molecule A shown as Polder omit maps (green mesh contoured at 3σ). c, d Superposition of MProWT-inhibitor complex monomer with the equivalent MPro1–196-inhibitor complex (molecule B). The main chain of oxyanion loop residues 139–145 are shown creating the oxyanion hole and interacting with ligand. Hydrogen bonds represented as color-coded dashes with distances in Å. All distances are shown in Å. e, f Superposition of inhibitor-free MPro1–199 with the GC373 and NMV MPro1–196 complex, respectively. Inhibitor-free MPro1–199 represented as white surface where the conformational shifts described result in an occluded ligand-binding site. All superpositions performed as least-squares fit of Cα residues modeled in MPro1–199.
Fig. 6
Fig. 6. Estimation of the apparent Kdimer of MPro1–199, MPro1–196 and MPro10–306 in the presence of inhibitors.
SV-AUC absorbance c(s) distribution at ~50 µM (a, c) and ~200 µM (b, d, e) loading concentrations in the presence two-fold molar excess (2x) of either GC373 or NMV as indicated. [E] denotes enzyme concentration. Protein concentrations used in b, d, e match those recovered after ITC. f Apparent dimer dissociation constants in the presence of 2x inhibitor. Actual concentrations are indicated above the plots. M and M/D denote monomer and monomer/dimer equilibrium boundary, respectively.
Fig. 7
Fig. 7. Identification of NMV adduct bound to MPro constructs.
a, c Mass spectra of NMV adduct bound to MProWT and MPro1–199. a, d Samples recovered from the cell after ITC. Actual concentration of d is as shown for SV-AUC plot in Fig. 6b. Proteins were mixed with NMV at the indicated concentrations (b, c). Calculated masses are shown in Fig. S1 under each amino acid sequence of the corresponding construct. Black and gray traces in d indicate samples upon dilution to 20 µM and incubation for 24 h and 6 days, respectively, prior to subjecting 10 µl to RPLC-MS. eh Mechanism of formation of NMV-MPro imidate thioester and possible products of its hydrolysis. e Imidate ester, f thioester, g amide, and h carboxylic acid.
Fig. 8
Fig. 8. Inhibitor-binding induced conformational change of the oxyanion loop and dimerization of MPro1–199 and its analogs.
E, E* and I denote active site conformation of a monomer (E, inactive state) which is in equilibrium with an active state (E*) resembling the active dimer, and inhibitor, respectively. Inhibitor bound active states before (E*I) and after (E*-I) covalent bond formation. K−2 is slow for NMV because of adduct formation in solution and not for GC373 for which no adduct could be observed by RPLC-MS.

Similar articles

Cited by

References

    1. V’kovski P, Kratzel A, Steiner S, Stalder H, Thiel V. Coronavirus biology and replication: implications for SARS-CoV-2. Nat. Rev. Microbiol. 2020;19:155–170. doi: 10.1038/s41579-020-00468-6. - DOI - PMC - PubMed
    1. Wu F, et al. A new coronavirus associated with human respiratory disease in China. Nature. 2020;579:265–269. doi: 10.1038/s41586-020-2008-3. - DOI - PMC - PubMed
    1. Zhang L, et al. Crystal structure of SARS-CoV-2 main protease provides a basis for design of improved alpha-ketoamide inhibitors. Science. 2020;368:409–412. doi: 10.1126/science.abb3405. - DOI - PMC - PubMed
    1. Mariano G, Farthing RJ, Lale-Farjat SLM, Bergeron JRC. Structural characterization of SARS-CoV-2: where we are, and where we need to be. Front. Mol. Biosci. 2020;7:605236. doi: 10.3389/fmolb.2020.605236. - DOI - PMC - PubMed
    1. Wang C, et al. The establishment of reference sequence for SARS-CoV-2 and variation analysis. J. Med. Virol. 2020;92:667–674. doi: 10.1002/jmv.25762. - DOI - PMC - PubMed

Publication types