. 2022 Sep 16;19(1):21.
doi: 10.1186/s12977-022-00607-2.

Replication-competent HIV-1 in human alveolar macrophages and monocytes despite nucleotide pools with elevated dUTP

Affiliations

Replication-competent HIV-1 in human alveolar macrophages and monocytes despite nucleotide pools with elevated dUTP

Junru Cui et al. Retrovirology. .

Abstract

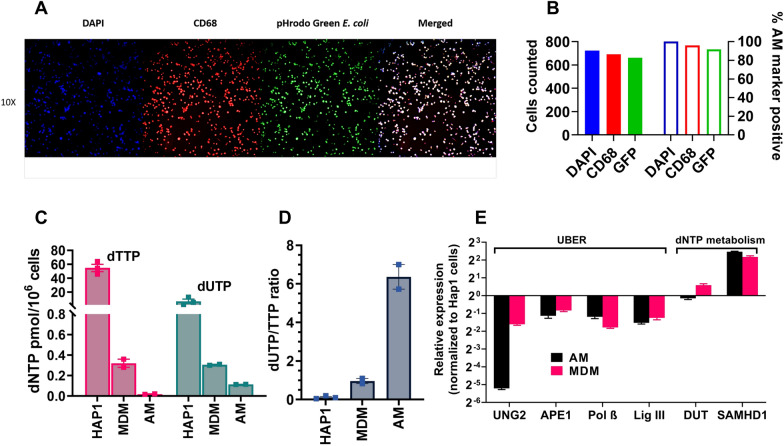
Background: Although CD4+ memory T cells are considered the primary latent reservoir for HIV-1, replication competent HIV has been detected in tissue macrophages in both animal and human studies. During in vitro HIV infection, the depleted nucleotide pool and high dUTP levels in monocyte derived macrophages (MDM) leads to proviruses with high levels of dUMP, which has been implicated in viral restriction or reduced transcription depending on the uracil base excision repair (UBER) competence of the macrophage. Incorporated dUMP has also been detected in viral DNA from circulating monocytes (MC) and alveolar macrophages (AM) of HIV infected patients on antiretroviral therapy (ART), establishing the biological relevance of this phenotype but not the replicative capacity of dUMP-containing proviruses.

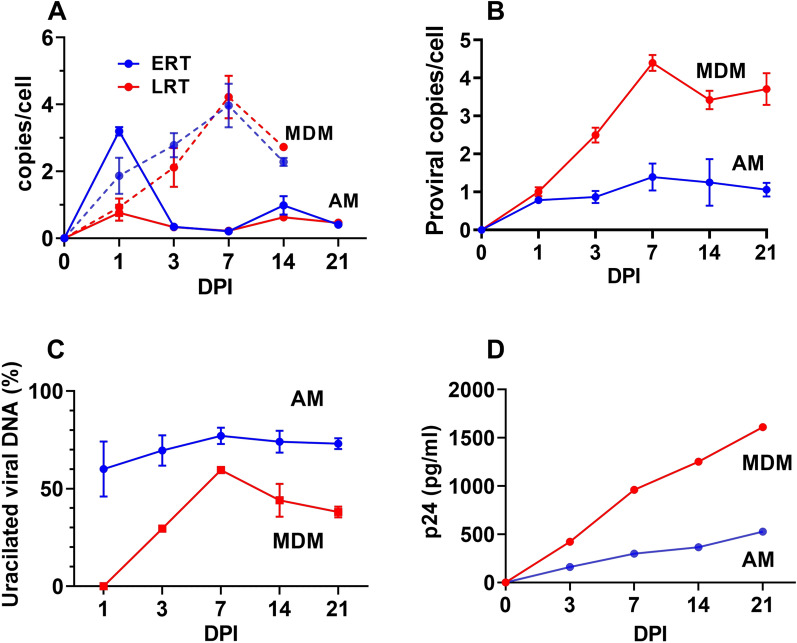
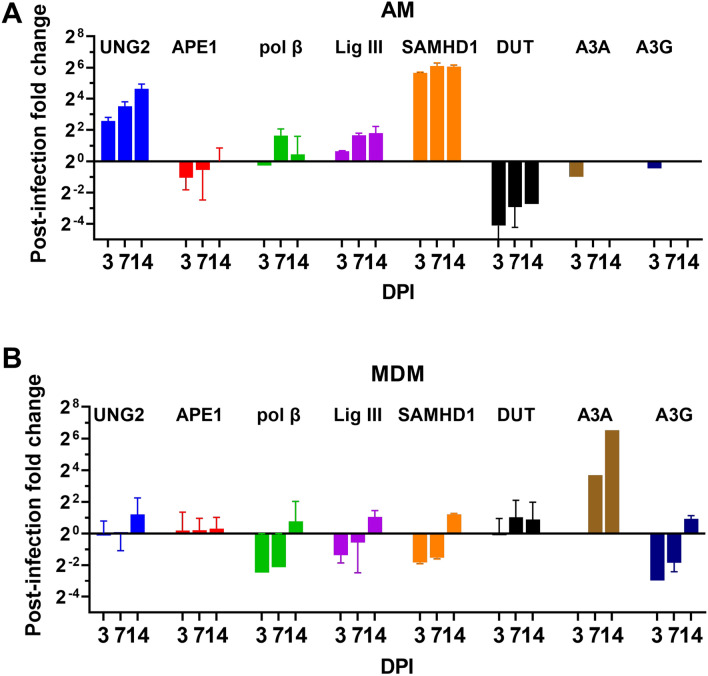
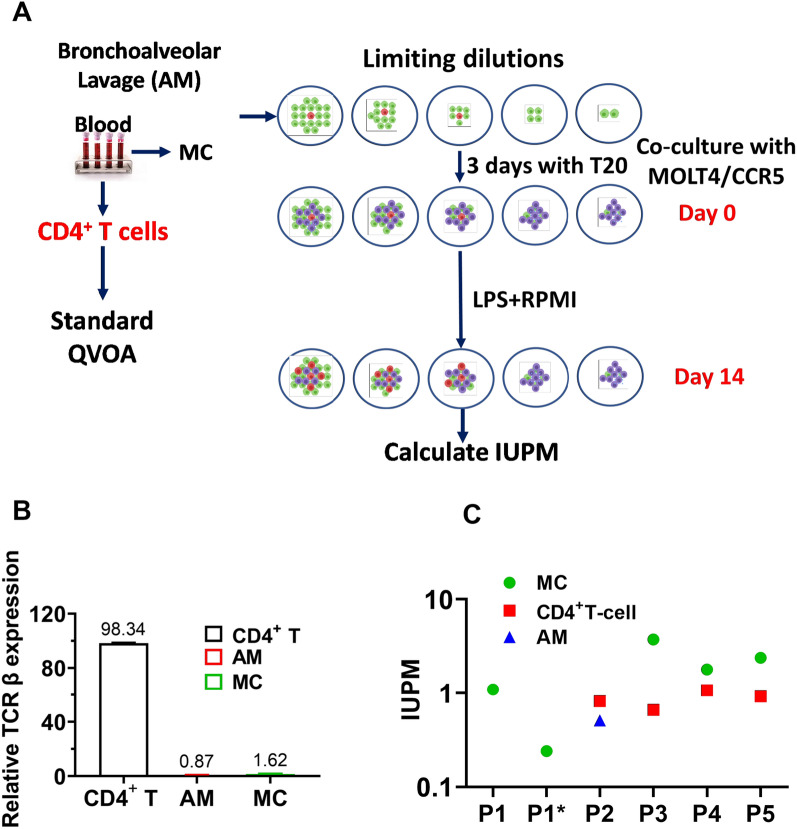
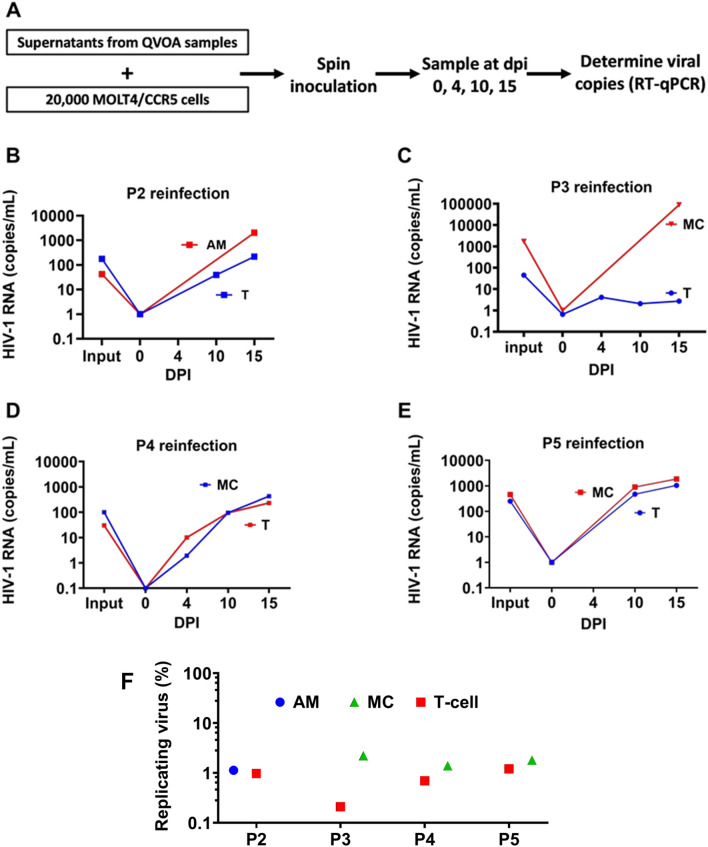
Results: As compared to in vitro differentiated MDM, AM from normal donors had sixfold lower levels of dTTP and a sixfold increased dUTP/dTTP, indicating a highly restrictive dNTP pool for reverse transcription. Expression of uracil DNA glycosylase (UNG) was eightfold lower in AM compared to the already low levels in MDM. Accordingly, ~ 80% of HIV proviruses contained dUMP, which persisted for at least 14-days due to low UNG excision activity. Unlike MDM, AM expression levels of UNG and SAM and HD domain containing deoxynucleoside triphosphate triphosphohydrolase 1 (SAMHD1) increased over 14 days post-HIV infection, while dUTP nucleotidohydrolase (DUT) expression decreased. These AM-specific effects suggest a restriction response centered on excising uracil from viral DNA copies and increasing relative dUTP levels. Despite the restrictive nucleotide pools, we detected rare replication competent HIV in AM, peripheral MC, and CD4+ T cells from ART-treated donors.

Conclusions: These findings indicate that the potential integration block of incorporated dUMP is not realized during in vivo infection of AM and MC due to the near absence of UBER activity. In addition, the increased expression of UNG and SAMHD1 in AM post-infection is too slow to prevent integration. Accordingly, dUMP persists in integrated viruses, which based on in vitro studies, can lead to transcriptional silencing. This possible silencing outcome of persistent dUMP could promote viral latency until the repressive effects of viral dUMP are reversed.

Keywords: Alveolar macrophage; Human HIV-1 infection; Monocyte; Nucleotide pools; Replication competent virus; Uracil base excision repair.


Conflict of interest statement

The authors declare that they have no competing interests.

Figures

Fig. 1
Fig. 1
Confirmation of in vivo AM phenotype and comparison of dTTP, dUTP nucleotide and UBER enzyme levels with that of MDM. A Fluorescence microscopy of AM stained with DAPI DNA stain (blue), CD68 cell surface marker (red) and pHrodo Green E. coli metabolic marker (green). An enlarged merged image is shown on the right. B AM cells in A were counted using ImageJ and the percent of DAPI stained cells that were also stained with the other two markers was calculated. C dUTP and dTTP levels in extracts from dividing HAP1 cells, non-dividing MDM, and AM cells as determined using a single nucleotide extension assay (SNE) (Additional file 1: Fig. S1). The in vitro differentiated MDM and the in vivo differentiated AM cells were from the same healthy donors. D dUTP/dTTP ratio in extracts from dividing HAP1 cells, non-dividing MDM, and AM cells. E Baseline mRNA expression levels of proteins involved in uracil base excision repair (UBER) and dNTP metabolism in AM and MDM cells. Expression levels were normalized to dividing HAP1 cells for comparison purposes. 18S ribosomal RNA was used as the calibration standard in all measurements. Error bars represents SD, the mean was calculated with three biological replicates for HAP1 cells, and from two healthy donors for the AM and MDM data
Fig. 2
Fig. 2
Comparison of in vitro infection of AM and MDM with HIVBal. A Kinetics for appearance of early (ERT) and late (LRT) reverse transcripts in AM and MDM as determined by RT-qPCR. The RPP30 gene was used to calculate the average transcript copies per cell. Sequences and probes are listed in Additional file 1: Table S1. B Kinetics for appearance of proviral DNA copies in MDM and AM as determined by alu-gag qPCR. C Percentage of proviruses present in MDM and AM that contain dUMP as determined by alu-gag Ex-qPCR. D Viral protein 24 (p24) levels in culture supernatants of infected AM and MDM were measured by ELISA. The supernatant p24 levels are from identical infections (MOI = 1) using equal numbers of plated target cells (50,000 per well in 96-well plate). Errors are means with standard deviations, N = 2 for AC. For panel D,  N = 1
Fig. 3
Fig. 3
UBER gene expression in AM and MDM post-infection with HIVBal. A RT-qPCR was used to measure the time-dependent changes in mRNA levels of the indicated enzymes post-infection of AM. B Time-dependent changes in mRNA levels of the indicated enzymes post-infection of MDM. AM data was collected from one healthy donor and the errors are from three technical replicates. The MDM data is the average from three healthy donors. The fold-change in copy number is relative to the levels before infection and the 18S ribosomal RNA expression was used as the calibration standard for all samples. All primers are listed in Additional file 1: Table S1. Errors are means with standard deviations, N = 2 for AM and N = 3 for MDM (where N is number of donors)
Fig. 4
Fig. 4
Replication competent HIV-1 detected by QVOA from AM, MC and T cells of HIV patients under suppressive ART. A Monocytes and CD4+ T cells from blood and AMs from BAL fluid were collected from five HIV-infected patients and purified by T cell pan isolation kit. T cells were first cultured for three days using stimulating conditions and then plated in serial dilutions into three to five wells. Monocytes purified by the pan monocyte isolation kit were checked for T-cell contamination by RT-qPCR using TCR-β primer pairs (98.38 ± 0.43% purity). MDM were generated by culturing MC under adherent conditions for seven days in the presence of M-CSF, and the cells were serially diluted into three to five wells. AM were plated directly in 3–5 serial dilution wells. Cells were cultured in the presence of the HIV fusion/entry inhibitor T20 (Enfuvirtide) as indicated. Nonadherent cells and T20 were removed prior to activation with LPS and coculturing with MOLT4/CCR5 cells. B TCR β RNA levels detected in QVOA lysates of T, MC and AM cells were measured by RT-qPCR using a seven-point standard curve established by serial dilution. The relative expression percent was normalized to CD4+ T cells. The mean is the average of three donors. Errors are means with standard deviations, N = 3 for AM, T and MC, where N is number of donors. (C) The infectious units per million cells (IUPM) of AM, MC and CD4+ T cells were determined using RT-qPCR (N = 3, the error bars are smaller than the data points). The IUPM calculations used the online Infection Frequency Calculator which utilizes limiting dilution Poisson statistics and the number of positive wells and the input number of cells as the input parameters (https://silicianolab.johnshopkins.edu)
Fig. 5
Fig. 5
Viruses collected from QVOA supernatants of AM, MC and T cells can establish de novo infection. A Supernatants from QVOA positive wells were used to separately spin infect 200,000 MOLT4/CCR5 cells using serial dilutions. Supernatants were collected at days 0, 4, 10, and 15 after spin infection and HIV RNA copies were determined using RT-qPCR. B Reinfection kinetics of AM and T cells obtained from P2 QVOA supernatant. C Reinfection kinetics of MC and T cells obtained from P3 QVOA supernatant. D Reinfection kinetics of MC and T cells obtained from P4 QVOA supernatant. E Reinfection kinetics of MC and T cells obtained from P5 QVOA supernatant. F Percentage of replicating viral particles in HIV RNA copies detected in QVOA. HIV RNA copies in the culture supernatants were measured by RT-qPCR and the frequency of replicating viral particles was calculated using an Infection Frequency Calculator that utilizes limiting dilution statistics (https://silicianolab.johnshopkins.edu). The replicating virus percentage of AM, MC, and T cells for each patient assayed is shown. The data in B, C, D, and E show the mean value of three technical replicates. The RNA copies for each patient in panel F were measured in three replicates. The error bars are smaller than the data points in the graph
Fig. 6
Fig. 6
Sequence analyses of virus produced in MC, AM, and CD4+ T cell QVOA. A The HIV-1 genome structure and the region targeted for sequencing is shown. The first PCR (6953-7530) and second PCR (7015-7374) regions were targeted by nested PCR primers using cDNA obtained from AM, MC, and T cell QVOA’s from P2 to P5. The purified amplicons (359 bp) were then sequenced using Illumina MiSeq. B Outline of the stepwise procedure used in targeted amplicon sequencing. C Major env amino acid sequences derived from sequencing extracellular viral RNAs produced in QVOAs. The consensus reference sequence is derived from 2635 HIV-1 clinical isolates. Boxed regions at the protein sequence level show the mutation spectrum within the CD4-associated and co-receptor binding sites. The positions are relative to the HXB3 strain. Sequences derived from myeloid cell infections are indicated in blue [either monocyte (M) or alveolar macrophage (AM)] and sequences obtained from T cell infections are in red with the numerical patient identification shown in Tables 1 and 2. The major variant percentages are indicated

Similar articles

Cited by

References

    1. Cox N, Pokrovskii M, Vicario R, Geissmann F. Origins, biology, and diseases of tissue macrophages. Annu Rev Immunol. 2021;39:313–344. doi: 10.1146/annurev-immunol-093019-111748. - DOI - PMC - PubMed
    1. Wong ME, Jaworowski A, Hearps AC. The HIV reservoir in monocytes and macrophages. Front Immunol. 2019;10:1435. doi: 10.3389/fimmu.2019.01435. - DOI - PMC - PubMed
    1. Collman RG, Yi Y, Liu QH, Freedman BD. Chemokine signaling and HIV-1 fusion mediated by macrophage CXCR4: implications for target cell tropism. J Leukoc Biol Suppl. 2000 doi: 10.1189/jlb.68.3.318. - DOI - PubMed
    1. Jaggi U, et al. Increased phagocytosis in the presence of enhanced M2-like macrophage responses correlates with increased primary and latent HSV-1 infection. PLoS Pathog. 2020;16:e1008971. doi: 10.1371/journal.ppat.1008971. - DOI - PMC - PubMed
    1. Ferreira IATM, Porterfield JZ, Gupta RK, Mlcochova P. Cell cycle regulation in macrophages and susceptibility to HIV-1. Viruses. 2020;12:839. doi: 10.3390/v12080839. - DOI - PMC - PubMed

Publication types