

Methanogens and Hydrogen Sulfide Producing Bacteria Guide Distinct Gut Microbe Profiles and Irritable Bowel Syndrome Subtypes
- PMID: 36114762
- PMCID: PMC9722381
- DOI: 10.14309/ajg.0000000000001997
Methanogens and Hydrogen Sulfide Producing Bacteria Guide Distinct Gut Microbe Profiles and Irritable Bowel Syndrome Subtypes
Abstract
Introduction: Irritable bowel syndrome (IBS) includes diarrhea-predominant (IBS-D) and constipation-predominant (IBS-C) subtypes. We combined breath testing and stool microbiome sequencing to identify potential microbial drivers of IBS subtypes.
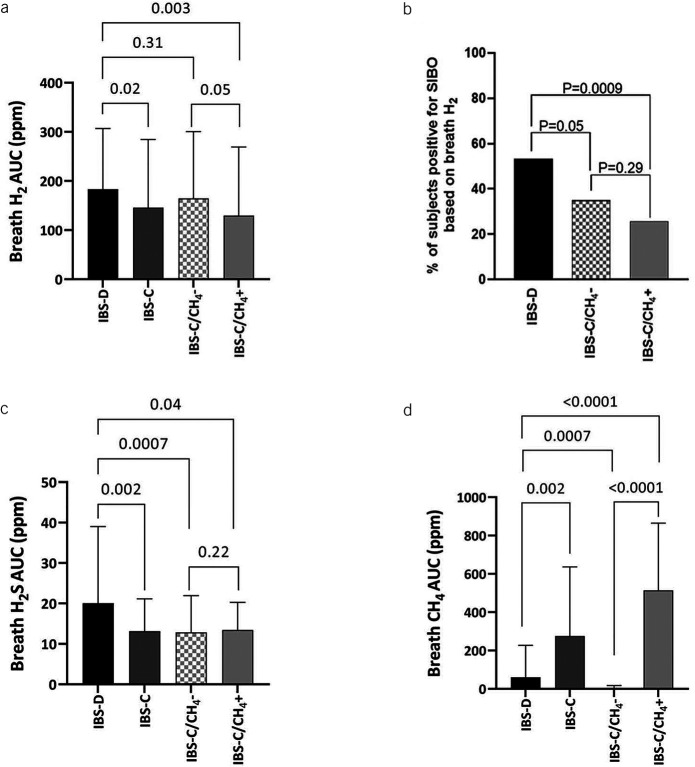
Methods: IBS-C and IBS-D subjects from 2 randomized controlled trials (NCT03763175 and NCT04557215) were included. Baseline breath carbon dioxide, hydrogen (H 2 ), methane (CH 4 ), and hydrogen sulfide (H 2 S) levels were measured by gas chromatography, and baseline stool microbiome composition was analyzed by 16S rRNA sequencing. Microbial metabolic pathways were analyzed using Kyoto Encyclopedia of Genes and Genomes collection databases.
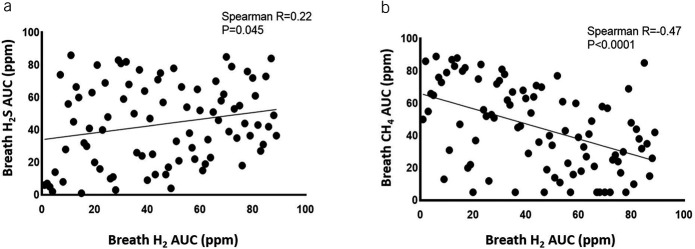
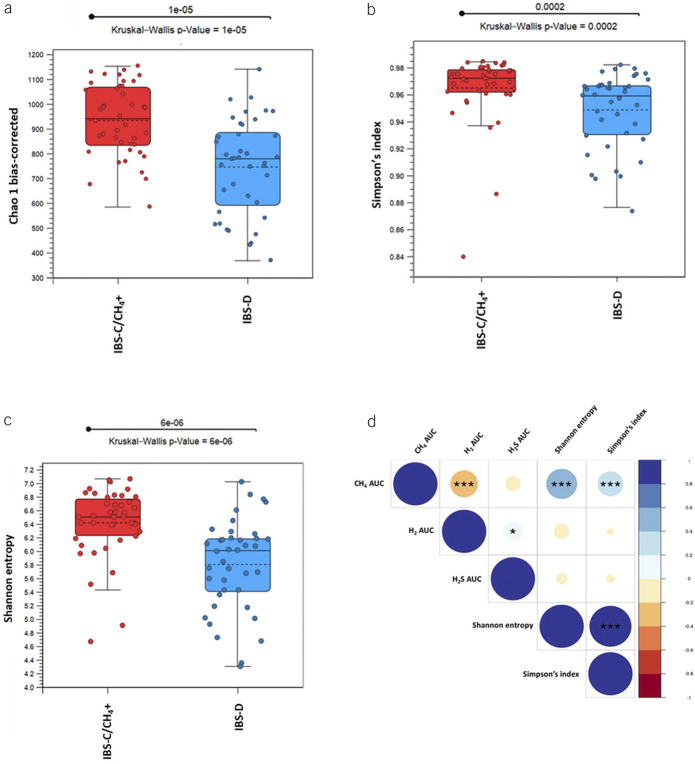
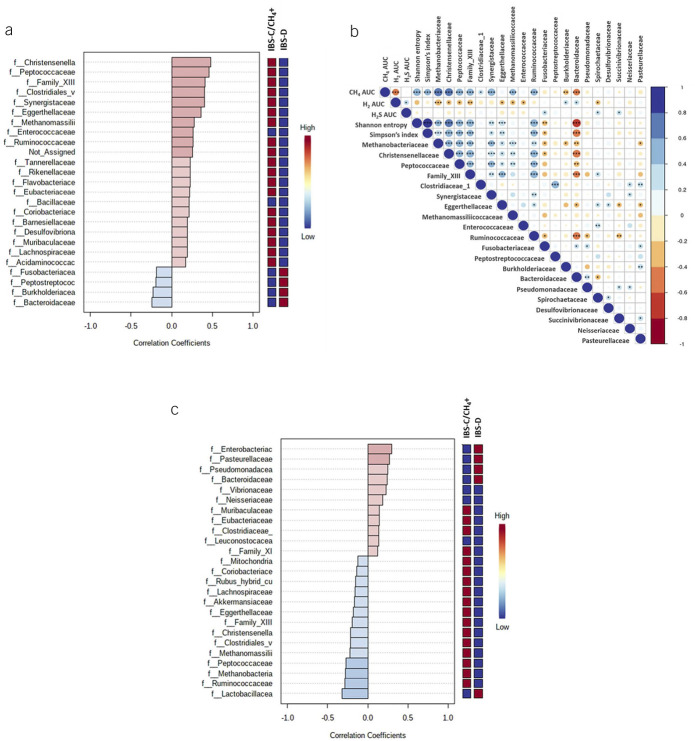
Results: IBS-C subjects had higher breath CH 4 that correlated with higher gut microbial diversity and higher relative abundance (RA) of stool methanogens, predominantly Methanobrevibacter , as well as higher absolute abundance of Methanobrevibacter smithii in stool. IBS-D subjects had higher breath H 2 that correlated with lower microbial diversity and higher breath H 2 S that correlated with higher RA of H 2 S-producing bacteria, including Fusobacterium and Desulfovibrio spp. The predominant H 2 producers were different in these distinct microtypes, with higher RA of Ruminococcaceae and Christensenellaceae in IBS-C/CH 4 + (which correlated with Methanobacteriaceae RA) and higher Enterobacteriaceae RA in IBS-D. Finally, microbial metabolic pathway analysis revealed enrichment of Kyoto Encyclopedia of Genes and Genomes modules associated with methanogenesis and biosynthesis of methanogenesis cofactor F420 in IBS-C/CH 4 + subjects, whereas modules associated with H 2 S production, including sulfate reduction pathways, were enriched in IBS-D.
Discussion: Our findings identify distinct gut microtypes linked to breath gas patterns in IBS-C and IBS-D subjects, driven by methanogens such as M. smithii and H 2 S producers such as Fusobacterium and Desulfovibrio spp, respectively.
Copyright © 2022 The Author(s). Published by Wolters Kluwer Health, Inc. on behalf of The American College of Gastroenterology.
Figures
References
-
- Black CJ, Ford AC. Global burden of irritable bowel syndrome: Trends, predictions and risk factors. Nat Rev Gastroenterol Hepatol 2020;17:473–86. - PubMed
-
- Ford AC, Sperber AD, Corsetti M, et al. . Irritable bowel syndrome. Lancet 2020;396:1675–88. - PubMed
-
- Singh P, Lembo A. Emerging role of the gut microbiome in irritable bowel syndrome. Gastroenterol Clin North Am 2021;50:523–45. - PubMed
-
- Shah A, Talley NJ, Jones M, et al. . Small intestinal bacterial overgrowth in irritable bowel syndrome: A systematic review and meta-analysis of case-control studies. Am J Gastroenterol 2020;115:190–201. - PubMed
Publication types
MeSH terms
Substances
Associated data
LinkOut - more resources
Full Text Sources
Medical
Molecular Biology Databases
Miscellaneous
