. 2022 Dec;122(12):2637-2650.
doi: 10.1007/s00421-022-05038-7. Epub 2022 Sep 17.

Anaerobic work capacity in cycling: the effect of computational method

Affiliations

Anaerobic work capacity in cycling: the effect of computational method

Erik P Andersson et al. Eur J Appl Physiol. 2022 Dec.

Abstract

Purpose: To compare the anaerobic work capacity (AnWC, i.e., attributable anaerobic mechanical work) assessed using four different approaches/models applied to time-trial (TT) cycle-ergometry exercise.

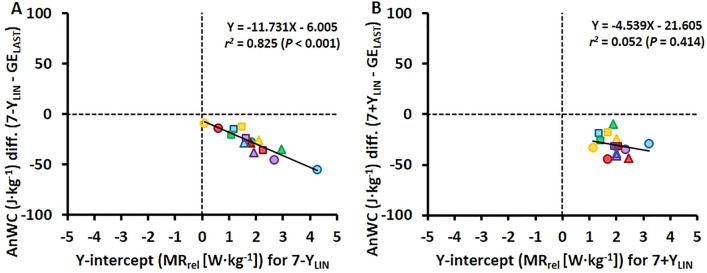
Methods: Fifteen male cyclists completed a 7 × 4-min submaximal protocol and a 3-min all-out TT (TTAO). Linear relationships between power output (PO) and submaximal metabolic rate were constructed to estimate TT-specific gross efficiency (GE) and AnWC, using either a measured resting metabolic rate as a Y-intercept (7 + YLIN) or no measured Y-intercept (7-YLIN). In addition, GE of the last submaximal bout (GELAST) was used to estimate AnWC, and critical power (CP) from TTAO (CP3´AO) was used to estimate mechanical work above CP (W', i.e., "AnWC").

Results: Average PO during TTAO was 5.43 ± 0.30 and CP was 4.48 ± 0.23 W∙kg-1. The TT-associated GE values were ~ 22.0% for both 7 + YLIN and 7-YLIN and ~ 21.1% for GELAST (both P < 0.001). The AnWC were 269 ± 60, 272 ± 55, 299 ± 61, and 196 ± 52 J∙kg-1 for the 7 + YLIN, 7-YLIN, GELAST, and CP3´AO models, respectively (7 + YLIN and 7-YLIN versus GELAST, both P < 0.001; 7 + YLIN, 7-YLIN, and GELAST versus CP3´AO, all P < 0.01). For the three pair-wise comparisons between 7 + YLIN, 7-YLIN, and GELAST, typical errors in AnWC values ranged from 7 to 11 J∙kg-1, whereas 7 + YLIN, 7-YLIN, and GELAST versus CP3´AO revealed typical errors of 55-59 J∙kg-1.

Conclusion: These findings demonstrate a substantial disagreement in AnWC between CP3´AO and the other models. The 7 + YLIN and 7-YLIN generated 10% lower AnWC values than the GELAST model, whereas 7 + YLIN and 7-YLIN generated similar values of AnWC.

Keywords: All-out pacing; Maximal accumulated oxygen deficit method; Metabolic demand; Reliability; Supramaximal exercise; Time trial.


Conflict of interest statement

None to declare.

Figures

Fig. 1
Fig. 1
A schematic overview of the testing protocol where participants performed a 3-min all-out time trial (TTAO). After a 3-min baseline measure of oxygen consumption (3´ B) and a 6-min warm-up (6´ W-up), the 7 × 4-min submaximal exercise stages were performed and followed by a 6-min passive break (6´ PB). Capillary blood samples for the determination of blood lactate concentration (La) were collected prior to and immediately after the submaximal stages and 1-min before and 2-min after the TT. Abbreviations: ´, minute; v˙o2peak, peak oxygen consumption; SUB, sub-maximal
Fig. 2
Fig. 2
Data based on 7 stages of submaximal exercise followed by a 3-min supramaximal all-out time trial (TTAO) (A-D). A The two regression models between mean ± standard deviation power output (PO) and metabolic rate during 7 × 4-min stages of continuous cycle ergometry exercise and the regression line calculated based on the gross efficiency (GE) from the last submaximal stage (GELAST) together with the estimated total metabolic requirements (diamonds) at the average PO attained during the 3-min time trial. The red line is the linear relationship when using a Y-intercept (7 + YLIN) for baseline metabolic rate, the black solid line when excluding a Y-intercept value (7-YLIN), and the yellow line is the regression line based on GELAST (i.e., with the slope being the reciprocal value of GE); B GE as mean ± standard deviation for the seven 4-min stages of submaximal cycling and GE calculated from the two regression equations (i.e., 7 + YLIN and 7-YLIN) for the submaximal stages and the TT; (C) Total PO (PO) and aerobic power contribution (based on GELAST) presented as second-by-second average time-trial data and the estimated critical power (CP); (D) The mean anaerobic work capacity (AnWC) and 95% confidence interval together with individual data (colored symbols). F values, P values, eta-squared effect size (n2), and standard error of measurement (SEM) were obtained with a repeated measures ANOVA. #Significantly different from GELAST, P ≤ 0.001; $Significantly different from CP, P ≤ 0.030
Fig. 3
Fig. 3
Individual data (N = 15, 5 in each of the three horizontal panels) based on 7 × 4-min of submaximal exercise followed by a 3-min supramaximal all-out TT (TTAO). Regressions for metabolic rate plotted against cycling power output (PO) based on the 7 × 4-min submaximal stages and the extrapolation up to the average PO during TTAO including a Y-intercept value, i.e., baseline metabolic rate, (7 + YLIN) (A) and when excluding a Y-intercept value (7-YLIN) in the respective regressions (B). Gross efficiency calculated from the two linear regression equations (GEREG) for the submaximal stages and the TT, with values from 7 + YLIN in C and values from 7-YLIN in D. Directly measured values of GE based on the seven submaximal stages (E). Individual values of anaerobic work capacity (AnWC) calculated with the three different methods (F), where the 7 + YLIN and 7-YLIN are the two linear models, and the GELAST model is based on the GE value from the last submaximal stage
Fig. 4
Fig. 4
Bland–Altman plots for the four various models of estimating anaerobic work capacity (AnWC) associated with the 3-min all-out cycle time trial (TTAO) in AF. Bland–Altman plots represent the mean difference (MEANDIFF) in the AnWC ± 95% (1.96 standard deviations) limits of agreement between the methods. Abbreviations: AnWCDIFF, the difference in AnWC; TE, absolute typical error (in parenthesis: typical error expressed as a percentage of the grand mean); ES, Hedges’s gav effect size (Hgav), 7 + YLIN and 7-YLIN, the 7 × 4-min linear regression methods with the baseline metabolic rate as a Y-intercept either included (7 + Y) or excluded (7-Y); GELAST, the gross efficiency model based on the last submaximal stage; CP3´AO, the critical power model based on the average 30-s end power during TTAO as critical power. The same symbols used to illustrate individual data in Fig. 3 have also been used in this figure
Fig. 5
Fig. 5
Scatter plots between the Y-intercept values for the 7 × 4-min linear regression models with the baseline metabolic rate (MR) as a Y-intercept either excluded (7-YLIN) or included (7 + YLIN) in the model (x-axis) and the anaerobic work capacity difference (AnWC diff.) versus the gross efficiency method based on the last submaximal stage (GELAST) (y-axis)

References

    1. Andersson EP, Noordhof DA, Lögdal N. The anaerobic capacity of cross-country skiers: the effect of computational method and skiing sub-technique. Front Sports Act Living. 2020 doi: 10.3389/fspor.2020.00037. - DOI - PMC - PubMed
    1. Andersson EP, Björklund G, McGawley K. Anaerobic capacity in running: the effect of computational method. Front Physiol. 2021 doi: 10.3389/fphys.2021.708172. - DOI - PMC - PubMed
    1. Andersson EP, McGawley K. A comparison between different methods of estimating anaerobic energy production. Front Physiol. 2018;9:82. doi: 10.3389/fphys.2018.00082. - DOI - PMC - PubMed
    1. Bartram JC, Thewlis D, Martin DT, Norton KI. Predicting critical power in elite cyclists: questioning the validity of the 3-minute all-out test. Int J Sports Physiol Perform. 2017;12(6):783–787. doi: 10.1123/ijspp.2016-0376. - DOI - PubMed
    1. Bland JM, Altman DG. Measuring agreement in method comparison studies. Stat Methods Med Res. 1999;8(2):135–160. doi: 10.1177/096228029900800204. - DOI - PubMed

LinkOut - more resources