. 2022 Oct:171:103229.
doi: 10.1016/j.jhevol.2022.103229. Epub 2022 Sep 15.

Variability in energy expenditure is much greater in males than females

Lewis G Halsey  1 Vincent Careau  2 Herman Pontzer  3 Philip N Ainslie  4 Lene F Andersen  5 Liam J Anderson  6 Lenore Arab  7 Issad Baddou  8 Kweku Bedu-Addo  9 Ellen E Blaak  10 Stephane Blanc  11 Alberto G Bonomi  12 Carlijn V C Bouten  13 Pascal Bovet  14 Maciej S Buchowski  15 Nancy F Butte  16 Stefan G J A Camps  17 Graeme L Close  4 Jamie A Cooper  18 Sai Krupa Das  19 Richard Cooper  20 Lara R Dugas  21 Ulf Ekelund  22 Sonja Entringer  23 Terrence Forrester  24 Barry W Fudge  25 Annelies H Goris  10 Michael Gurven  26 Catherine Hambly  27 Asmaa El Hamdouchi  8 Marije B Hoos  10 Sumei Hu  28 Noorjehan Joonas  29 Annemiek M Joosen  10 Peter Katzmarzyk  30 Kitty P Kempen  10 Misaka Kimura  31 William E Kraus  32 Robert F Kushner  33 Estelle V Lambert  34 William R Leonard  35 Nader Lessan  36 Corby K Martin  30 Anine C Medin  37 Erwin P Meijer  10 James C Morehen  38 James P Morton  4 Marian L Neuhouser  39 Theresa A Nicklas  16 Robert M Ojiambo  40 Kirsi H Pietiläinen  41 Yannis P Pitsiladis  42 Jacob Plange-Rhule  9 Guy Plasqui  43 Ross L Prentice  39 Roberto A Rabinovich  44 Susan B Racette  45 David A Raichlen  46 Eric Ravussin  30 Rebecca M Reynolds  47 Susan B Roberts  19 Albertine J Schuit  48 Anders M Sjödin  49 Eric Stice  50 Samuel S Urlacher  51 Giulio Valenti  52 Ludo M Van Etten  10 Edgar A Van Mil  53 George Wilson  4 Brian M Wood  54 Jack Yanovski  55 Tsukasa Yoshida  31 Xueying Zhang  56 Alexia J Murphy-Alford  57 Cornelia U Loechl  57 Amy H Luke  58 Jennifer Rood  59 Hiroyuki Sagayama  60 Dale A Schoeller  61 Klaas R Westerterp  62 William W Wong  63 Yosuke Yamada  64 John R Speakman  65
Affiliations

Variability in energy expenditure is much greater in males than females

Lewis G Halsey et al. J Hum Evol. 2022 Oct.

Abstract

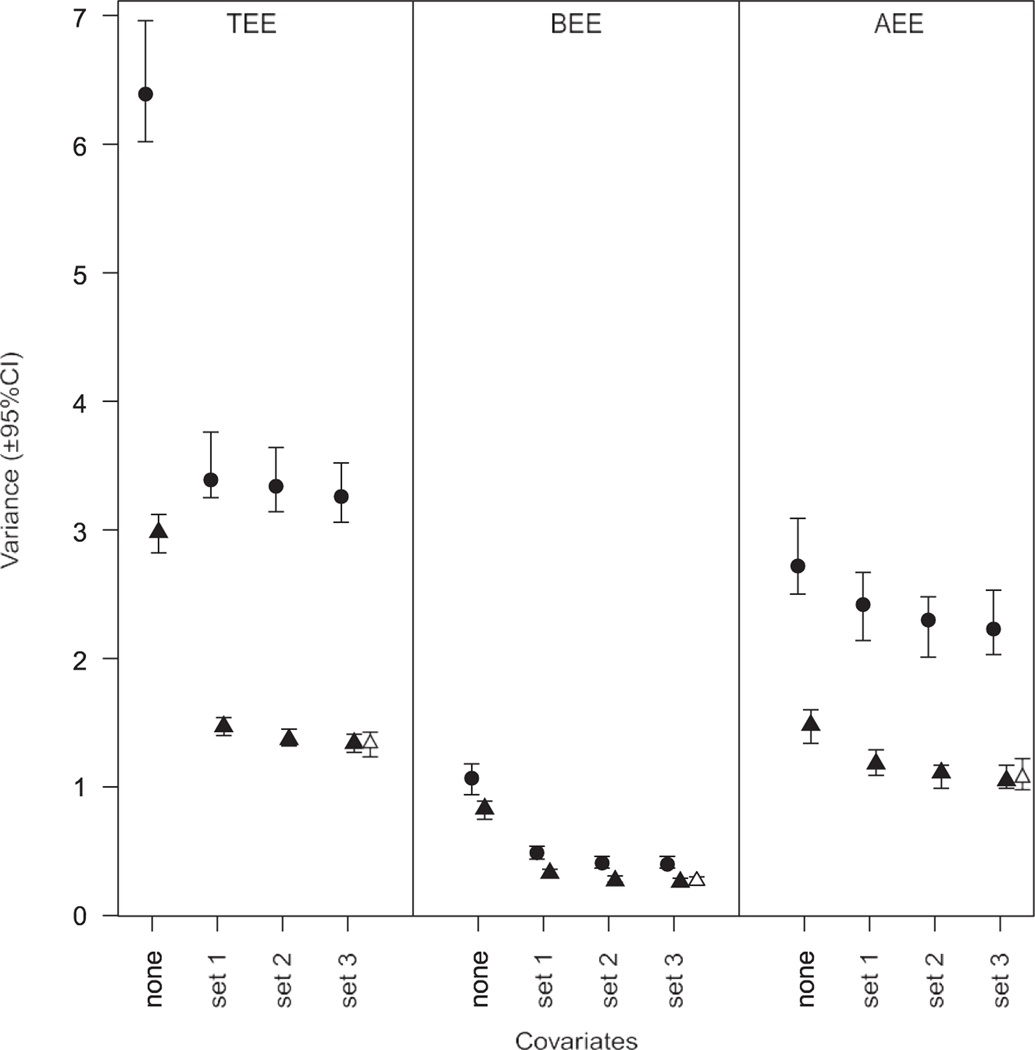
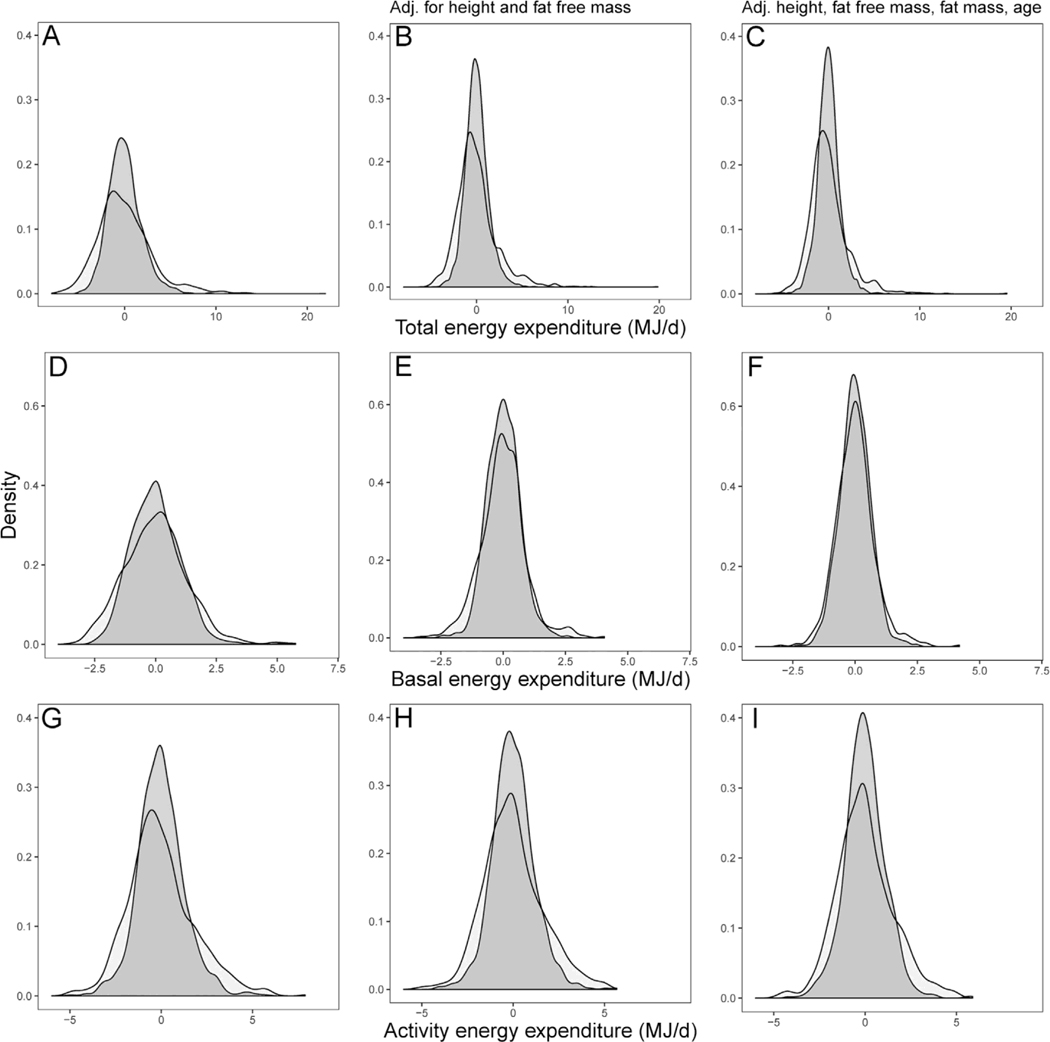
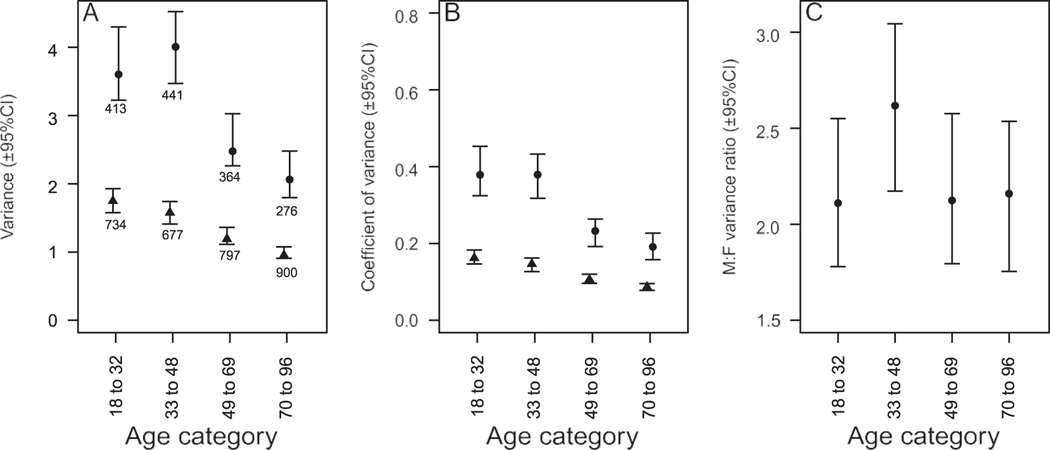
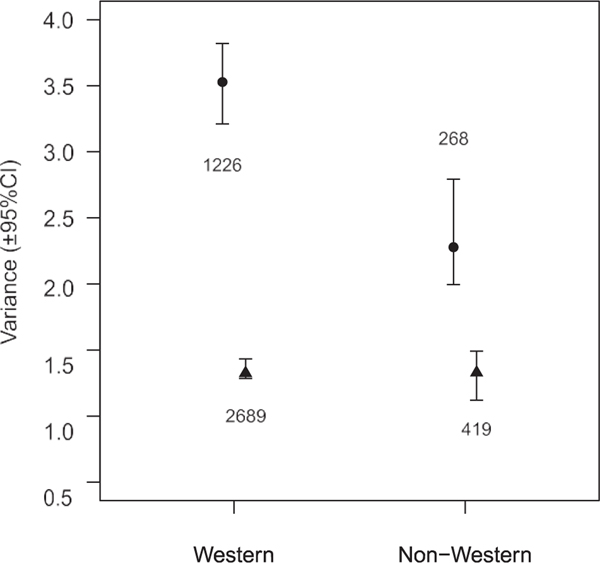
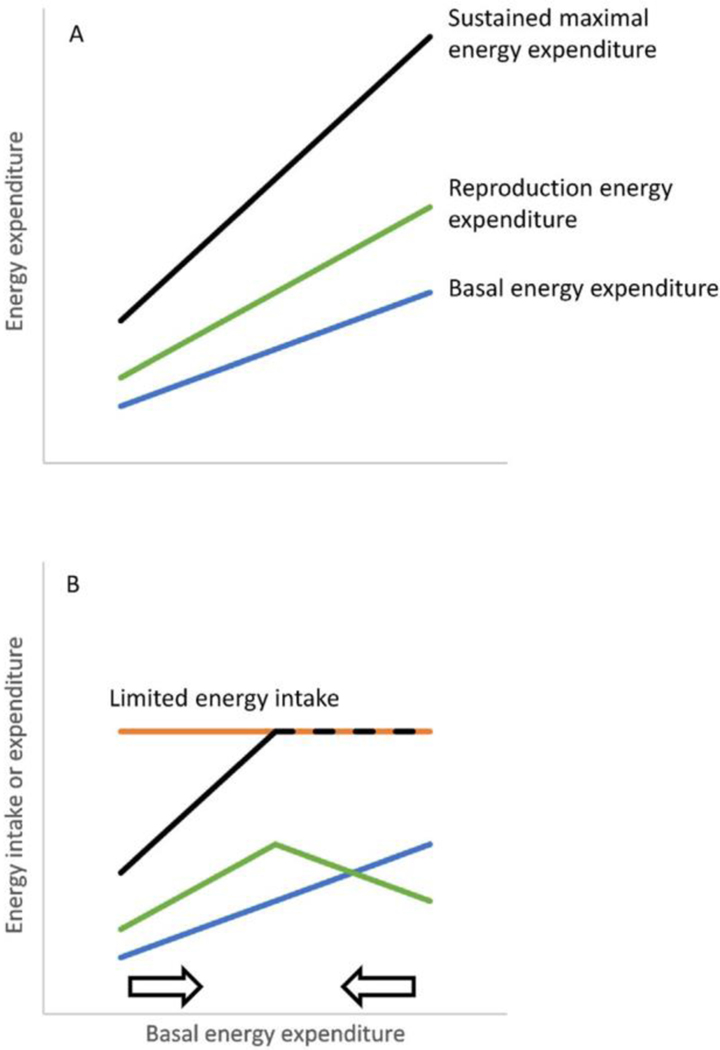
In mammals, trait variation is often reported to be greater among males than females. However, to date, mainly only morphological traits have been studied. Energy expenditure represents the metabolic costs of multiple physical, physiological, and behavioral traits. Energy expenditure could exhibit particularly high greater male variation through a cumulative effect if those traits mostly exhibit greater male variation, or a lack of greater male variation if many of them do not. Sex differences in energy expenditure variation have been little explored. We analyzed a large database on energy expenditure in adult humans (1494 males and 3108 females) to investigate whether humans have evolved sex differences in the degree of interindividual variation in energy expenditure. We found that, even when statistically comparing males and females of the same age, height, and body composition, there is much more variation in total, activity, and basal energy expenditure among males. However, with aging, variation in total energy expenditure decreases, and because this happens more rapidly in males, the magnitude of greater male variation, though still large, is attenuated in older age groups. Considerably greater male variation in both total and activity energy expenditure could be explained by greater male variation in levels of daily activity. The considerably greater male variation in basal energy expenditure is remarkable and may be explained, at least in part, by greater male variation in the size of energy-demanding organs. If energy expenditure is a trait that is of indirect interest to females when choosing a sexual partner, this would suggest that energy expenditure is under sexual selection. However, we present a novel energetics model demonstrating that it is also possible that females have been under stabilizing selection pressure for an intermediate basal energy expenditure to maximize energy available for reproduction.

Keywords: Activity; Biological sex; DLW; Energetics; Trait variability.


Conflict of interest statement

Conflicts of interest The authors have no conflicts of interest to declare.

Figures

Figure 1.
Figure 1.
Male (closed circles) and female (closed triangles) variance for A) total energy expenditure (TEE), B) basal energy expenditure (BEE), and C) activity energy expenditure (AEE). While within sex variance differs considerably between TEE, BEE, and AEE, in each case, male variance is greater than female variance. Values shown are the posterior modes with 95% highest posterior density credible intervals (CI) for the sex-specific residual variance estimates extracted from models that did not include covariates (‘none’), and models that included three sets of covariates such as height and fat-free mass (set 1), height, fat-free mass, fat mass, and age (set 2), and height, fat-free mass, fat mass, age, and sex-specific nonlinear age and body composition effects (set 3). The open symbols show the variance estimates in females obtained from an analysis restricted to a data set in which sample size was randomly reduced to equal that of males.
Figure 2.
Figure 2.
Histograms of total energy expenditure (TEE; AeC), basal energy expenditure (BEE; DeF), and activity energy expenditure (AEE; GeI) for adult males (dark grey) and females (light grey). A) Absolute TEE; B) TEE adjusted for height and fat-free mass (set 1); C) TEE adjusted for height, fat-free mass, fat mass, and age (set 2). D) Absolute BEE; E) BEE adjusted for height and fat-free mass (set 1); F) BEE adjusted for height, fat-free mass, fat mass, and age (set 2). G) Absolute AEE; H) AEE adjusted for height and fat-free mass (set 1); I) AEE adjusted for height, fat-free mass, fat mass, and age (set 2). In each panel, male variance is greater than female variance.
Figure 3.
Figure 3.
Age-specific A) variance and B) coefficient of variance in total energy expenditure in males (circles) and females (triangles) and C) male:female variance ratio. The amount of greater male variability (GMV) remains fairly constant across age categories. Values shown are the posterior modes with 95% highest posterior density credible intervals (95% CIs) extracted from a single model that included multiple covariates and sex-specific nonlinear aging and body condition effects. Numbers shown below the symbols are the sample sizes for each category.
Figure 4.
Figure 4.
Male (circles) and female (triangles) variance for total energy expenditure disaggregated into Western countries and non-Western countries. Values shown are the posterior modes with 95% highest posterior density credible intervals (CIs) for the sex-specific residual variance estimates extracted from models that included height, fat-free mass, fat mass, age, and sex-specific nonlinear age and body composition ef- fects, and country as a random factor. Numbers shown by the symbols are the sample sizes for each category. Variance in total energy expenditure among males is much higher in Western than non-Western countries, whereas the variance among females is similar in Western and non-Western countries; thus, the magnitude of greater male variability is decreased in non-Western countries.
Figure 5.
Figure 5.
Conceptual model of energy availability during pregnancy in relation to basal energy expenditure (BEE). A) Sustained maximal energy expenditure is a multiple of BEE. Consequently, the energy potentially available for reproduction (calculated as sustained maximal energy expenditure minus BEE) is higher in females with a higher BEE. B) If food availability is limited, then energy intake can create a limit to sustained maximal energy expenditure (dashed line) and in turn, energy available for reproduction is not only low for females with a low BEE but also for females with a high BEE; it is highest when BEE is an intermediate value. The arrows denote selection against the extremes of low BEE and high BEE.

References

    1. Althoff T, Sosi c R, Hicks JL, King AC, Delp SL, Leskovec J, 2017. Large-scale physical activity data reveal worldwide activity inequality. Nature 547, 336e339. - PMC - PubMed
    1. Ban DJ, Lee TJ, 2001. Sleep duration, subjective sleep disturbances and associated factors among university students in Korea. J. Korean Med. Sci. 16, 475. - PMC - PubMed
    1. Bateman AJ, 1948. Intra-sexual selection in drosophila. Heredity 2, 349e368. - PubMed
    1. Baye A, Monseur C, 2016. Gender differences in variability and extreme scores in an international context. Large-scale Assess. Educ 4, 1.
    1. Belia S, Fidler F, Williams J, Cumming G, 2005. Researchers misunderstand confidence intervals and standard error bars. Psychol. Methods 10, 389. - PubMed

Publication types