. 2022 Nov;298(11):102497.
doi: 10.1016/j.jbc.2022.102497. Epub 2022 Sep 15.

Pentacyclic triterpenoid ursolic acid interferes with mast cell activation via a lipid-centric mechanism affecting FcεRI signalosome functions

Affiliations

Pentacyclic triterpenoid ursolic acid interferes with mast cell activation via a lipid-centric mechanism affecting FcεRI signalosome functions

Gouse M Shaik et al. J Biol Chem. 2022 Nov.

Abstract

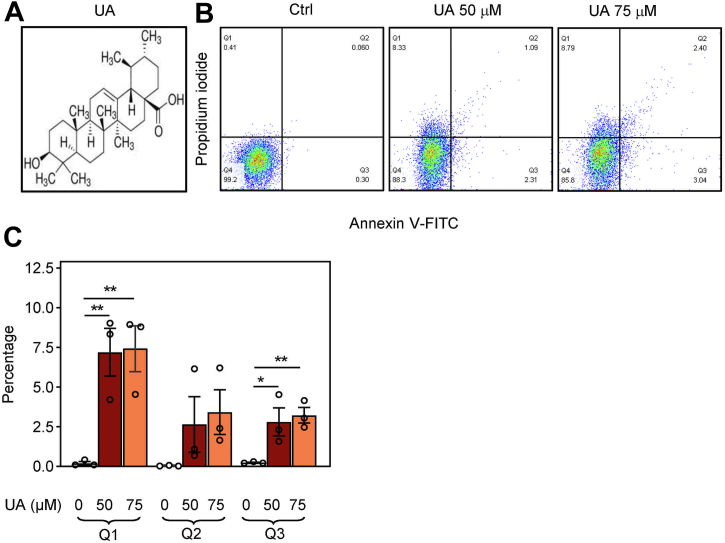
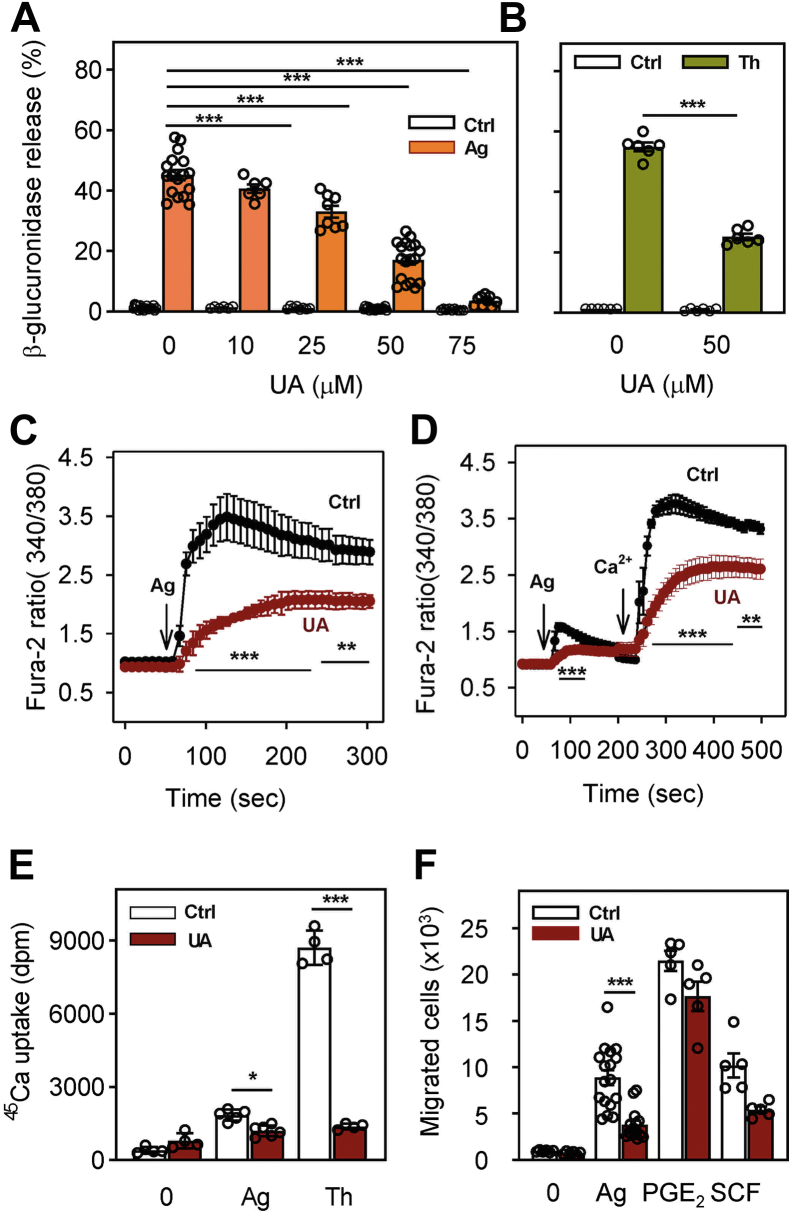
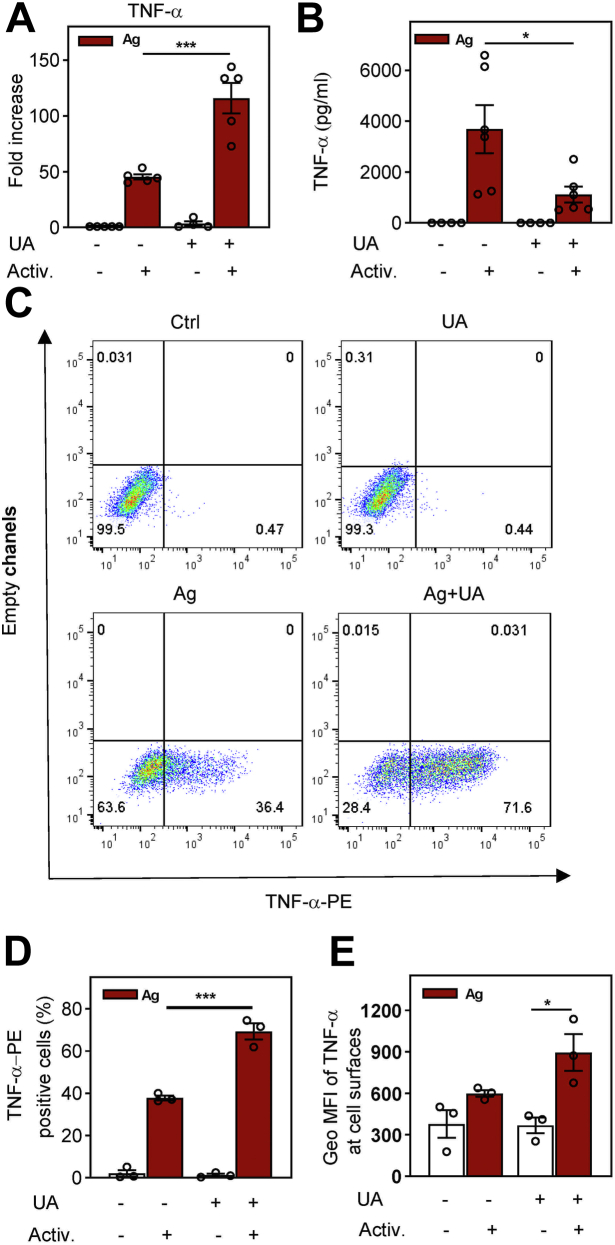
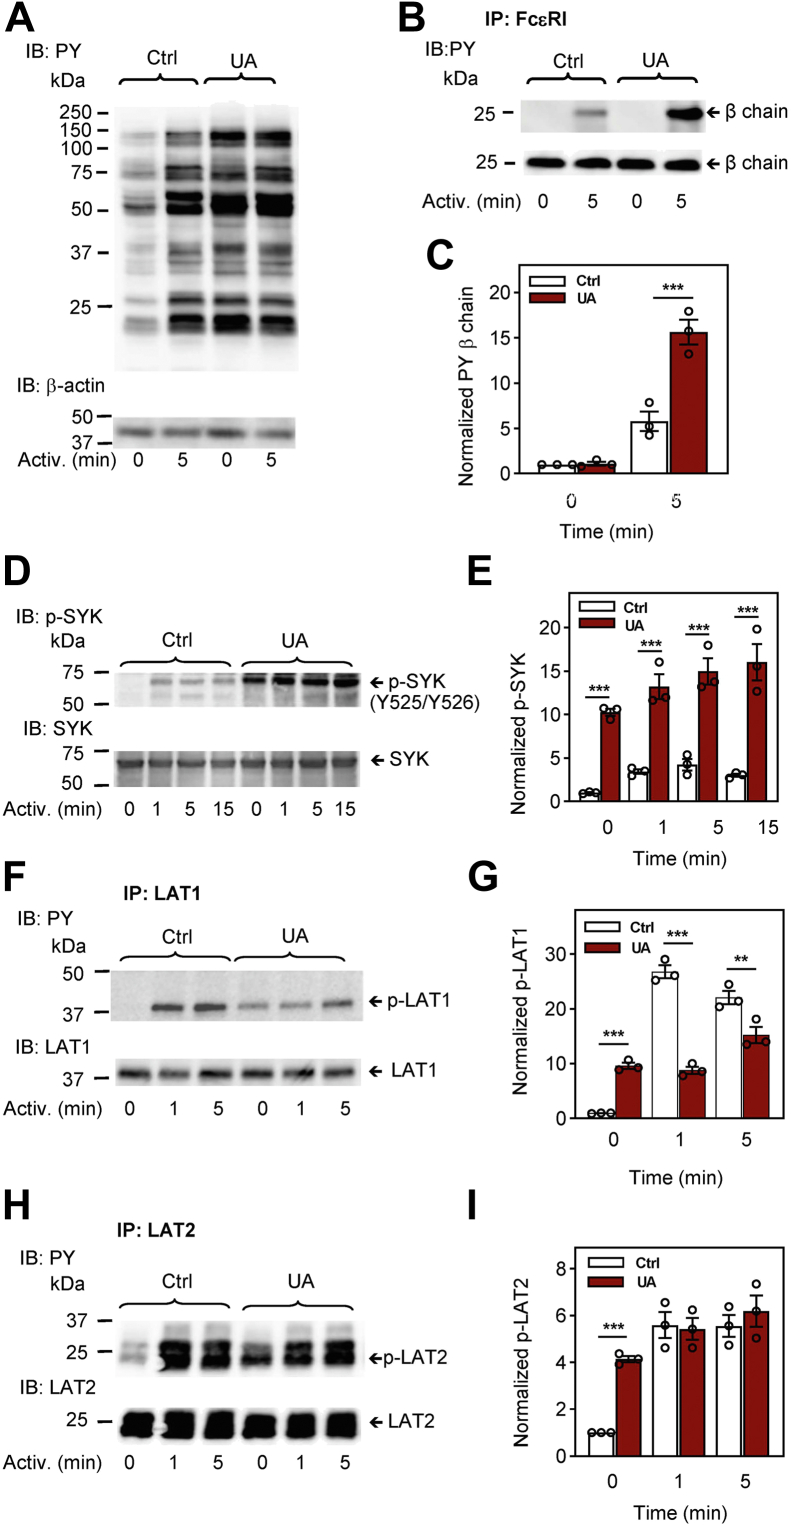
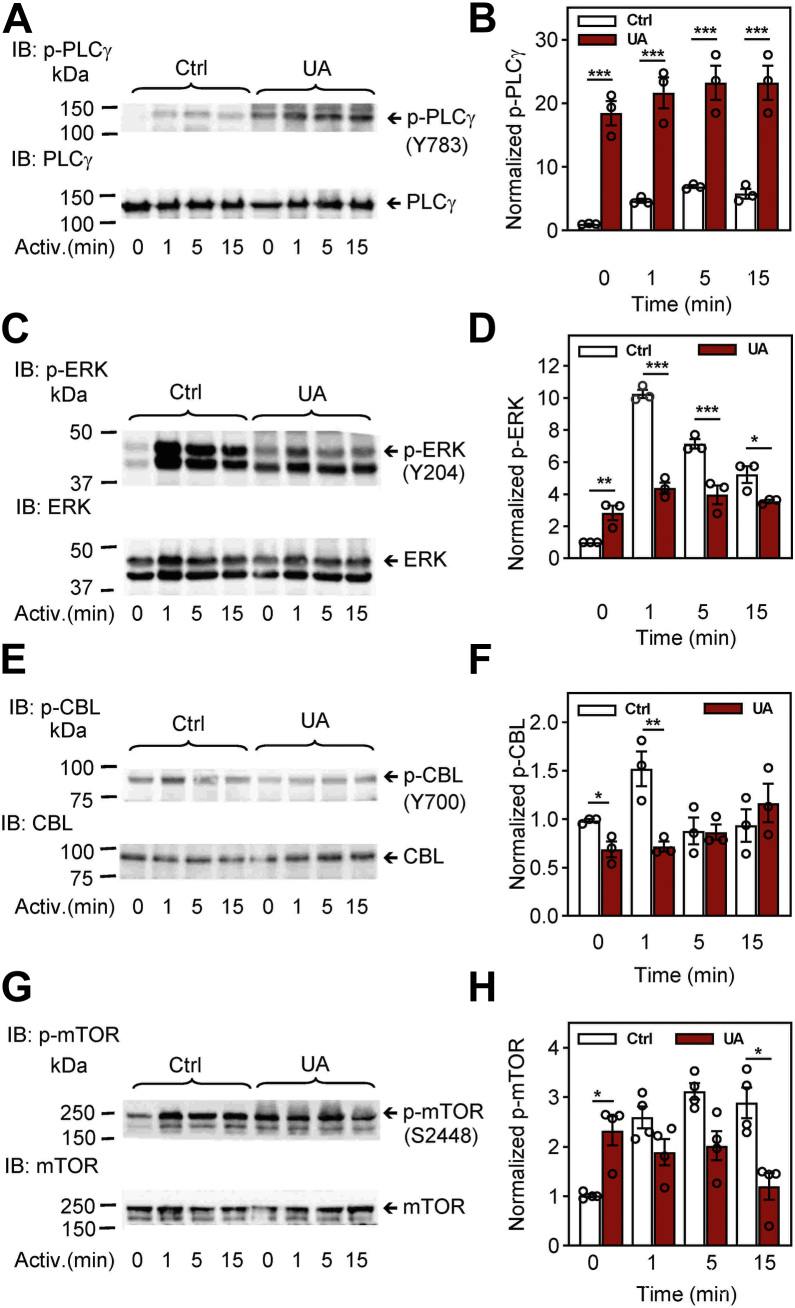
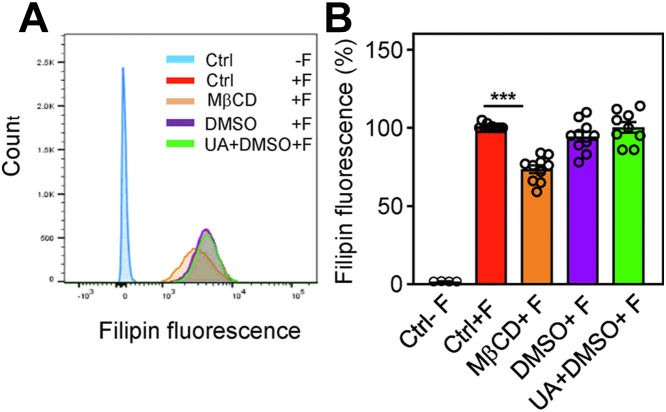
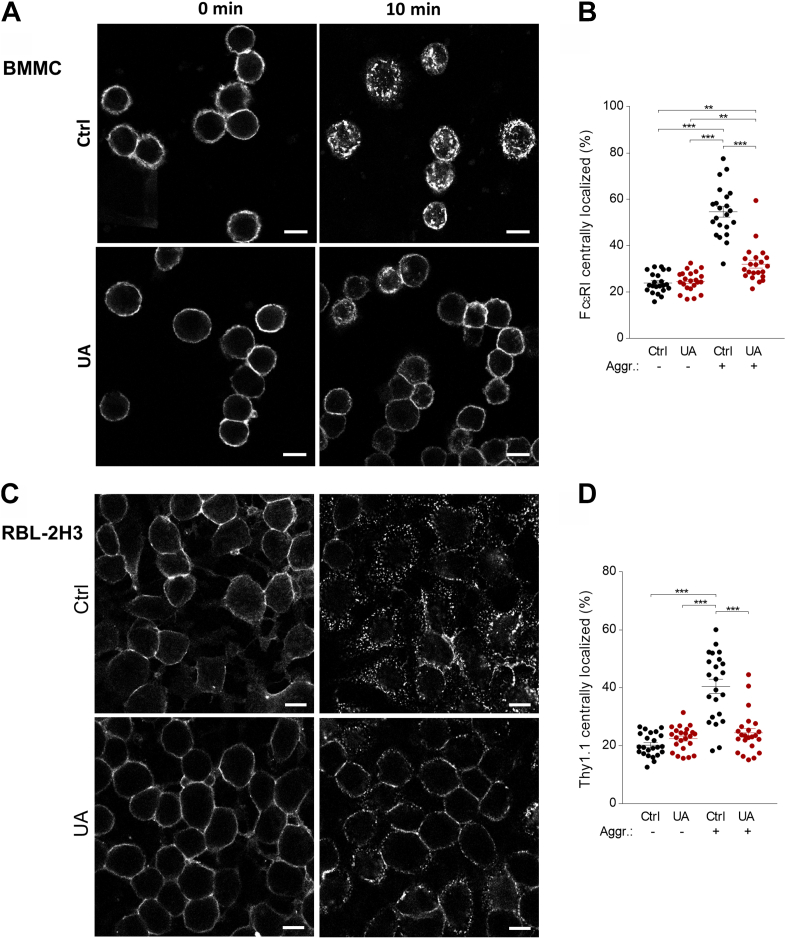
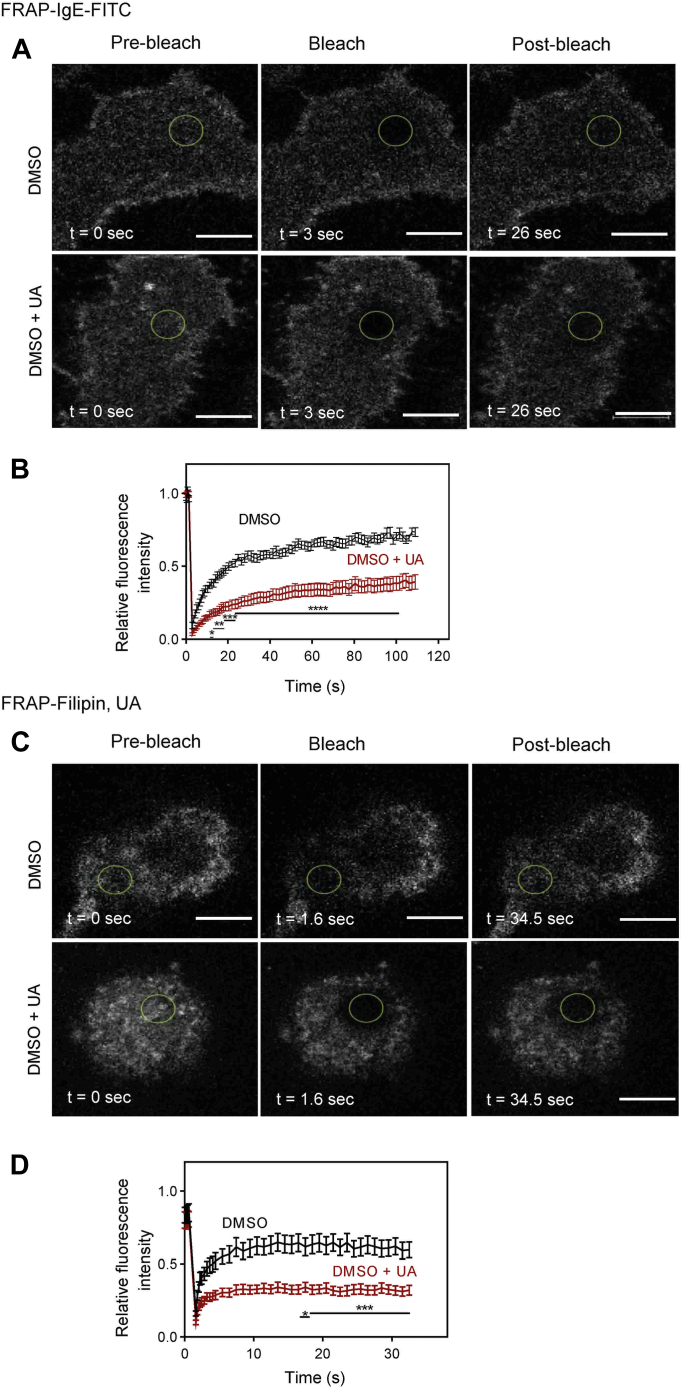
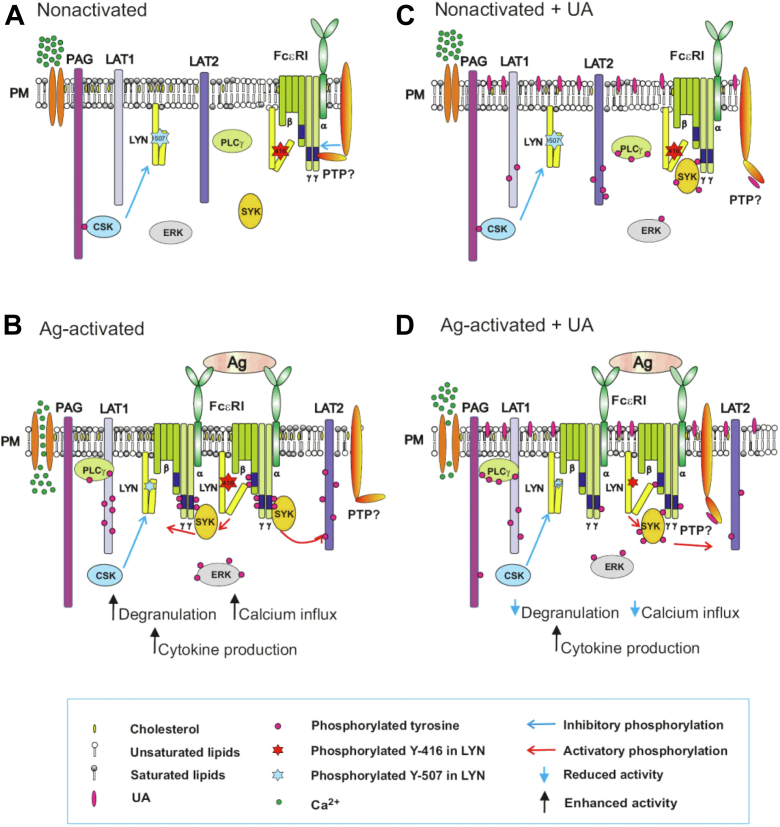
Pentacyclic triterpenoids, including ursolic acid (UA), are bioactive compounds with multiple biological activities involving anti-inflammatory effects. However, the mode of their action on mast cells, key players in the early stages of allergic inflammation, and underlying molecular mechanisms remain enigmatic. To better understand the effect of UA on mast cell signaling, here we examined the consequences of short-term treatment of mouse bone marrow-derived mast cells with UA. Using IgE-sensitized and antigen- or thapsigargin-activated cells, we found that 15 min exposure to UA inhibited high affinity IgE receptor (FcεRI)-mediated degranulation, calcium response, and extracellular calcium uptake. We also found that UA inhibited migration of mouse bone marrow-derived mast cells toward antigen but not toward prostaglandin E2 and stem cell factor. Compared to control antigen-activated cells, UA enhanced the production of tumor necrosis factor-α at the mRNA and protein levels. However, secretion of this cytokine was inhibited. Further analysis showed that UA enhanced tyrosine phosphorylation of the SYK kinase and several other proteins involved in the early stages of FcεRI signaling, even in the absence of antigen activation, but inhibited or reduced their further phosphorylation at later stages. In addition, we show that UA induced changes in the properties of detergent-resistant plasma membrane microdomains and reduced antibody-mediated clustering of the FcεRI and glycosylphosphatidylinositol-anchored protein Thy-1. Finally, UA inhibited mobility of the FcεRI and cholesterol. These combined data suggest that UA exerts its effects, at least in part, via lipid-centric plasma membrane perturbations, hence affecting the functions of the FcεRI signalosome.

Keywords: immunoglobulin E; lipid raft; mast cell; plasma membrane; signal transduction; tumor necrosis factor; tyrosine kinase.


Conflict of interest statement

Conflicts of interest The authors declare that they have no conflict of interest with the contents of this article.

Figures

Figure 1
Figure 1
Increased phosphatidylserine plasma membrane expression and propidium iodide (PI) staining in BMMCs exposed to UA.A, chemical structure of UA. B, flow cytometry analysis of cells exposed for 15 min to BSS-0.1% BSA supplemented with 0.1% DMSO, used as a control (Ctrl), or UA at a concentration of 50 μM or 75 μM. The cells were stained for phosphatidylserine expression with annexin V-FITC conjugate and for membrane integrity with propidium iodide. The percentage of positive cells in individual quadrants (Q) from a typical experiment is also shown. C, data from three independent experiments performed as in (B) were analyzed, and mean values ± SEMs in quadrants Q1, Q2, and Q3 were calculated. Statistical significance of the intergroup differences is also shown. BMMC, bone marrow-derived mast cells; DMSO, dimethyl sulfoxide; UA, ursolic acid.
Figure 2
Figure 2
UA inhibits antigen-induced mast cell degranulation, calcium responses, and chemotaxis.A, IgE-sensitized BMMCs were preincubated for 15 min with vehicle (0.1% DMSO) or various concentrations of UA (10–75 μM), which was also present during antigen-mediated activation. Fifteen minutes after adding antigen (Ag; 250 ng/ml TNP-BSA in BSS-0.1% BSA) or BSS-0.1% BSA alone (Ctrl), degranulation was quantified by analysis of β-glucuronidase levels. B, BMMCs were exposed for 15 min to 50 μM UA or vehicle (0.1% DMSO). The cells were activated with 1 μM thapsigargin (Th) or were exposed to BSS-0.1% BSA (Ctrl). Degranulation was determined after 15 min as above. C, IgE-sensitized and Fura-2-loaded BMMCs were preincubated with 50 μM UA or vehicle (0.1% DMSO; Ctrl) in BSS containing 1.8 mM Ca2+. After 15 min, the cells were activated by antigen (Ag; 250 ng/ml TNP-BSA) at the time point indicated by an arrow. [Ca2+]i was monitored for the indicated time intervals as changes in fluorescence ratios of 340/380 nm. D, the cells were treated the same way as in (C), except that BSS without calcium was used, and 1.8 mM calcium was added at the indicated time interval after antigen triggering (arrow, Ca2+). E, IgE-sensitized cells were treated for 15 min with vehicle (Ctrl) or 50 μM UA and then activated with antigen (250 ng/ml TNP-BSA) or thapsigargin (1 μM) in the presence of extracellular 45Ca2+ (1 mM). After 15 min at 37 °C, the reaction was terminated by centrifugation of the cells through 12% BSA in PBS and cell-bound radioactivity was determined. F, the effect of UA on BMMC chemotaxis was determined in transwell chambers. IgE-sensitized cells were treated for 15 min with vehicle (Ctrl) or 50 μM UA and then transferred into upper wells of transfer chambers. Migration of the cells toward antigen (250 ng/ml), PGE2 (100 nM), or SCF (100 ng/ml), present together with 50 μM UA in bottom wells, was determined after 6 h. Means ± SEMs were calculated from 3 (C and D) to 4 to 17 (A, B, E, and F) independent experiments. Statistical significance of intergroup differences is also shown. BMMC, bone marrow-derived mast cells; BSA, bovine serum albumin; BSS, buffered salt solution; DMSO, dimethyl sulfoxide; TNP, 2,4,6-trinitrophenol; UA, ursolic acid.
Figure 3
Figure 3
Enhanced production but reduced cell release of cytokine TNF-α in UA-treated and antigen-activated cells.A, IgE-sensitized cells of the BMMC cell line were preincubated for 15 min with vehicle (0.1% DMSO; UA -) or 50 μM UA (+) and then activated (+) or not (−) with antigen (TNP-BSA; 250 ng/ml). After 1 h, RNA was isolated, and mRNA for TNF-α was quantified by RASL-qPCR. Data are presented as fold changes in the TNF-α mRNAs normalized to the expression levels of GAPDH mRNA. B, the levels of TNF-α released into the supernatant from the cells treated as in (A) for 4 h and quantified by bead-based immunoassay. C, flow cytometry analysis of the total cellular TNF-α in nonactivated or antigen-activated cells in the presence or absence of 50 μM UA. D, statistical evaluation of TNF-α positive cells (from the PE-positive quadrants as in C). Means ± SEMs were calculated from three to six independent experiments. Statistical significance of intergroup differences is also shown. BMMC, bone marrow-derived mast cells; BSA, bovine serum albumin; DMSO, dimethyl sulfoxide; TNP, 2,4,6-trinitrophenol; UA, ursolic acid.
Figure 4
Figure 4
Pretreatment with UA interferes with tyrosine phosphorylation of proteins involved in the earliest stages of FcεRI signaling, the FcεRI β subunit, SYK, LAT1, and LAT2. IgE-sensitized BMMCs were preincubated for 15 min with vehicle (0.1% DMSO; Ctrl) or UA (50 μM) and then activated or not for the indicated time intervals with antigen (TNP-BSA; 250 ng/ml). A, whole-cell lysates were analyzed by immunoblotting (IB) with a phosphotyrosine-specific antibody (PY-20)-HRP conjugate (PY) for total protein tyrosine phosphorylation. Numbers on the left indicate the positions of molecular weight markers in kDa. For loading control, the blot was developed with an actin-specific antibody. B and C, FcεRI complexes from the cells treated as in (A) were immunoprecipitated (IP) and analyzed by immunoblotting with the PY-20-HRP conjugate. For loading controls, the blots were stripped and developed with the FcεRI β subunit-specific antibody. Position of the FcεRI β subunit is indicated. A representative immunoblot from three prepared in independent experiments is shown (B). Densitometry analysis of the immunoblots as from panel (B) in which signals from tyrosine-phosphorylated FcεRI β subunit in activated cells were normalized to the signals from nonactivated cells and loading control protein, the FcεRI β subunit (C). D and E, whole-cell lysates from cells treated for 15 min with vehicle (Ctrl) or 50 μM UA and activated with antigen (TNP-BSA; 250 ng/ml) for various time intervals were analyzed by immunoblotting for tyrosine phosphorylation of SYK (p-SYKY519/Y520). FI, BMMCs were treated as in (D). LAT1 (F and G) and LAT2 (H and I) were immunoprecipitated with the corresponding antibodies. The immunoprecipitates were analyzed with PY-20-HRP conjugates and protein-specific antibodies. Representative immunoblots for each phosphorylated protein with the corresponding loading controls are shown (D, F, and H). The results in (E, G, and I) show densitometry analyses of the corresponding immunoblots in which signals from tyrosine-phosphorylated proteins in activated cells are normalized to the signals in nonactivated cells and loading control proteins. Means ± SEMs in (C, E, G, and I) were calculated from three to five independent experiments. Statistical significance of intergroup differences is also shown. BMMC, bone marrow-derived mast cells; BSA, bovine serum albumin; DMSO, dimethyl sulfoxide; HRP, horseradish peroxidase; TNP, 2,4,6-trinitrophenol; UA, ursolic acid.
Figure 5
Figure 5
Pretreatment with UA interferes with the phosphorylation of proteins involved in later stages of FcεRI signaling, PLCγ, ERK, CBL, and mTOR.AH, IgE-sensitized BMMCs were preincubated for 15 min with vehicle (0.1% DMSO; Ctrl) or UA (50 μM) and then activated or not for the indicated time intervals with antigen (TNP-BSA; 250 ng/ml). Whole-cell lysates were analyzed by immunoblotting for tyrosine phosphorylation of PLCγ [p-PLCγ1Y783; (A and B)], ERK [p-ERKY204; (C and D)], CBL [p-CBLY700; (E and F)], and mTOR [p-mTORS2448; (G and H)]. Representative immunoblots for each phosphorylated protein with the corresponding loading controls are shown (A, C, E, and G). The results in (B, D, F, and H) show densitometry analyses of the corresponding immunoblots in which signals from tyrosine-phosphorylated proteins in activated cells are normalized to the signals in nonactivated cells and loading control proteins. Means ± SEMs were calculated from three to four independent experiments. Statistical significance of intergroup differences is also shown. BMMC, bone marrow-derived mast cells; BSA, bovine serum albumin; DMSO, dimethyl sulfoxide; TNP, 2,4,6-trinitrophenol; UA, ursolic acid.
Figure 6
Figure 6
UA does not interfere with the surface expression of cholesterol.A, BMMCs were untreated (Ctrl) or treated with vehicle (0.1% DMSO) or 50 μM UA in 0.1% DMSO. As a positive control, the cells were treated with 20 mM MβCD. After 30 min, the cells were washed, fixed, and stained (+F) or not (−F) with filipin. The fluorescence of the cells was evaluated by flow cytometry. Typical flow cytometry profiles are shown. B, data obtained as in (A) were normalized to fluorescence of untreated cells stained with filipin. Means ± SEMs were calculated from 10 independent experiments in each group. Statistical significance of the intergroup differences is also shown. BMMC, bone marrow-derived mast cells; DMSO, dimethyl sulfoxide; MβCD, methyl-β-cyclodextrin.
Figure 7
Figure 7
UA interferes with the patches formation after FcεRI and Thy-1.1. crosslinking.A and B, formation of FcεRI patches. A, IgE-sensitized BMMCs were washed and exposed for 15 min to 50 μM UA or vehicle (Ctrl). Then, the cells were exposed to AF 488-conjugated secondary antibody for 10 min at 37 °C in the presence of 50 μM UA or vehicle (Ctrl), followed by fixing with 4% paraformaldehyde. Alternatively, the cells were fixed before exposure to AF 488-conjugated secondary antibody for 10 min. The fluorescence of cells was examined by confocal microscopy. B, the distribution of FcεRI in individual cells was evaluated, and the fraction of fluorescence detected centrally was calculated. Means ± SEMs and statistical significance of the intergroup differences are presented. C and D, formation of Thy-1.1 aggregates. C, adherent RBL-2H3 cells were treated with anti-Thy-1.1 antibody. After 30 min, the antibody was washed out, and the cells were exposed to 50 μM UA or vehicle as above. Then, the cells were fixed before (0 min) or after (10 min) exposure to AF 488-labeled secondary for 10 min at 37 °C. The fluorescence of the cells was examined by confocal microscopy. D, the distribution of Thy-1.1 in individual cells and were evaluated as in (B). Means and SEMs in (B and D) were calculate from 25 cells in three independent experiments. Statistical significance of the intergroup differences is also indicated. Bar = 10 μm. AF, Alexa fluor; UA, ursolic acid.
Figure 8
Figure 8
UA inhibits the mobility of the FcεRI and cholesterol, as determined by FRAP.A and B, mobility of the FcεRI-IgE-FITC complexes. A, RBL-2H3 cells were exposed for 15 min to 50 μM UA in DMSO (UA) or the corresponding concentration of vehicle (Ctrl). Then the cells were exposed to IgE-FITC complexes. Image sequences are from cells at the indicated time points before photobleaching (Pre-bleach) at photobleaching (Bleach) or after photobleaching (Post-bleach; the circled areas). The graph in (B) quantifies the recovery into the photobleached areas. Means ± SEMs were calculated from 18 cells in two independent experiments with similar results. C and D, mobility of the cholesterol–Filipin complexes. C, RBL-2H3 cells were exposed for 15 min to 50 μM UA in DMSO or the corresponding concentration of vehicle (Ctrl). Then the cells were exposed to filipin at 50 μg/ml for 10 min. After washing, the image sequences from cells at the indicated time points before, at, or after photobleaching of the circled areas. The graph in (D) quantifies the recovery into the photobleached region. Means ± SEMs were calculated from 15 cells in two independent experiments with similar results. Statistical significance of differences between control (Ctrl) and UA-treated cells (UA) is also indicated. Bar = 10 μm. DMSO, dimethyl sulfoxide; UA, ursolic acid.
Figure 9
Figure 9
Model of FcεRI-mediated activation in UA-treated cells. In nonactivated cells (A), the topography of plasma membrane components keeps all components of the FcεRI signalosome, including kinases and phosphatase, in a steady state. B, antigen-induced aggregation of FcεRIs disturbs this steady state in favor of kinases, leading to tyrosine phosphorylation of numerous substrates and propagation of the signals resulting in increased degranulation, calcium response, and cytokines production. C, Inserting hydrophobic UA into the plasma membrane interferes with the properties of plasma membrane components, leading to changes in their mobility and increased phosphorylation of the several critical proteins of the FcεRI signalosome. UA could interfere with the topography of kinases, phosphatases, and their substrates. D, In UA-treated and antigen-activated cells, disturbances of the plasma membrane components cause a suboptimal performance of the FcεRI signalosome, leading to a reduced calcium response and degranulation. Interestingly, cytokine production is enhanced in UA-treated and antigen-activated cells but the secretion of the cytokines is diminished. UA, ursolic acid.

References

    1. Rivera J., Gilfillan A.M. Molecular regulation of mast cell activation. J. Allergy Clin. Immunol. 2006;117:1214–1225. - PubMed
    1. Gilfillan A.M., Beaven M.A. Regulation of mast cell responses in health and disease. Crit. Rev. Immunol. 2011;31:475–529. - PMC - PubMed
    1. Harvima I.T., Levi-Schaffer F., Draber P., Friedman S., Polakovicova I., Gibbs B.F., et al. Molecular targets on mast cells and basophils for novel therapies. J. Allergy Clin. Immunol. 2014;134:530–544. - PubMed
    1. Draber P., Halova I., Polakovicova I., Kawakami T. Signal transduction and chemotaxis in mast cells. Eur. J. Pharmacol. 2016;778:11–23. - PMC - PubMed
    1. Halova I., Ronnberg E., Draberova L., Vliagoftis H., Nilsson G.P., Draber P. Changing the threshold - signals and mechanisms of mast cell priming. Immunol. Rev. 2018;282:73–86. - PubMed

Publication types

LinkOut - more resources