. 2022 Sep 17;11(1):57.
doi: 10.1038/s41389-022-00433-3.

PFKFB4 interacts with FBXO28 to promote HIF-1α signaling in glioblastoma

Affiliations

PFKFB4 interacts with FBXO28 to promote HIF-1α signaling in glioblastoma

Emma Phillips et al. Oncogenesis. .

Abstract

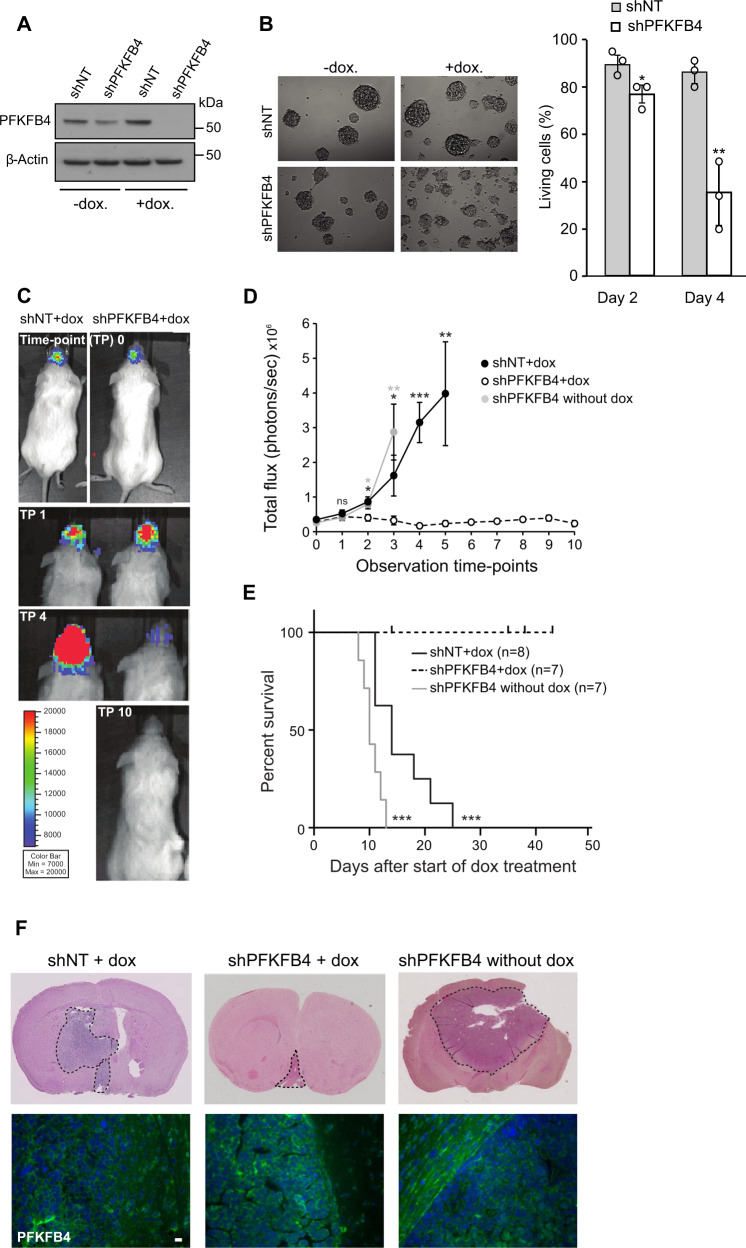
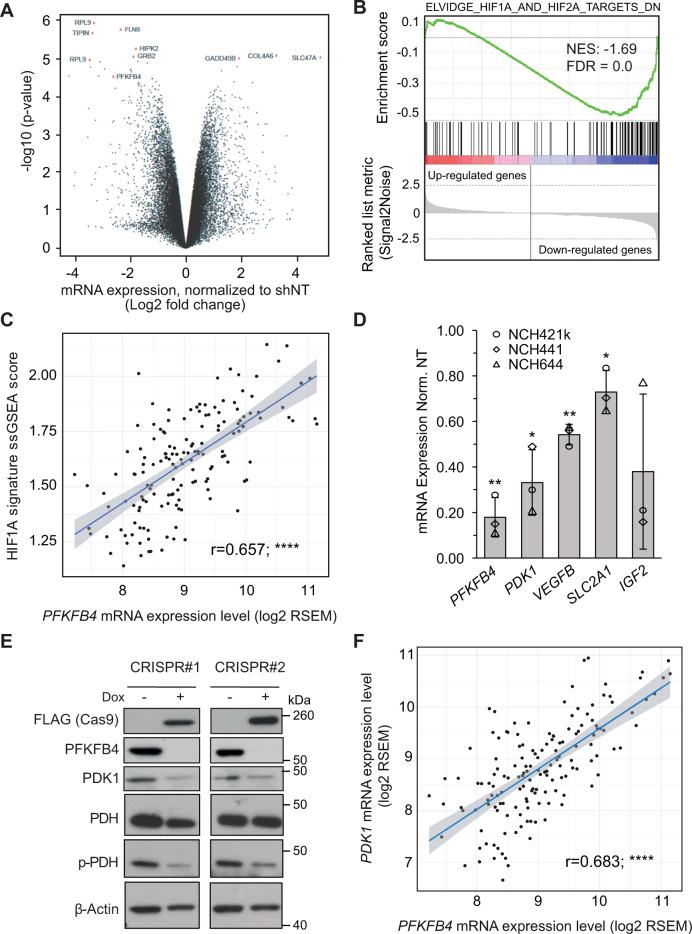
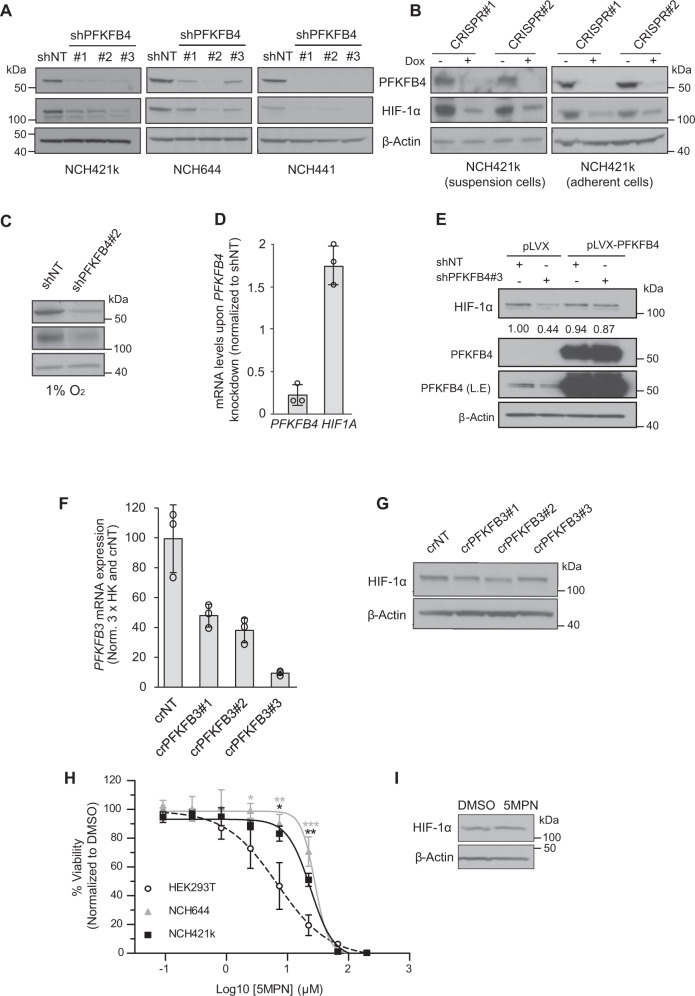
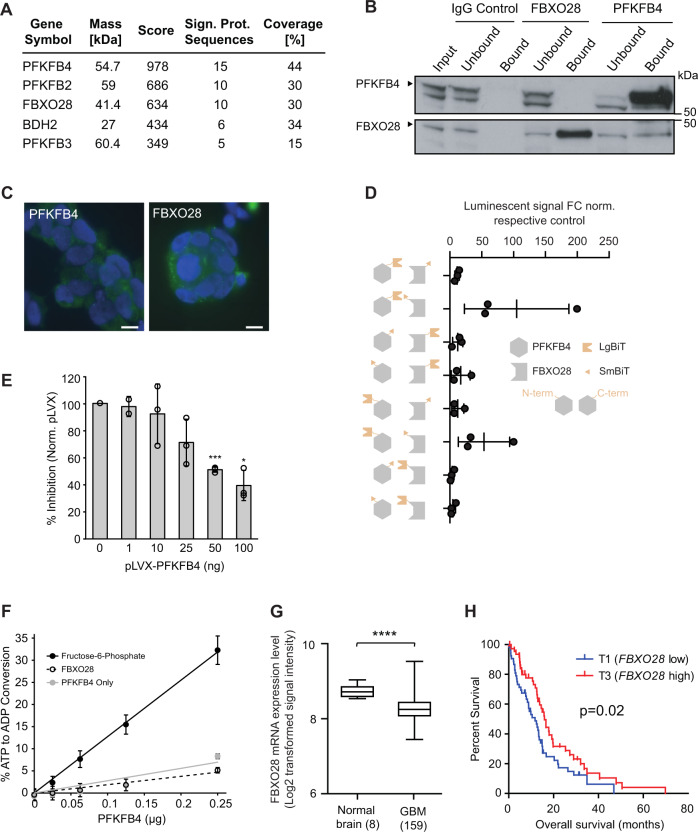
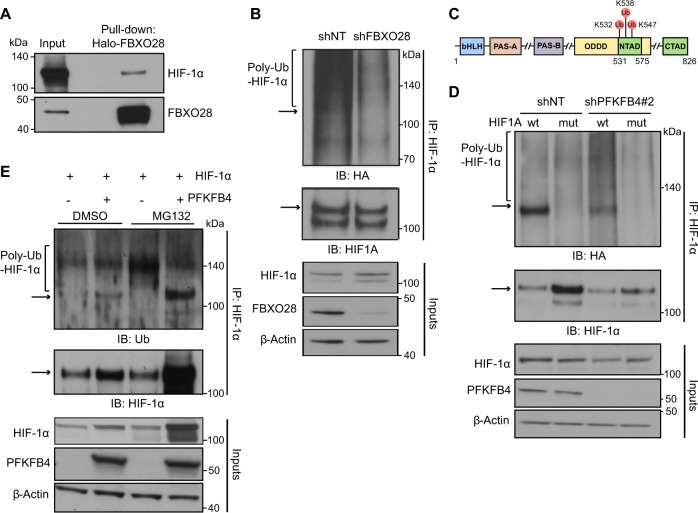
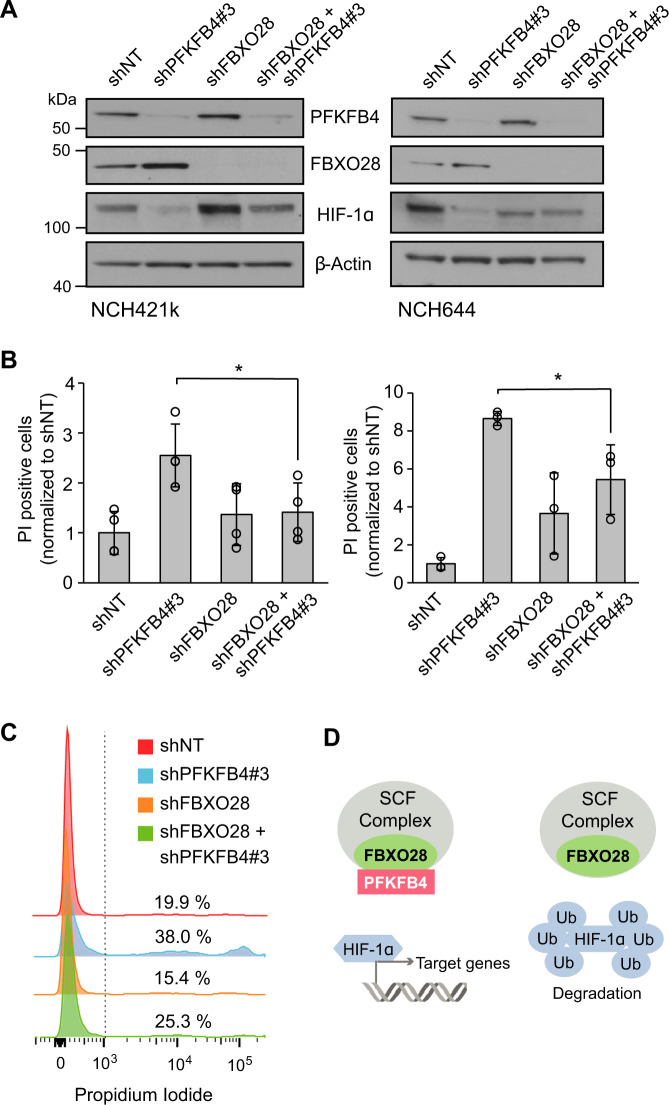
Glioblastoma is a highly aggressive brain tumor for which there is no cure. The metabolic enzyme 6-Phosphofructo-2-Kinase/Fructose-2,6-Biphosphatase 4 (PFKFB4) is essential for glioblastoma stem-like cell (GSC) survival but its mode of action is unclear. Understanding the role of PFKFB4 in tumor cell survival could allow it to be leveraged in a cancer therapy. Here, we show the importance of PFKFB4 for glioblastoma growth in vivo in an orthotopic patient derived mouse model. In an evaluation of patient tumor samples of different cancer entities, PFKFB4 protein was found to be overexpressed in prostate, lung, colon, mammary and squamous cell carcinoma, with expression level correlating with tumor grade. Gene expression profiling in PFKFB4-silenced GSCs revealed a downregulation of hypoxia related genes and Western blot analysis confirmed a dramatic reduction of HIF (hypoxia inducible factor) protein levels. Through mass spectrometric analysis of immunoprecipitated PFKFB4, we identified the ubiquitin E3 ligase, F-box only protein 28 (FBXO28), as a new interaction partner of PFKFB4. We show that PFKFB4 regulates the ubiquitylation and subsequent proteasomal degradation of HIF-1α, which is mediated by the ubiquitin ligase activity of FBXO28. This newly discovered function of PFKFB4, coupled with its cancer specificity, provides a new strategy for inhibiting HIF-1α in cancer cells.


Conflict of interest statement

DKFZ filed the patent application EP19701524.1 based on the results of this study and VG, EP, JB ad FB are listed as inventor. The authors declare no conflict of interest.

Figures

Fig. 1
Fig. 1. PFKFB4 silencing reduces tumor size in vivo.
A PFKFB4 protein levels in luciferase expressing NCH421k GSCs stably transduced with doxycycline inducible shNT or shPFKFB4 on day 4 with or without doxycycline. α-tubulin was used as a protein loading control. B (Left) Representative images of NCH421k spheres 6 days after induction of shNT or shPFKFB4 with doxycycline. (Right) Percentage of living cells as determined by propidium iodide (PI) staining and FACS analysis 2 and 4 days after induction of shNT or shPFKFB4 with doxycycline (n = 3, mean ± SD, two sided t-test, *p value < 0.05, **p value< 0.01). C Bioluminescence signal of representative mice orthotopically transplanted with shNT and shPFKFB4 transduced cells at observation time-points 0, 1, 2 and 10, corresponding to 0, 4, 14 and 42 days, after starting administration of doxycycline. D Mean bioluminescence signal of mice transplanted with shNT transduced cells (black) and shPFKFB4 transduced cells (black dotted) after start of administration of doxycycline and mice transplanted with shPFKFB4 transduced cells which did not receive doxycycline (gray) at 10 different time points over a period of 35 days. Data are represented as mean ± standard error of the mean (SEM), two-sided t-test, *p value < 0.05, **p value < 0.01, ***p value < 0.001. E Survival of mice transplanted with shNT (black, n = 8) and shPFKFB4 transduced cells (black dotted, n = 7) after start of administration of doxycycline, and mice transplanted with shPFKFB4 transduced cells which did not receive doxycycline (gray, n = 7). Censored observations are represented by a vertical dash and represent mice which were sacrificed before they displayed any neuropathological symptoms for monitoring tumor growth by immunohistochemistry. Log rank test, ***p value < 0.001. F Representative H&E stained tissue sections of brains of a mouse from each group and PFKFB4 protein expression (below). Scale bar = 20 µm.
Fig. 2
Fig. 2. PFKFB4 regulates the transcription factor HIF-1α.
A Volcano plot showing the fold changes and p-values of gene expression in PFKFB4-silenced (3 days) GSCs. Data represent mean of the three different patient-derived GSC lines: NCH421k, NCH644 and NCH441. Along with PFKFB4 itself, the top 10 deregulated probes are highlighted in red and labelled with the gene to which they map. B Gene Set Enrichment Analysis (GSEA) comparing a gene signature of downregulated genes in a HIF1A/HIF2A-silenced breast cancer cell line (from ref. [27], Elvidge) to the gene expression list of PFKFB4-silenced GSCs in a rank order based on the mean linear fold change of the genes. The green curve corresponds to the running sum of the enrichment score which reflects the degree to which the gene signature is overrepresented at the bottom of the list. (Normalized enrichment score (NES) = −1.69, false discovery rate (FDR) = 0.0). C Correlation between PFKFB4 mRNA expression and expression of the Elvidge HIF1A gene signature based on its single sample gene set enrichment analysis (ssGSEA) score in TCGA glioblastoma patients (regression analysis, r = 0.657, ****p value < 0.0001). D mRNA levels of PFKFB4 and selected downregulated HIF-1α target genes (PDK1, VEGFB, SLC2A1 and IGF2) determined by gene expression profiling in three different GSC lines. E Protein levels of FLAG (CAS9), PFKFB4, PDK1, PDH and phosphorylated PDH (S293) after doxycycline inducible knockout of PFKFB4 (7 days incubation with dox). β-actin was used as a loading control. F Correlation between PFKFB4 and PDK1 mRNA expression in TCGA glioblastoma patients (regression analysis, r = 0.683, ****p value < 0.0001).
Fig. 3
Fig. 3. Characterization of HIF-1α regulation by PFKFB4.
A Protein levels of PFKFB4 and HIF-1α upon silencing (3 days) of PFKFB4 using three different shRNAs in NCH421k, NCH644 and NCH441 GSCs. β-actin was used as a loading control. B Protein levels of PFKFB4 and HIF-1α upon knockout of PFKFB4 using two different sgRNAs (7 days incubation with dox) in NCH421k GSCs grown in suspension and in an adherent monolayer. Knockout was induced by incubation with doxycycline for 7 days. β-actin is displayed as a loading control. C PFKFB4 and HIF-1α protein levels upon silencing of PFKFB4 in NCH421k GSCs cultivated in hypoxia (1% O2). β-actin is displayed as a loading control. D mRNA levels of PFKFB4 and HIF1A upon silencing (3 days) of PFKFB4 in NCH421k GSCs, normalized to housekeeper genes HPRT, ARF1 and DCTN2 and to shNT (n = 3; data are represented as mean ± SD). E Protein levels of PFKFB4 and HIF-1α in NCH421k GSCs which were transduced with lentiviral particles containing shNT or shPFKFB4#3, and empty pLVX-puro vector or pLVX-puro overexpressing PFKFB4. β-actin was used as a loading control. Numbers denote the quantified band intensity, normalized to β-actin and the first shNT band. L.E. = Longer exposure. F mRNA levels of PFKFB3 upon knockout using 3 different guide RNAs (7 days after transduction and selection) in NCH421k GSCs, normalized to housekeeper genes HPRT, ARF1 and DCTN2 and to shNT (n = 3 technical replicates; data are represented as mean ± SD). G HIF-1α protein levels upon PFKFB3 knockout. β-actin is displayed as a loading control. H IC50 curves of NCH421k and NCH644 GSCs or HEK293T cells after incubation with 5MPN at increasing concentrations for 48 hours (n = 3, mean ± SD, two sided t-test, *p value < 0.05, **p value< 0.01, ***p value< 0.001). I Protein levels of HIF-1α in NCH421k GSCs after incubation with 4 µM 5MPN for 72 hours. β-actin was used as a loading control.
Fig. 4
Fig. 4. FBXO28 is a novel interaction partner of PFKFB4.
A Interaction partners of PFKFB4 in NCH421k GSCs as determined by mass spectrometry of immunoprecipitated PFKFB4 from NCH421k lysate. Proteins were only considered as identified if more than one unique peptide had an individual ion score exceeding the MASCOT identity threshold and if three or more unique peptide sequences were identified in all replicates and not in the controls. The experiment was performed in biological triplicate, with data from one biological replicate displayed here; further replicates shown in Table S2. B Immunoprecipitation of FBXO28 or PFKFB4 from NCH421k lysate, with IgG as a control. PFKFB4 and FBXO28 are shown on the immunoblot. C Immunofluorescent staining of PFKFB4 and FBXO28 in NCH421k GSCs. Scale bar = 10 µm. D Split NanoLuc® Luciferase assay to determine the best combination of split fragments with the large (LgBiT) or small (SmBiT) BiT cloned onto the C- or N-terminal of either PFKFB4 or FBXO28. Data are normalized to the negative control, which is a combination of the halo tag labelled with the small BiT with either PFKFB4 or FBXO28 tagged with the large BiT. A luminescent signal that is at least 10 times the negative control was considered as positive. Data are represented as mean of biological triplicates ± SD. E Verification of the specificity of the interaction of SmBiT-tagged FBXO28 (N-term) to LgBiT-tagged PFKFB4 (C-term) using the Split NanoLuc® Luciferase system. Increasing amounts of untagged PFKFB4-overexpressing pLVX plasmid were added to displace the tagged protein, with empty pLVX plasmid as a negative control. Data are depicted as percent inhibition compared with the pLVX only control. (n = 3, mean ± SD, two sided t-test, *p value < 0.05, ***p value< 0.001). F ADP-Glo™ kinase assay measuring the percentage ATP to ADP conversion when increasing amounts of recombinant PFKFB4 was incubated with fructose-6-phophate, recombinant FBXO28 or no substrate. G FBXO28 mRNA in normal brain (n = 8) compared with GBM patients (n = 159). Data are represented as mean ± the minimum and maximum. The whiskers are drawn down to the 25th percentile and up to the 75th percentiles. H Survival of GBM patients with high (top tertile, n = 53; red) and low (bottom tertile, n = 53; blue) FBXO28 expression.
Fig. 5
Fig. 5. PFKFB4 hinders the ubiquitylation of HIF-1α by binding to the E3 ubiquitin ligase FBXO28.
A FBXO28-Halo and HIF-1α were overexpressed in HEK293T cells, and an FBXO28 pulldown was performed using Halo resin. FBXO28 and associated proteins were eluted by TEV-cleavage. Immunoblot was performed with FBXO28 and HIF-1α antibodies. B Upper panel: HIF-1α IP from lysate of NCH421k cells stably expressing HA-ubiquitin, in the presence of the proteasome inhibitor MG132 (500 nM, 6 hours) and with and without FBXO28 silencing (3 days). The immunoblot (IB) shows HA-ubiquitin and HIF-1α levels. The bracket indicate poly-ubiquitinated HIF-1α and the arrow shows the expected migration of unmodified HIF-1α (also applies to 5D and 5E). Lower panel: HIF-1α and FBXO28 protein levels in the input lysates used in the IP above. β-actin is displayed as a loading control in all panels. C Scheme of the HIF-1α protein domains including the ubiquitinylated lysines which were mutated to alanine (K532, K538, K547) (Adapted from ref. [54]). D Upper panel: HIF-1α IP from lysate of NCH421k cells stably expressing HA-ubiquitin and silenced (3 days) for endogenous HIF1A, in the presence of MG132 (500 nM, 6 hours), with and without PFKFB4 silencing and overexpression of wild-type or lysine-mutated HIF-1α. The IB shows HA-ubiquitin and HIF-1α levels. Lower panel: PFKFB4 protein levels in the input lysates used in the IP above. E Upper panel: HIF-1α immunoprecipitated (IP) from lysate of HEK293T cells in the absence and presence of MG132 (500 nM, 6 hours) and PFKFB4 overexpression (3 days). HIF-1α was overexpressed in all conditions. The IB shows ubiquitin (Ub) and HIF-1α levels. Lower panel: PFKFB4 protein levels in the input lysates used for the IP above.
Fig. 6
Fig. 6. HIF-1α protein level is dependent on the interaction of PFKFB4 with FBXO28.
A Protein levels of PFKFB4, FBXO28 and HIF-1α in NCH421k and NCH644 GSCs with PFKFB4 and FBXO28 silencing (3 days) separately or together. β-actin is displayed as a loading control. B FACS analysis of propidium iodide stained NCH421k (left) and NCH644 (right) GSCs with PFKFB4 and FBXO28 silencing (4 days) separately or simultaneously. Data are normalized to cells transduced with shNT (n = 3) and are represented as mean ± SD, two-sided t-test, *p value < 0.05. C Representative histograms of the FACS data highlighting the rescue of the phenotype upon simultaneous silencing of PFKFB4 and FBXO28. D Scheme showing the proposed mechanism of PFKFB4 and FBXO28 acting on HIF-1α stability and therefore cell viability (Ub = ubiquitin).

References

    1. Stupp R, Mason WP, van den Bent MJ, Weller M, Fisher B, Taphoorn MJ, et al. Radiotherapy plus concomitant and adjuvant temozolomide for glioblastoma. N. Engl J Med. 2005;352:987–96. doi: 10.1056/NEJMoa043330. - DOI - PubMed
    1. Louis DN, Ohgaki H, Wiestler OD, Cavenee WK, Burger PC, Jouvet A, et al. The 2007 WHO classification of tumours of the central nervous system. Acta Neuropathologica. 2007;114:97–109. doi: 10.1007/s00401-007-0243-4. - DOI - PMC - PubMed
    1. Singh SK, Clarke ID, Terasaki M, Bonn VE, Hawkins C, Squire J, et al. Identification of a cancer stem cell in human brain tumors. Cancer Res. 2003;63:5821–8. - PubMed
    1. Singh SK, Hawkins C, Clarke ID, Squire JA, Bayani J, Hide T, et al. Identification of human brain tumour initiating cells. Nature. 2004;432:396–401. doi: 10.1038/nature03128. - DOI - PubMed
    1. Prager BC, Bhargava S, Mahadev V, Hubert CG, Rich JN. Glioblastoma Stem cells: Driving Resilience through Chaos. Trends Cancer. 2020;6:223–35. doi: 10.1016/j.trecan.2020.01.009. - DOI - PMC - PubMed