. 2022 Sep 17;13(1):5461.
doi: 10.1038/s41467-022-33202-2.

Single-cell transcriptomics reveal cellular diversity of aortic valve and the immunomodulation by PPARγ during hyperlipidemia

Affiliations

Single-cell transcriptomics reveal cellular diversity of aortic valve and the immunomodulation by PPARγ during hyperlipidemia

Seung Hyun Lee et al. Nat Commun. .

Abstract

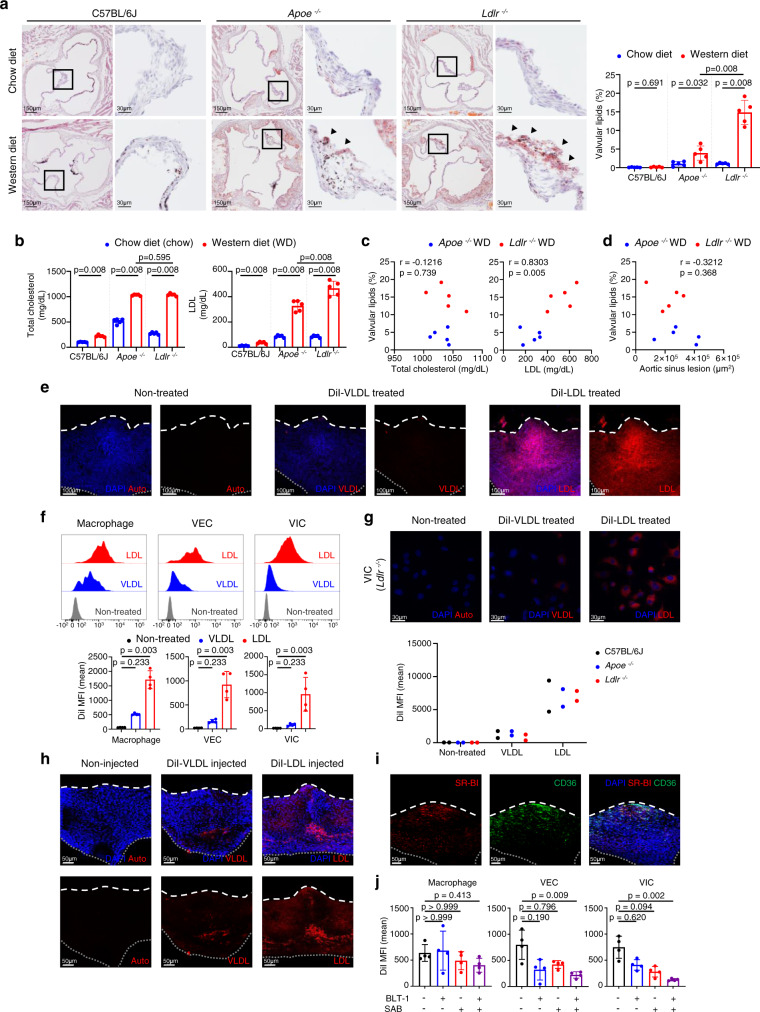
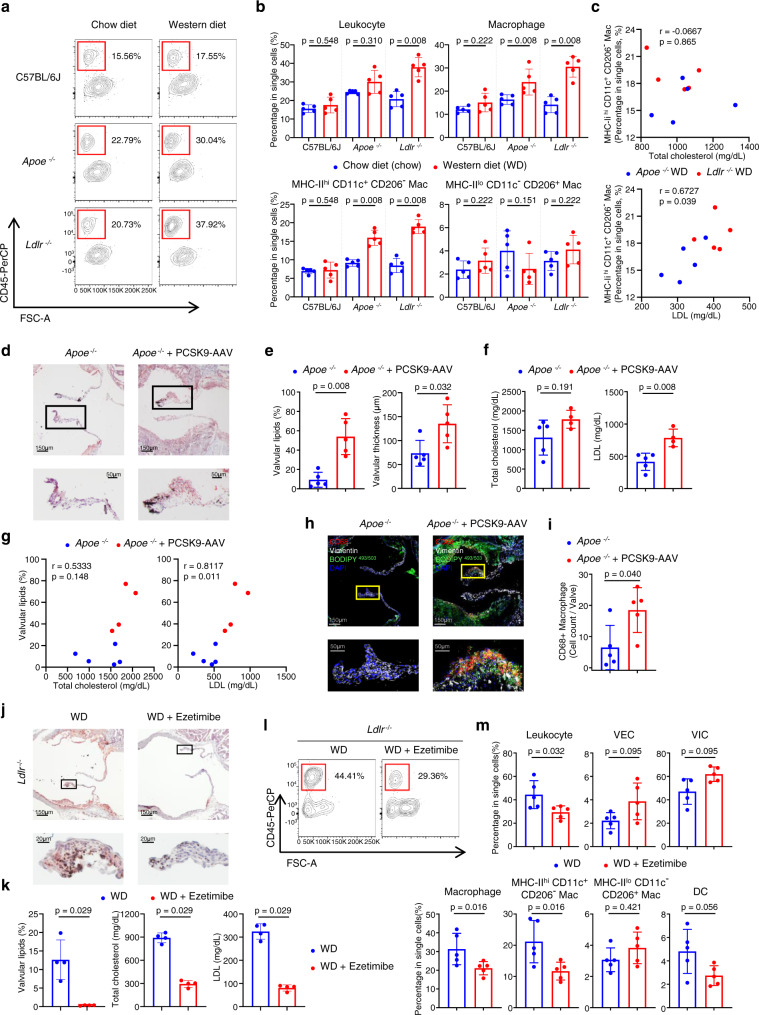
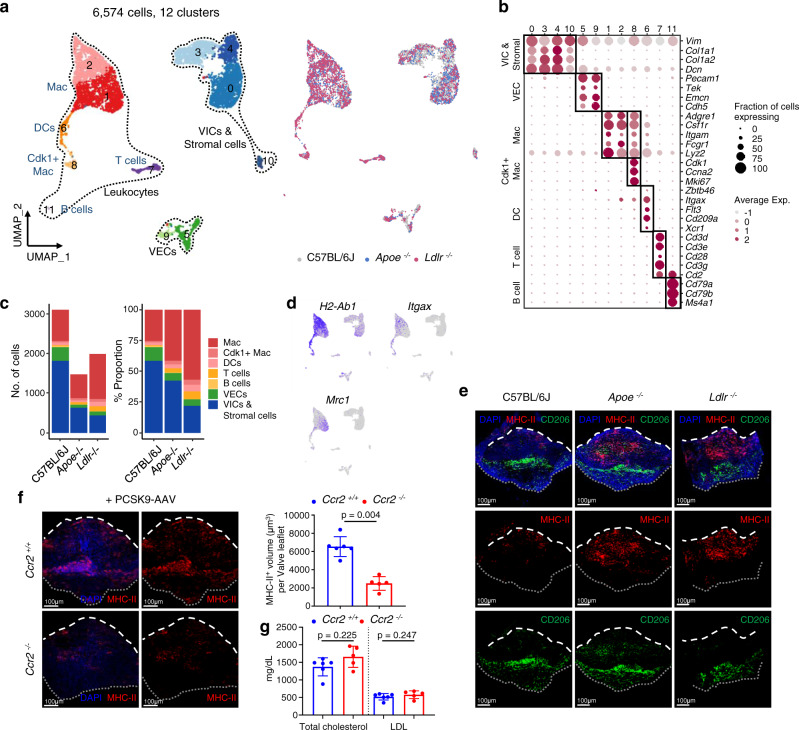
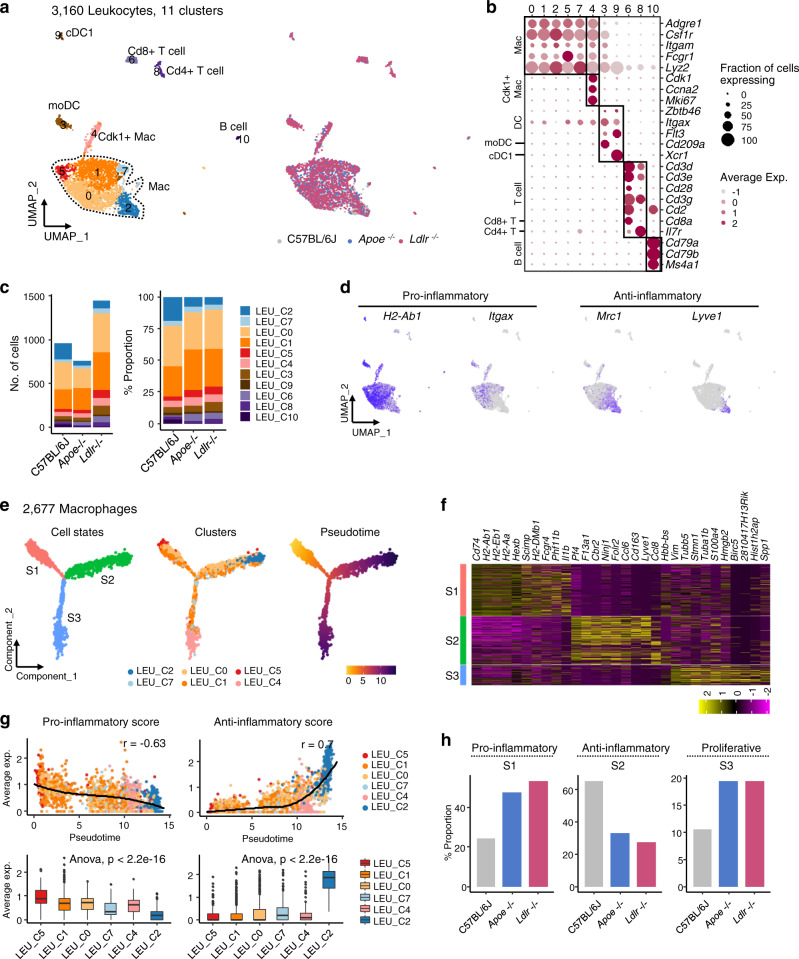
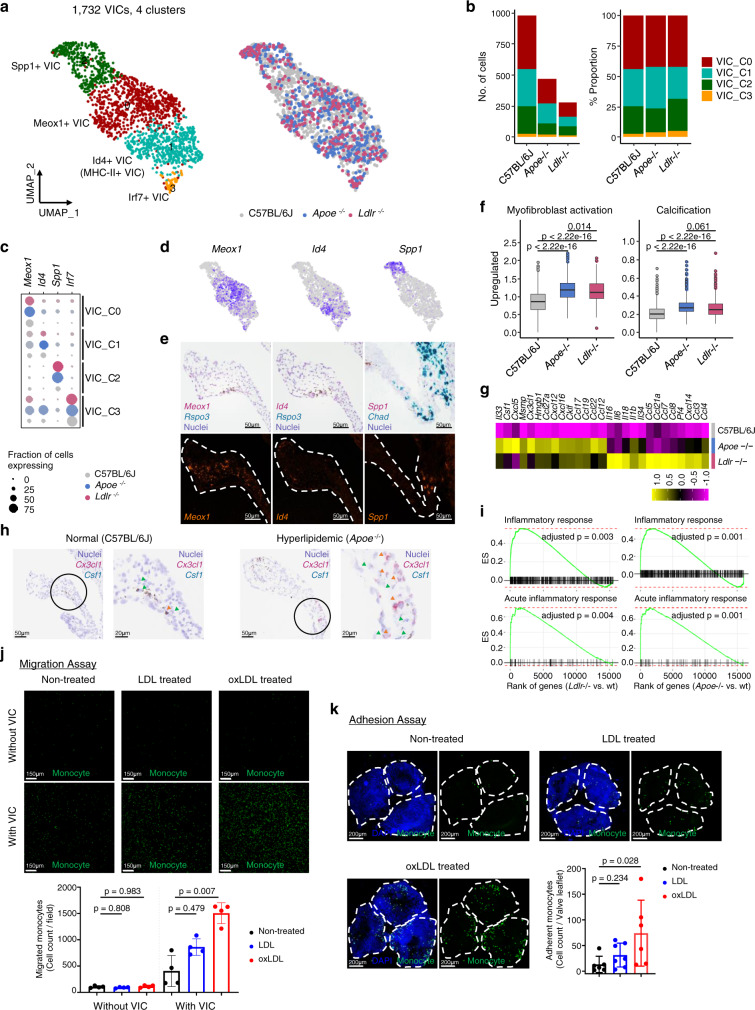
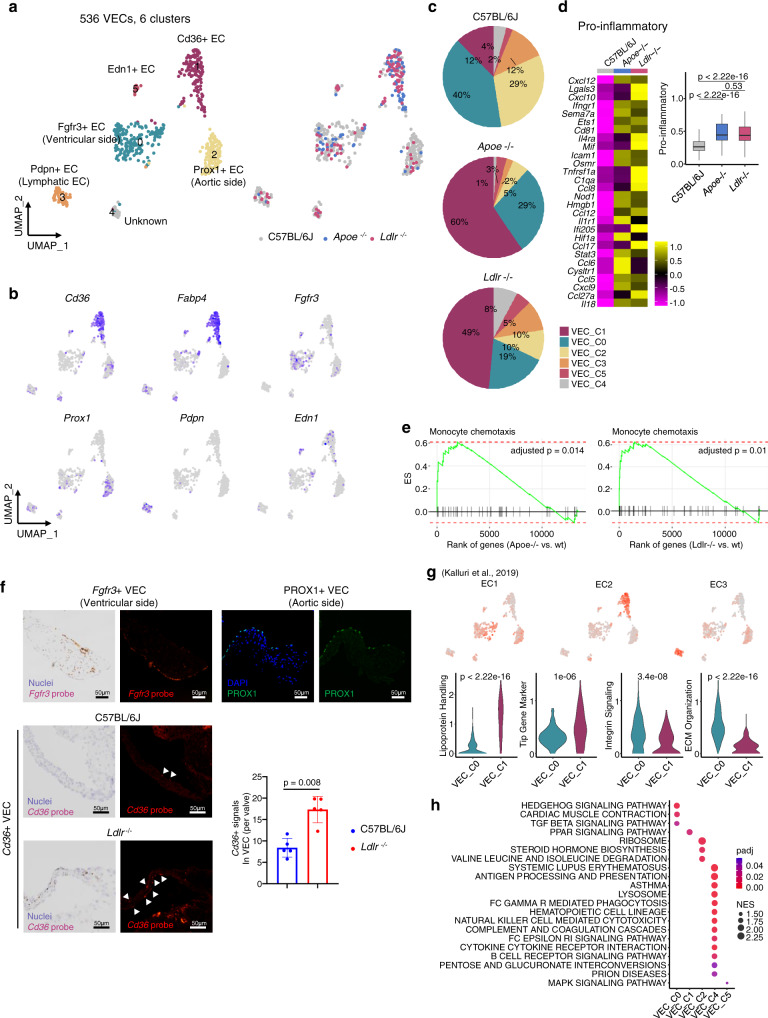
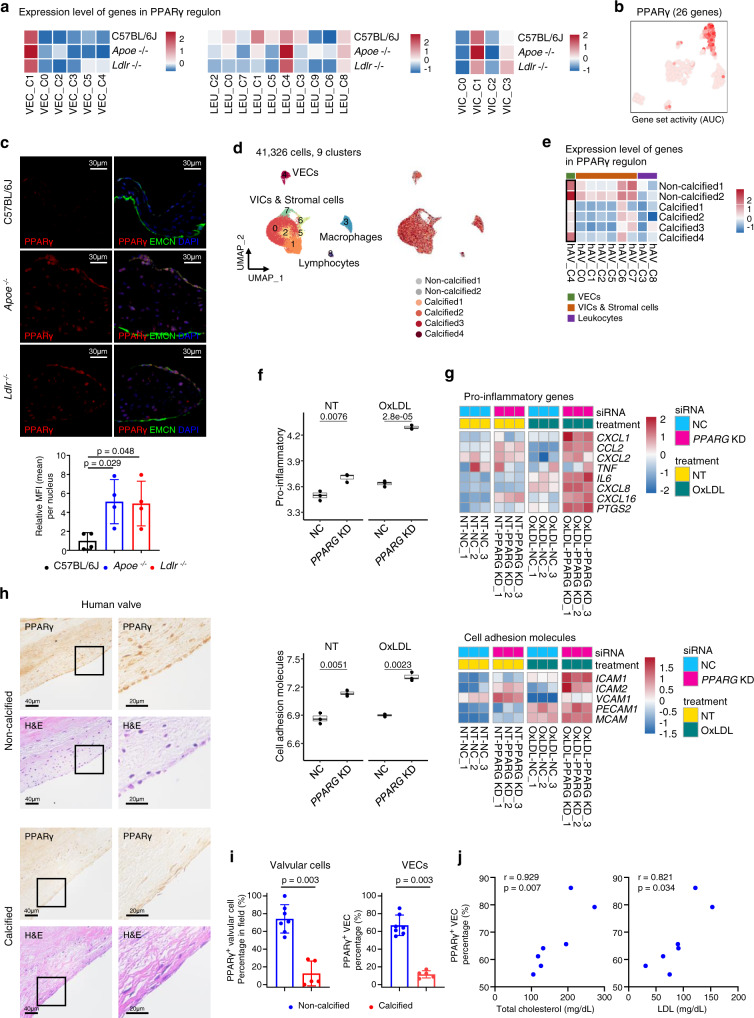
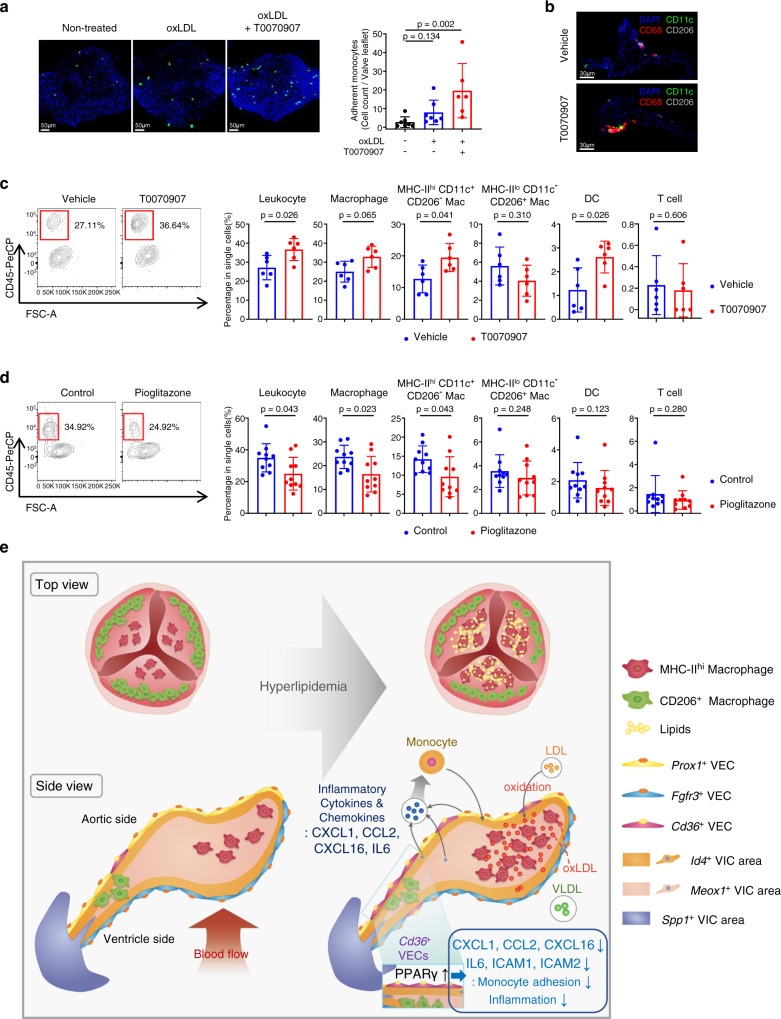
Valvular inflammation triggered by hyperlipidemia has been considered as an important initial process of aortic valve disease; however, cellular and molecular evidence remains unclear. Here, we assess the relationship between plasma lipids and valvular inflammation, and identify association of low-density lipoprotein with increased valvular lipid and macrophage accumulation. Single-cell RNA sequencing analysis reveals the cellular heterogeneity of leukocytes, valvular interstitial cells, and valvular endothelial cells, and their phenotypic changes during hyperlipidemia leading to recruitment of monocyte-derived MHC-IIhi macrophages. Interestingly, we find activated PPARγ pathway in Cd36+ valvular endothelial cells increased in hyperlipidemic mice, and the conservation of PPARγ activation in non-calcified human aortic valves. While the PPARγ inhibition promotes inflammation, PPARγ activation using pioglitazone reduces valvular inflammation in hyperlipidemic mice. These results show that low-density lipoprotein is the main lipoprotein accumulated in the aortic valve during hyperlipidemia, leading to early-stage aortic valve disease, and PPARγ activation protects the aortic valve against inflammation.


Conflict of interest statement

The authors declare no competing interests.

Figures

Fig. 1
Fig. 1. LDL is a primary lipoprotein accumulated in the aortic valve under hyperlipidemia.
ad Comparison of lipid accumulation in the aortic valves and blood lipid profiles of mice (C57BL/6J, Apoe−/−, and Ldlr−/−) fed a chow diet (chow) versus a western diet (WD) for 10 weeks (n = 5). Representative lipid stain images and measurement of valvular lipid deposition. Black or dark brown spots are melanin pigments. Arrowhead: accumulated lipids. Scale bar: 150  μm (left), 30 μm (right) (a), total cholesterol and LDL levels in the blood plasma (b), correlations between aortic valvular lipid deposition and blood lipid profiles of WD-fed hyperlipidemic mice (c), and correlation between aortic valvular lipid accumulation and aortic sinus lesions in WD-fed hyperlipidemic mice (d). e, f DiI-lipoproteins (LDL or VLDL) uptake of aortic valves cultured ex vivo. Representative whole-mount images (repeated three times) (e) and flow cytometry analysis (n = 4) (f). Scale bar: 100 μm. g DiI-lipoprotein (LDL or VLDL) uptake levels of cultured VICs using C57BL/6J, Ldlr−/−, and Apoe−/− mice. Representative images (top) and mean fluorescence intensity (MFI) of DiI-lipoprotein detected by flow cytometry (n = 2. Each sample represents pooling of 10 mice). Scale bar: 30 μm. h Whole-mount images of the aortic valve from after intravenous injection of DiI-lipoproteins (LDL or VLDL) to C57BL/6J. Scale bar: 50 μm. i Whole-mount immunostaining of the aortic valve from C57BL/6J with SR-BI (red) and CD36 (green). Scale bar: 50 μm. j Flow cytometric analysis of DiI-lipoproteins (LDL or VLDL) uptake of aortic valves from C57BL/6 J mice, cultured with/without BLT-1 (SR-BI inhibitor) or SAB (CD36 inhibitor) (n = 4). Dashed line (white), outline of the free edge. Dotted line (gray), outline of the annulus-attached region. WD: western diet. Image data are representative of three independent experiments unless otherwise stated. Two-sided Mann–Whitney test (comparison of two groups) and Kruskal–Wallis test with post-hoc Dunn’s test (comparison of three or more groups), were used for group comparisons. The Spearman correlation test was used for correlation analyses. Data are presented as mean ± SD.
Fig. 2
Fig. 2. Plasma LDL levels positively correlate with inflammation and lipid accumulation in the aortic valve.
ac Flow cytometry analyses of the aortic valves of C57BL/6 J, Apoe−/−, and Ldlr−/− mice fed a chow diet (chow) or western diet (WD) for 10 weeks (n = 5). Representative plot of leukocytes (a), percentage of leukocytes, macrophages, and macrophage subsets (b), and correlations between the percentage of MHC-IIhi CD11c+ CD206- macrophages and blood lipid profiles of WD-fed hyperlipidemic mice (c). di Apoe−/− mice were injected with PCSK9-AAV to identify the effect of elevated serum LDL levels. PCSK9-AAV-injected Apoe−/− mice were compared with non-injected Apoe−/− mice (WD for 24 weeks). Representative Oil Red O stain images. Scale bar: 150 μm (top), 50 μm (bottom) (d), quantification of valvular lipid deposition and thickness of aortic valve (n = 5) (e), total cholesterol and LDL levels in blood plasma (n = 5 for Apoe−/−, n = 4 for Apoe−/−+PCSK9-AAV) (f), correlation between valvular lipid deposition and each lipid profile (total cholesterol and LDL) (n = 9 total; 5 from Apoe−/−; 4 from Apoe−/−+PCSK9-AAV) (g), immunostaining of CD68 (red) and Vimentin (white) along with the lipid stain using BODIPY 493/503 (green). Scale bar: 150 μm (top), 50 μm (bottom) (h), and quantification of CD68 + macrophages accumulated in the aortic valve (n = 5) (i). j, k Lipid-lowering effects of ezetimibe on lipid accumulation in the aortic valves of WD-fed (for 10 weeks) Ldlr−/− mice (n = 4). Representative lipid stain images. Scale bar: 150 μm (top), 20μm (bottom) (j) and quantification of valvular lipid deposition with blood lipid profiles (k). l, m Effects of lipid-lowering by ezetimibe on the proportion of immune cells in aortic valves of WD-fed (for 10 weeks) Ldlr−/− mice, through flow cytometry (n = 5). Representative plot of leukocytes (l) and percentages of each cell population in single cells (m). WD: western diet. For (b), (e), (f), (i), (k), and (m), two-sided Mann-Whitney test was used. For (c) and (g), the Spearman correlation test was used. Data are presented as mean ± SD.
Fig. 3
Fig. 3. Comprehensive single-cell profiling reveals that monocyte-derived macrophages are the major immune cells accumulated in aortic valve during hyperlipidemia.
a Uniform manifold approximation and projection (UMAP) plot of 6574 single cells colored by the clusters (left) and mouse models (right). Apoe−/− and Ldlr−/− mice were fed a WD for 16 weeks. b Average expression map of known cell-type marker genes for each cell cluster. Color represents average expression levels, which are scaled by z-transformation and limited to a scale from −2.5 to 2.5. Dot size represents the fraction of cells with the expression value of each marker gene for each cluster. c Absolute cell number (left) and relative proportion (right) of the major cell lineages from each mouse model. d UMAP plot of gene expression of H2-Ab1, Itgax, and Mrc1 (gray to blue). e Whole-mount immunostaining of the aortic valve from C57BL/6J, Apoe−/− and Ldlr−/− mice for MHC-II (red) and CD206 (green). Scale bar: 100 μm. f Accumulated MHC-II+ cells in the aortic valve of PCSK9-AAV-injected Ccr2+/+ or -Ccr2−/− mice (WD for 24 weeks). Representative whole-mount MHC-II immunofluorescence images (left) and measurement of MHC-II + volume in the aortic valve (right) (n = 6 for Ccr2+/+, n = 5 for Ccr2−/−). Scale bar: 100 μm. g Plasma total cholesterol and LDL levels in PCSK9-AAV-injected Ccr2+/+ or -Ccr2−/− mice (WD for 24 weeks) (n = 6 for Ccr2+/+, n = 5 for Ccr2−/−). For (f) and (g), two-sided Mann–Whitney test was used. Dashed line (white), outline of the free edge. Dotted line (gray), outline of the annulus-attached region. Image data are representative of three independent experiments unless otherwise stated. Data are presented as mean ± SD.
Fig. 4
Fig. 4. Pro-inflammatory valvular macrophages are markedly increased during hyperlipidemia.
a UMAP plot of 3160 leukocytes, colored by the clusters and mouse models as indicated. Apoe−/− and Ldlr−/− mice were fed a WD for 16 weeks. b Average expression map of known cell-type marker genes for each cell cluster. Color represents average expression levels which are scaled by z-transformation and limited to a scale from −2.5 to 2.5. Dot size represents the fraction of cells with the expression value of each marker gene for each cluster. c Absolute cell number (left) and relative proportion (right) of leukocyte subsets from each mouse model. d UMAP plot of expression level of marker genes (gray to blue). e Trajectory component plot of 2677 macrophages colored by the cell states, clusters, and mouse models. f Expression map of top10 significant genes for each cell state. Color represents the expression levels, which are scaled by z-transformation and limited to a minimum scale of −2.5. (purple to yellow). g Correlation of Monocle pseudotime with functional features of macrophages. Pro-inflammatory score represents mean expression of featured genes: Il1b, Tnf, Ccl2, Cxcl10, Cxcl2, H2-Ab1, and Itgax. Anti-inflammatory score represents mean expression of featured genes: Mrc1, Lyve1, Folr2, Cbr2, and Il10. Trend line and the top-right text (r) denote LOESS fit and Pearson’s correlation, respectively (top). Boxplot of macrophage functional features in each cluster (bottom) (n = 159 cells for LEU_C5; 907 for LEU_C1; 973 for LEU_C0; 123 for LEU_C7; 182 for LEU_C4; 333 for LEU_C2). Each box depicts the interquartile range (IQR, the range between the 25th and 75th percentile) and median of each score, whiskers indicate 1.5 times the IQR. One-way ANOVA test p-value. h Cell proportion of functional cell states in macrophages for each mouse model.
Fig. 5
Fig. 5. VICs show pro-inflammatory features during hyperlipidemia.
a UMAP plot of 1,732 VICs colored by clusters and mouse models as indicated. b Absolute cell numbers (left) and relative proportions (right) of the VIC subsets from each mouse model. c Average expression map of representative genes in each cell cluster. Color depends on the mouse model, and size represents the fraction of cells with the expression value of each gene for each group. d, e Representative gene expression of VIC subclusters. UMAP plot of gene expression (gray to blue) (d) and RNA in situ hybridization (e). Scale bar: 50 μm. f Boxplot of average expression level of genes related to myofibroblast activation (left) and calcification (right) (Gene list in Supplementary Data 2) (n = 981 cells for C57BL/6J; 470 for Apoe−/−; 281 for Ldlr−/−). Each box depicts the IQR and median of each score, whiskers indicate 1.5 times the IQR. p, two-sided T-test p-value. g, h Expression map of monocyte chemoattractant genes. The average expression of genes for VICs (purple to yellow) in each mouse model was scaled by z-transformation and displayed on a scale of at least−2.5 (g) and RNA in situ hybridization of Csf1 and Cx3cl1 (h). Scale bar: 50 μm (left), 20 μm (right). Arrowheads indicate Csf1 (green) and Cx3cl1 (red) signal. i Enrichment plot of significant gene ontology (GO) terms related to inflammation. Genes were ranked by the fold change between knockout and wild-type models for VICs. j Transwell migration assay for evaluating monocyte chemotactic levels of VICs cultured with/without LDL or oxLDL. (n = 4). Samples without VIC were used for control. Size of field: 1272.79 μm2. Scale bar: 150 μm. k Adhesion assay of monocytes to ex vivo cultured aortic valves with/without LDL or oxLDL (n = 6 for non-treated, n = 7 for LDL, n = 6 for oxLDL). Scale bar: 200 μm. Dashed line, outline of valve leaflets. Image data are representative of three independent experiments unless otherwise stated. For (j) and (k), Kruskal–Wallis test with post-hoc Dunn’s test was used, and data are presented as mean ± SD.
Fig. 6
Fig. 6. VECs contain three main subtypes and Cd36+ VECs are markedly increased in hyperlipidemic mice.
a UMAP plot of 536 VECs colored by the clusters and mouse models as indicated. b UMAP plot of VECs color-coded by expression (gray to blue) of marker genes. c Pie chart for the relative proportion of the VEC subsets from each mouse model. d Expression of pro-inflammatory genes in VECs (VEC_C0, C1, and C2). Heatmap (left) and boxplot (right) of the average expression level of genes listed in the heatmap. Heatmap are displayed as expression values scaled by z-transformation on a scale of at least-2.5. Cells having no expression for pro-inflammatory genes were excluded (n = 274 cells for C57BL/6J; 88 for Apoe−/−; 80 for Ldlr−/−). Each box depicts the IQR and median of each score, whiskers indicate 1.5 times the IQR. p, two-sided T-test p-value. e Enrichment plot for significant Gene Ontology (GO) terms related to monocyte chemotaxis. Genes were ranked by the fold changes between knockout and wild-type models for cells in VEC clusters (VEC_C0, C1, and C2). f Identification of the localization of VEC subclusters using RNA in situ hybridization (Fgfr3 and Cd36) or immunofluorescence (PROX1). The graph indicates quantification of in situ hybridization using the CD36 probe (n = 5). Two-sided Mann–Whitney test was used. Arrowhead: Cd36+ signals in aortic valve. Scale bar: 50 μm. g UMAP plot of VECs color-coded by average expression (gray to red) of genes specific to pre-defined EC subtypes (top). Expression score of genes in EC1 and EC2-associated pathways in VEC_C0 and VEC_C1 (bottom). p, two-sided T-test p-value. h Enrichment map of significant Kyoto Encyclopedia for Genes and Genomes (KEGG) gene sets for each cell cluster. Color represents the adjusted p-value (padj) and size represents the normalized enrichment score (NES), calculated by fgsea R package. Image data are representative of three independent experiments unless otherwise stated. Data are presented as mean ± SD.
Fig. 7
Fig. 7. PPARγ pathway is activated in VECs of hyperlipidemic mice and conserved in human aortic valves.
a Average expression map of genes in PPARγ regulon, produced by Single-Cell Regulatory Network Inference and Clustering (SCENIC), for each cluster of leukocytes, VECs, and VICs. b UMAP plot of VECs color-coded by the activity of PPARγ regulon. Gene set activity was calculated by SCENIC. AUC: area under curve. c Immunostaining of PPARγ (red) and endomucin (EMCN, EC marker, green) in aortic valve with sinus from normal (chow diet) and hyperlipidemic mice (Apoe−/− and Ldlr−/− mice, WD for 16 weeks) (n = 4). DAPI (blue) was used to stain nuclei. The graph represents the relative MFI of PPARγ in the VECs. Kruskal–Wallis test with post-hoc Dunn’s test was used. Scale bar: 30 μm. d UMAP plot of 41,326 single-cells derived from human aortic valve, colored by the clusters (left) and samples (right). e Average expression map of genes in PPARγ regulon for each cell cluster from human aortic valve. f Pro-inflammatory (top) and cell adhesion molecule (bottom) scores in non-targeting siRNA (NC) and PPARG targeting siRNA-treated (PPARG knockdown, KD) human VECs under no (NT) and oxLDL treatment conditions. Each score represents the average expression level of the genes, as shown in Fig. 7g (n = 3). Each box depicts the IQR and median of each score, whiskers indicate 1.5 times the IQR. p, two-sided T-test p-value. g Expression map of pro-inflammatory genes (top) and cell adhesion molecules (bottom). The expression of genes in all samples was scaled by z-transformation. hj PPARγ IHC in human aortic valves (n = 7 for non-calcified, n = 5 for calcified). Representative image of PPARγ IHC (top) and H&E stain (bottom) (h), measurement of PPARγ+ cellular proportion in valvular cells (left) and VECs (right) (i) and the positive correlation between PPARγ+ VECs of non-calcified and the plasma levels of total cholesterol and LDL (j). For (i), two-sided Mann–Whitney test, and for (j), the Spearman correlation test were used. Scale bar: 40 μm (left), 20 μm (right). Image data are representative of three independent experiments unless otherwise stated. Data are presented as mean ± SD.
Fig. 8
Fig. 8. PPARγ activation protects the aortic valve against the inflammation.
a Adhesion assay of monocytes to ex vivo cultured aortic valve treated with oxLDL and/or inhibition of PPARγ by T0070907 (n = 7 for non-treated, n = 7 for oxLDL, n = 6 for oxLDL+T0070907). Scale bar: 50 μm. b, c Pro-inflammatory effect of T0070907 (PPARγ antagonist) on mouse aortic valve in vivo. Ldlr−/− mice were intraperitoneally injected daily with vehicle or T0070907 for 10 weeks with a WD feeding. Representative IHC images (b) and flow cytometry analysis presenting percentage of each immune cell subset (n = 6) (c). Scale bar: 30 μm. d Flow cytometry analysis showing anti-inflammatory effect of PPARγ activation by pioglitazone on mouse aortic valve in vivo. PCSK9-AAV-injected C57BL/6J mice were fed with pioglitazone-containing WD or normal WD for 6 weeks. Graphs present percentage of each immune cell subset (n = 10). e Proposed pathogenesis model of the early-stage aortic valve disease induced by hyperlipidemia. In hyperlipidemic states, oxidized LDL triggers aortic valvular inflammation by enhancing the productions of various cytokines and chemokines, leading to the recruitment of monocyte-derived MHC-IIhi macrophages. Meanwhile, PPARγ activation during hyperlipidemia inhibits the accumulations of monocytes and macrophages in the aortic valve. Top view (left, top), side view (left, bottom), and legends (right). VIC: valvular interstitial cell. VEC: valvular endothelial cell. Image data are representative of three independent experiments unless otherwise stated. Two-sided Mann–Whitney test (comparison of two groups) and Kruskal-Wallis test with post-hoc Dunn’s test (comparison of three or more groups) were used for group comparisons. Data are presented as mean ± SD.

References

    1. Iung B, Vahanian A. Epidemiology of acquired valvular heart disease. Can. J. Cardiol. 2014;30:962–970. doi: 10.1016/j.cjca.2014.03.022. - DOI - PubMed
    1. Yadgir S, et al. Global, regional, and national burden of calcific aortic valve and degenerative mitral valve diseases, 1990-2017. Circulation. 2020;141:1670–1680. doi: 10.1161/CIRCULATIONAHA.119.043391. - DOI - PubMed
    1. Dweck MR, Boon NA, Newby DE. Calcific aortic stenosis: a disease of the valve and the myocardium. J. Am. Coll. Cardiol. 2012;60:1854–1863. doi: 10.1016/j.jacc.2012.02.093. - DOI - PubMed
    1. Otto CM, Prendergast B. Aortic-valve stenosis–from patients at risk to severe valve obstruction. N. Engl. J. Med. 2014;371:744–756. doi: 10.1056/NEJMra1313875. - DOI - PubMed
    1. Leon MB, et al. Transcatheter aortic-valve implantation for aortic stenosis in patients who cannot undergo surgery. N. Engl. J. Med. 2010;363:1597–1607. doi: 10.1056/NEJMoa1008232. - DOI - PubMed

Publication types