. 2022 Sep 17;12(1):15635.
doi: 10.1038/s41598-022-18982-3.

A theory-based model of cumulative activity

Affiliations

A theory-based model of cumulative activity

Kole Phillips et al. Sci Rep. .

Abstract

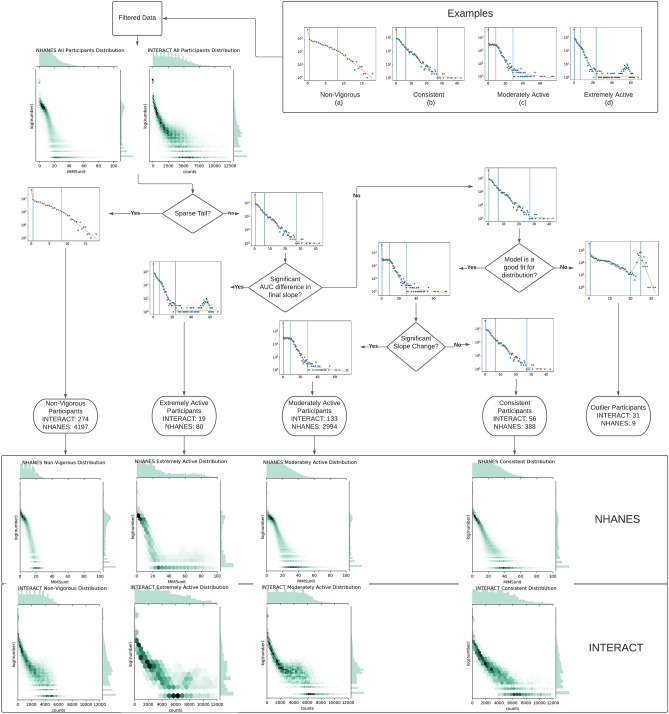
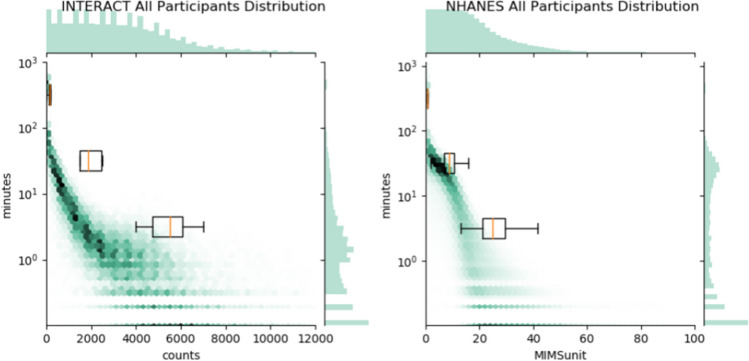
Energy expenditure can be used to examine the health of individuals and the impact of environmental factors on physical activity. One of the more common ways to quantify energy expenditure is to process accelerometer data into some unit of measurement for this expenditure, such as Actigraph activity counts, and bin those measures into physical activity levels. However, accepted thresholds can vary between demographics, and some units of energy measurements do not currently have agreed upon thresholds. We present an approach which computes unique thresholds for each individual, using piecewise exponential functions to model the characteristics of their overall physical activity patterns corresponding to well established sedentary, light, moderate and vigorous activity levels from the literature. Models are fit using existing piecewise fitting techniques and software. Most participants' activity intensity profile is exceptionally well modeled as piecewise exponential decay. Using this model, we find emergent groupings of participant behavior and categorize individuals into non-vigorous, consistent, moderately active, or extremely active activity intensity profiles. In the supplemental materials, we demonstrate that the parameters of the model correlate with demographics of age, household size, and level of education, inform behavior change under COVID lockdown, and are reasonably robust to signal frequency.


Conflict of interest statement

The authors declare no competing interests.

Figures

Figure 1
Figure 1
The process in which we classify participants after generating a model for them. Participants are assigned one of five activity intensity profiles based on the shape of their energy expenditure distribution. A participant is considered to be non-vigorous if they possess fewer than five data points in the vigorous activity range. If the participant’s vigorous activity level has a significant deviation between the area under the curves of the model’s slope and the actual data points, the participant is considered to be extremely active. If the participant has neither a Non-Vigorous nor an Extremely Active activity intensity profile and they have an R2 value of less than 0.9, they are classified as an outlier. The remaining participants are then sorted into Consistent if there is no significant change between the second and third slopes of the participant, or Moderately Active if there is a change.
Figure 2
Figure 2
The distributions of all participants for the NHANES and INTERACT studies. The boxplots in each figure represent the distributions of each breakpoint, with the orange line representing the median, the box illustrating the upper and lower quartiles of each breakpoint, and the whiskers indicating the range of breakpoints.
Figure 3
Figure 3
The distributions of the four slope metrics, the three breakpoint metrics, the R2 values, and the tail metrics for both INTERACT (top) and NHANES (bottom).
Figure 4
Figure 4
The process in which a participant is modelled. The plots above some stages in the process help visualize what a given participant’s data may look like at that particular stage.

References

    1. Heymsfield S, Bourgeois B, Thomas D. Assessment of human energy exchange: Historical overview. Eur. J. Clin. Nutr. 2017;71:294–300. doi: 10.1038/ejcn.2016.221. - DOI - PubMed
    1. World Health Organization. Healthy Diet, (accessed 22 September 2021). https://www.who.int/publications/m/item/healthy-diet-factsheet394 (2018).
    1. World Health Organization. WHO guidelines on Physical Activity and Sedentary Behaviour, (accessed 22 September 2021); https://www.who.int/publications/i/item/9789240015128 (2020). - PubMed
    1. GBD 2019 Risk Factors Collaborators Global burden of 87 risk factors in 204 countries and territories, 1990–2019: A systematic analysis for the Global Burden of Disease Study 2019. Global Health Metrics. 2020;396(10258):1223–1249. doi: 10.1016/S0140-6736(20)30752-2. - DOI - PMC - PubMed
    1. Kyu HH, et al. Physical activity and risk of breast cancer, colon cancer, diabetes, ischemic heart disease, and ischemic stroke events: Systematic review and dose-response meta-analysis for the Global Burden of Disease Study 2013. BMJ. 2016 doi: 10.1136/bmj.i3857. - DOI - PMC - PubMed

Publication types