. 2022 Oct:56:102465.
doi: 10.1016/j.redox.2022.102465. Epub 2022 Sep 11.

Redox imbalance in COVID-19 pathophysiology

Affiliations

Redox imbalance in COVID-19 pathophysiology

Nairrita Majumder et al. Redox Biol. 2022 Oct.

Abstract

Background: The pathophysiologic significance of redox imbalance is unquestionable as numerous reports and topic reviews indicate alterations in redox parameters during corona virus disease 2019 (COVID-19). However, a more comprehensive understanding of redox-related parameters in the context of COVID-19-mediated inflammation and pathophysiology is required.

Methods: COVID-19 subjects (n = 64) and control subjects (n = 19) were enrolled, and blood was drawn within 72 h of diagnosis. Serum multiplex assays and peripheral blood mRNA sequencing was performed. Oxidant/free radical (electron paramagnetic resonance (EPR) spectroscopy, nitrite-nitrate assay) and antioxidant (ferrous reducing ability of serum assay and high-performance liquid chromatography) were performed. Multivariate analyses were performed to evaluate potential of indicated parameters to predict clinical outcome.

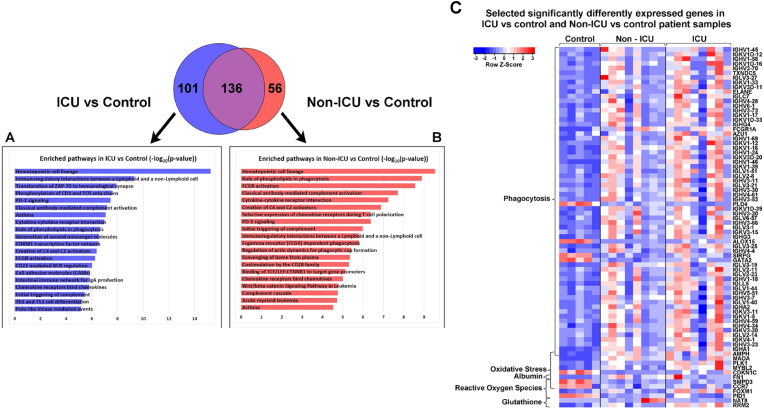
Results: Significantly greater levels of multiple inflammatory and vascular markers were quantified in the subjects admitted to the ICU compared to non-ICU subjects. Gene set enrichment analyses indicated significant enhancement of oxidant related pathways and biochemical assays confirmed a significant increase in free radical production and uric acid reduction in COVID-19 subjects. Multivariate analyses confirmed a positive association between serum levels of VCAM-1, ICAM-1 and a negative association between the abundance of one electron oxidants (detected by ascorbate radical formation) and mortality in COVID subjects while IL-17c and TSLP levels predicted need for intensive care in COVID-19 subjects.

Conclusion: Herein we demonstrate a significant redox imbalance during COVID-19 infection affirming the potential for manipulation of oxidative stress pathways as a new therapeutic strategy COVID-19. However, further work is requisite for detailed identification of oxidants (O2•-, H2O2 and/or circulating transition metals such as Fe or Cu) contributing to this imbalance to avoid the repetition of failures using non-specific antioxidant supplementation.

Keywords: COVID-19; EPR; Electron paramagnetic resonance; Redox imbalance; SARS-CoV-2; Transcriptomics; Uric acid.


Conflict of interest statement

Declaration of competing interest The authors declare that they have no known competing financial interests or personal relationships that could have appeared to influence the work reported in this paper.

Figures

Image 1
Graphical abstract
Fig. 1
Fig. 1
Multiplex analyses of serum samples. Heat map representing A) Pro-inflammatory panel B) Cytokine panels C) Chemokine panel D) Vascular panel marker quantification in serum samples from Control subjects (n = 19), non-ICU (n = 38) and ICU (n = 13) admissions. The values are presented as Log2 transforms. Data analyzed by Kruskal-Wallis test followed by Dunn's multiple comparison test. *p < 0.05 vs control, #p < 0.05 ICU vs non-ICU patients.
Fig. 2
Fig. 2
mRNA seq analyses. Significant pathways associated with differentially expressed genes in COVID-19 patient samples in the comparison of ICU vs Control and Non-ICU vs Control group. Venn diagram shows the number of significantly differentially expressed genes in ICU vs Control group, non-ICU vs Control group, and the common genes between these two groups. Bar charts show the top 20 significantly enriched pathways of significantly differentially expressed genes in ICU vs control (A) and non-ICU vs control (B) patient samples. ToppGene functional enrichment analysis was used. Detailed information is provided in supplementary file S1 sheet 3–6. C) Heatmap of the expression of the selected significantly differentially expressed genes in ICU vs control and non-ICU vs control patient samples. These genes are relevant to the following processes including albumin, glutathione, oxidative stress, phagocytosis, and reactive oxygen species. The RPKM values shown in the heatmap were normalized by each row (gene). Detailed information is provided in supplementary file S2 sheet 4.
Fig. 3
Fig. 3
Gene set enrichment analyses. A) Bar plots for normalized enrichment scores from gene set enrichment analysis of the expression changes (ICU vs NON-ICU) against MSigDB Hall mark gene sets. Shown are FDR q < 0.05. B) Gene set enrichment analysis of the genes sorted by the expression changes (ICU vs NON-ICU; the blue-to-red spectrum) against gene set “ROS Pathway” (vertical bars) with top leading genes shown on the left bottom and heatmap visualization of the gene expression for all leading genes shown on the right. C) similar to B but for the gene set “IFN-α response). (For interpretation of the references to color in this figure legend, the reader is referred to the Web version of this article.)
Fig. 4
Fig. 4
Real-time PCR gene expression Analyses. Expression levels of A) IFN- α, B) IFN-α2, C) IFN-β1, and D) MAVS in the buffy coats from control subjects and COVID-19 subjects.) Data represents comparison between non-ICU (n = 51) and ICU (n = 13) admissions. Data is normalized to fold change to control and analyzed by non-parametric t-test. Data is analyzed by Mann Whitney test. *p < 0.05, ***p < 0.001, ****p < 0.0001.
Fig. 5
Fig. 5
EPR studies of oxidation of CMH by human serum samples. A) Representative room temperature X-band EPR spectra of CM radical. (A) Blank (CMH without serum in PBS), Control subject (serum from non-COVID-19 subjects), COVID-19 (serum from COVID-19 subjects), Non-ICU, (serum from non-ICU COVID-19 subjects), and ICU (serum from ICU COVID-19 subjects). B) Plot of EPR signal intensity of CM radical in the serum samples from control (n = 37) and COVID-19 patients (n = 61). C) Plot of EPR signal intensity of CM radical in the serum samples from control subjects (n = 37) and COVID-19 subjects with non-ICU (n = 49) and ICU (n = 12) hospital admissions. Data analyzed by Mann Whitney test (B) or by Kruskal-Wallis test followed by Dunn's multiple comparison test(C). ***p < 0.001.
Fig. 6
Fig. 6
Ascorbate radical generation quantification by EPR. A) Representative room temperature X-band EPR spectra of ascorbate radical. Blank (ascorbate without serum in PBS), Control subject (serum from non-COVID-19 subjects), COVID-19 (serum from COVID-19 subjects), Non-ICU (serum from non-ICU COVID-19 subjects) and, ICU (serum from ICU COVID-19 subjects). B) Plot of EPR signal intensity of ascorbate radical comparing in the serum samples from control (n = 19) and COVID-19 patients (n = 61). C) Plot of EPR signal intensity of ascorbate radical in the serum samples from control subjects (n = 37) and COVID-19 subjects with Non-ICU (n = 49) and ICU (n = 12) hospital admissions. Data analyzed by Mann Whitney test (B) or by Kruskal-Wallis test followed by Dunn's multiple comparison test(C). *p < 0.05, ***p < 0.001, ****p < 0.0001.
Fig. 7
Fig. 7
NOx estimation in the serum. NOx (Nitrite + Nitrate) levels in serum from control subjects (n = 18) and COVID-19 patients (n = 48). B) NOx levels comparing serum from control subjects (n = 18) with non-ICU (n = 36) and ICU (n = 12) admissions. Data is analyzed by Mann Whitney test (A) and Kruskal-Wallis test followed by Dunn's multiple comparison test (B). *p < 0.05, ***p < 0.001, ****p < 0.0001.
Fig. 8
Fig. 8
Antioxidant capacity and uric acid measurements. A) Serum antioxidant capacity measured by FRAS assay between control subjects (n = 19) and COVID-19 patients (n = 47). B) FRAS assay comparing serum from control subjects (n = 19) with non-ICU (n = 34) and ICU (n = 13) admissions. C) Uric acid concentration in serum from control subjects (n = 19) and COVID-19 patients (n = 48). B) Uric acid concentration comparing serum from control subjects (n = 19) with non-ICU (n = 35) and ICU (n = 13) admissions. Data is analyzed by Mann Whitney test (A, C) and Kruskal-Wallis test followed by Dunn's multiple comparison test (B and D). *p < 0.05, ***p < 0.001, ****p < 0.0001.

References

    1. Chan J.F., Yuan S., Kok K.H., To K.K., Chu H., Yang J., Xing F., Liu J., Yip C.C., Poon R.W., Tsoi H.W., Lo S.K., Chan K.H., Poon V.K., Chan W.M., Ip J.D., Cai J.P., Cheng V.C., Chen H., Hui C.K., Yuen K.Y. A familial cluster of pneumonia associated with the 2019 novel coronavirus indicating person-to-person transmission: a study of a family cluster. Lancet. 2020;395(10223):514–523. - PMC - PubMed
    1. Chen N., Zhou M., Dong X., Qu J., Gong F., Han Y., Qiu Y., Wang J., Liu Y., Wei Y., Xia J., Yu T., Zhang X., Zhang L. Epidemiological and clinical characteristics of 99 cases of 2019 novel coronavirus pneumonia in Wuhan, China: a descriptive study. Lancet. 2020;395(10223):507–513. - PMC - PubMed
    1. Wang D., Hu B., Hu C., Zhu F., Liu X., Zhang J., Wang B., Xiang H., Cheng Z., Xiong Y., Zhao Y., Li Y., Wang X., Peng Z. Clinical characteristics of 138 hospitalized patients with 2019 novel coronavirus-infected pneumonia in Wuhan, China. JAMA. 2020;323(11):1061–1069. - PMC - PubMed
    1. W.H. Organization . 2021. WHO Coronavirus (COVID-19) Dashboard.
    1. Chen K.K., Minakuchi M., Wuputra K., Ku C.C., Pan J.B., Kuo K.K., Lin Y.C., Saito S., Lin C.S., Yokoyama K.K. Redox control in the pathophysiology of influenza virus infection. BMC Microbiol. 2020;20(1):214. - PMC - PubMed

Publication types