. 2022 Sep 1:16:888362.
doi: 10.3389/fnins.2022.888362. eCollection 2022.

Pcdh11x controls target specification of mossy fiber sprouting

Affiliations

Pcdh11x controls target specification of mossy fiber sprouting

Wenshu Luo et al. Front Neurosci. .

Abstract

Circuit formation is a defining characteristic of the developing brain. However, multiple lines of evidence suggest that circuit formation can also take place in adults, the mechanisms of which remain poorly understood. Here, we investigated the epilepsy-associated mossy fiber (MF) sprouting in the adult hippocampus and asked which cell surface molecules define its target specificity. Using single-cell RNAseq data, we found lack and expression of Pcdh11x in non-sprouting and sprouting neurons respectively. Subsequently, we used CRISPR/Cas9 genome editing to disrupt the Pcdh11x gene and characterized its consequences on sprouting. Although MF sprouting still developed, its target specificity was altered. New synapses were frequently formed on granule cell somata in addition to dendrites. Our findings shed light onto a key molecular determinant of target specificity in MF sprouting and contribute to understanding the molecular mechanism of adult brain rewiring.

Keywords: Pcdh11x; axonal rewiring; cell adhesion molecule; granule cell; mossy fiber sprouting; protocadherin; synaptic adhesion molecule; target specificity.


Conflict of interest statement

The authors declare that the research was conducted in the absence of any commercial or financial relationships that could be construed as a potential conflict of interest.

Figures

FIGURE 1
FIGURE 1
CAM expression changes during MF sprouting. (A) Experimental design and schedules used for generating the single-cell RNAseq dataset (Luo et al., 2021; GSE 161619). (B) Volcano plots show differentially expressed CAMs in GC 1 (left panel) and 14 days (right panel) after intrahippocampal KA injection compared to controls. Red points denote differentially expressed genes (FDR < 0.05 and fold change > 2). Gene names highlighted with blue were previously reported in epilepsy and/or MF sprouting models (see section “Discussion”). Gene names highlighted with red were shortlisted for further analysis in this study. (C) Heat map of top 10 differentially expressed genes and genes/molecules previously reported in epilepsy and/or MF sprouting models. Scale bar shows log2-normalized gene expression level.
FIGURE 2
FIGURE 2
Genomic targeting of CAMs in adult GCs. (A) Schematic representation of the genome targeting approach for Fat3, Cntn4, and Pcdh11x. Table shows targeted exons and the presence or absence of mutations during cell culture (Cas9-expressing N2A cells) and in vivo (Cas9-expressing mice) validation. (B) In vivo genomic targeting of Pcdh11x. Left panel shows specific gRNA design and experimental schedule. Right panel shows sequence maps of detected mutations and/or deletions in dentate gyrus lysates prepared from two different mice.
FIGURE 3
FIGURE 3
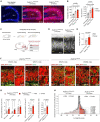
PCDH11X protein expression in the dentate gyrus. (A) Schematic representation of the experimental design. (B) Confocal images show PCDH11X and ZnT3 immunostaining in the dentate gyrus 6 days after saline (upper row) and KA injection (lower row). From left to right, PCDH11X immunostaining, PCDH11X and ZnT3 immunostaining, higher magnification images of the PCDH11X and ZnT3 immunostaining, and finally higher magnification images of the regions highlighted with white frames in the previous panels are shown. In the lower right panels, inserts show PCDH11X localization in ZnT3 + MF boutons in IML (empty arrowheads) and in GCL (white arrowheads). (C) Quantification of the PCDH11X signal in controls and 6–10 days after KA (two-way ANOVA, FLayer (3,27) = 17, p < 0.0001; FTreatment (1,9) = 14, p = 0.0051; FLayer x Treatment (3,27) = 5.1, p = 0.0066; post hoc analyses: control vs KA, hilus: ns, p = 0.94; GCL: p = 0.0008; IML: p = 0.0002; MML/OML: p = 0.0095). (D) Schematic representation of the experimental design in Cas9-expressing and -non-expressing mice. (E) Confocal images show PCDH11X immunostaining in the dentate gyrus of Pcdh11xControl+KA and Pcdh11xKO+KA mice 14 days after KA. Areas highlighted with boxes are shown in higher magnification in panels (a–d). (F) Quantification of tRFP-normalized PCDH11X levels in dentate gyrus of Pcdh11xControl+KA and Pcdh11xKO+KA mice [two-way ANOVA, FLayer (3,24) = 19, p < 0.0001; FKO (1,8) = 3.7, p = 0.091; FLayer x KO (3,24) = 5.5, p = 0.0049; post hoc analyses: Pcdh11xControl+KA vs Pcdh11xKO+KA, hilus: ns, p = 0.17; GCL: p = 0.012; IML: p = 0.0092; MML/OML: p = 0.62] (for tRFP-non-normalized values see Supplementary Figure 2).
FIGURE 4
FIGURE 4
Impact of Pcdh11x KO on MF sprouting. (A) Confocal images show DAPI immunostaining and virally-delivered tRFP signal in the dentate gyrus of non-injected control, Pcdh11xControl+KA, and Pcdh11xKO+KA mice. In each sample, the width of GCL was determined as the average of six width measurement (w1 to w6) based on DAPI staining. (B) Left plot shows quantification of average GCL width in non-injected, Pcdh11xControl+KA, and Pcdh11xKO+KA samples. The transfected area was localized based on the tRFP signal. Right plot shows quantification of GCL area (quantified as the circumference of DAPI staining) in non-injected, Pcdh11xControl+KA, and Pcdh11xKO+KA samples. Each data point represents one animal (one-way ANOVA tests, F(2,17) = 29, p < 0.0001; p-values of the post hoc analyses are indicated in the figure). (C) Experimental design for visualizing MF boutons by Timm’s staining and ZnT3 immunostaining. (D) Timm’s staining shows stratification of MF boutons in Pcdh11xControl+KA and Pcdh11xKO+KA mice. (E) Quantification of Timm’s signal intensity between GCL and IML in Pcdh11xControl+KA and Pcdh11xKO+KA mice (Welch’s t-test). (F) ZnT3 staining shows stratification of MF boutons in Pcdh11xControl+KA and Pcdh11xKO+KA mice. Areas highlighted with boxes are shown in higher magnification in panels (a–h). (G) Quantification of ZnT3 + puncta density in the inner and outer half of GCL and in IML [left plot; two-way ANOVA, FLayer (2,18) = 31, p < 0.0001; FKO (1,9) = 7.8, p = 0.021; FLayer  x  KO (2,18) = 1.9, p = 0.18; post hoc analyses: Pcdh11xControl+KA vs Pcdh11xKO+KA, GCL inner: p = 0.01; GCL outer: p = 0.013; IML: ns, p = 0.46], in GCL and IML together (middle plot; Welch’s t-test, p = 0.016), and the GCL/IML ratio of ZnT3 + puncta density (right plot; Welch’s t-test, p = 0.0022). (H) Distribution of GC somata (in %) that are surrounded by 0, 1, 2, …, 14 ZnT3 + boutons in Pcdh11xControl+KA and Pcdh11xKO+KA mice (two-way ANOVA, F#  of  puncta (14,126) = 141, p < 0.0001; FKO (1,9) = 2.8, p = 0.13; F#  of  puncta  x  KO (14,126) = 26, p < 0.0001; p-values of the post hoc analysis are indicated in the figure; p-values are > 0.05 for 6 or more puncta).
FIGURE 5
FIGURE 5
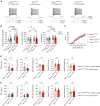
Electrophysiological characterization of Pcdh11xControl+KA and Pcdh11xKO+KA GCs. (A) Example electrophysiological traces show responses to 1.5 s long current pulse injections in Pcdh11xControl, Pcdh11xKO, Pcdh11xControl+KA, and Pcdh11xKO+KA GCs. (B) Quantification of resting membrane potential, input resistance, and capacitance (two-way ANOVA tests; resting membrane potential: FKA  treatment (1,135) = 30, p < 0.0001; FKO (1, 135) = 1.1, p = 0.30; FKA  treatment  x  KO (1,135) = 0.35, p = 0.56; input resistance: FKA  treatment (1,135) = 0.0009, p = 0.98; FKO (1, 135) = 0.92, p = 0.33; FKA  treatment  x  KO (1,135) = 4.3, p = 0.04; capacitance: FKA  treatment (1,135) = 9.8, p = 0.0022; FKO (1, 135) = 1.8, p = 0.18; FKA  treatment  x  KO (1,135) = 1.1, p = 0.30; p-values of post hoc analyses are indicated in the figure; data points represent single cells). (C) Quantification of steady-state current injection-evoked action potential (AP) counts. (D) Quantification of EPSC parameters recorded from Pcdh11xControl+KA and Pcdh11xKO+KA GCs (Mann–Whitney U test; data points represent single cells recorded from males). (E) Quantification of IPSC parameters recorded from Pcdh11xControl+KA and Pcdh11xKO+KA GCs (Mann-Whitney U test; data points represent single cells recorded from males).
FIGURE 6
FIGURE 6
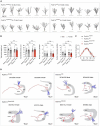
Morphological characterization of Pcdh11xControl+KA and Pcdh11xKO+KA GCs. (A) Morphological reconstruction of dendrites from Pcdh11xControl, Pcdh11xKO, Pcdh11xControl+KA, and Pcdh11xKO+KA GCs. (B) Quantification of dendritic parameters, such as total dendrite length, total dendritic branch count, number of primary dendrites, and number of secondary dendrites (two-way ANOVA test; data points represent single cells). (C) Sholl analysis of dendritic complexity. None of the comparisons had significance p < 0.05 (two-way ANOVA test). (D) Morphological reconstruction of axons from Pcdh11xControl, Pcdh11xKO, Pcdh11xControl+KA, and Pcdh11xKO+KA GCs. Axons and dendrites are shown in red and blue respectively. For further examples, see Supplementary Figure 3.
FIGURE 7
FIGURE 7
Immuno-electron microscopy characterization of Pcdh11xKO+KA GC synapses. (A) Transmission electron microscopy image of four GC somata in GCL. In white box, ZnT3 + boutons are visible next to GC soma. (B) Magnification of the white box in panel A. GC soma, dendrite, and presynaptic ZnT3 + boutons are presudo-colored in red, yellow, and blue, respectively. (C) Magnification of the area labeled with C in panel B shows synapses on dendrites (yellow arrowheads). (D) Image shows the next section of what is shown in panel (B). (E–G) Magnification of the areas labeled with E, G, and F in panel (D) show somatic, somatic and dendritic, and dendritic synapses, respectively (yellow and red arrowheads). In the lower right part of panel (F), a dendritic synapse is also visible. However, the presynaptic compartment is lacking ZnT3 and thus MF identity of this synapse could not be confirmed. (H) 3D reconstruction of ZnT3 + boutons and synapses shown in panels (A–F). (I,J) Images show additional dendritic synapses with multiple release sites (yellow arrowheads) from the same animal. (K) Image show five GC somata in GCL. (L) Magnification of the area shown in panel (K). (M,N) Magnification of the areas labeled with M and N in panel (L) show somatic synapses with one and multiple release sites, respectively (red arrowheads).
FIGURE 8
FIGURE 8
Possible models for PCDH11X function in MF sprouting. (A) PCDH11X is surface-expressed on sprouting GC axons as well as in both the IML and GCL, and homophilic trans PCDH11X interactions serve as a repellant in both layers. This model requires a second unknown modulator that selectively negates repellant PCDH11x signaling in IML. (B) PCDH11X is an attractant and is surface displayed on sprouting GC axons as well as GC dendrites in IML. Homophilic PCDH11X interactions drive selective synapse targeting to the IML during sprouting. (C) PCDH11X is an attractant and is surface displayed on sprouting GCL axons as well as on somata and dendrites both in GCL and IML. This model requires a second unknown modulator that competes for binding with PCDH11X and outcompetes homophilic trans interactions.

Similar articles

Cited by

References

    1. Apóstolo N., Smukowski S. N., Vanderlinden J., Condomitti G., Rybakin V., Ten Bos J., et al. (2020). Synapse type-specific proteomic dissection identifies IgSF8 as a hippocampal CA3 microcircuit organizer. Nat. Commun. 11:5171. 10.1038/s41467-020-18956-x - DOI - PMC - PubMed
    1. Bagri A., Cheng H. J., Yaron A., Pleasure S. J., Tessier-Lavigne M. (2003). Stereotyped pruning of long hippocampal axon branches triggered by retraction inducers of the semaphorin family. Cell 113 285–299. 10.1016/s0092-8674(03)00267-8 - DOI - PubMed
    1. Baig D. N., Yanagawa T., Tabuchi K. (2017). Distortion of the normal function of synaptic cell adhesion molecules by genetic variants as a risk for autism spectrum disorders. Brain Res. Bull. 129 82–90. 10.1016/j.brainresbull.2016.10.006 - DOI - PubMed
    1. Basu R., Duan X., Taylor M. R., Martin E. A., Muralidhar S., Wang Y., et al. (2017). Heterophilic Type II Cadherins Are Required for High-Magnitude Synaptic Potentiation in the Hippocampus. Neuron 96 160–176.e8. 10.1016/j.neuron.2017.09.009 - DOI - PMC - PubMed
    1. Ben-Ari Y., Cossart R. (2000). Kainate, a double agent that generates seizures: Two decades of progress. Trends Neurosci. 23 580–587. 10.1016/s0166-2236(00)01659-3 - DOI - PubMed

LinkOut - more resources