. 2022 Sep 1:16:960149.
doi: 10.3389/fnins.2022.960149. eCollection 2022.

The Polycomb group gene rnf2 is essential for central and enteric neural system development in zebrafish

Affiliations

The Polycomb group gene rnf2 is essential for central and enteric neural system development in zebrafish

Gang Feng et al. Front Neurosci. .

Abstract

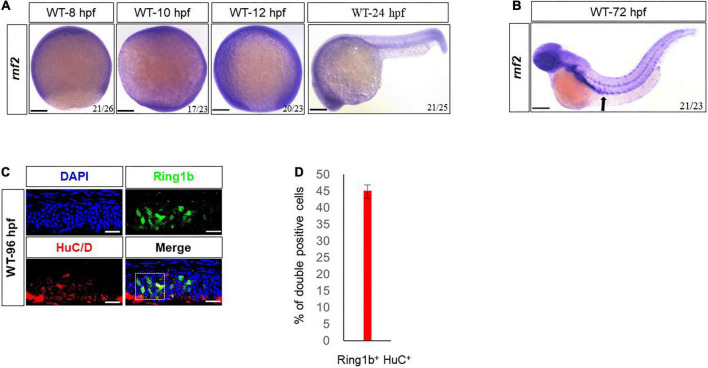
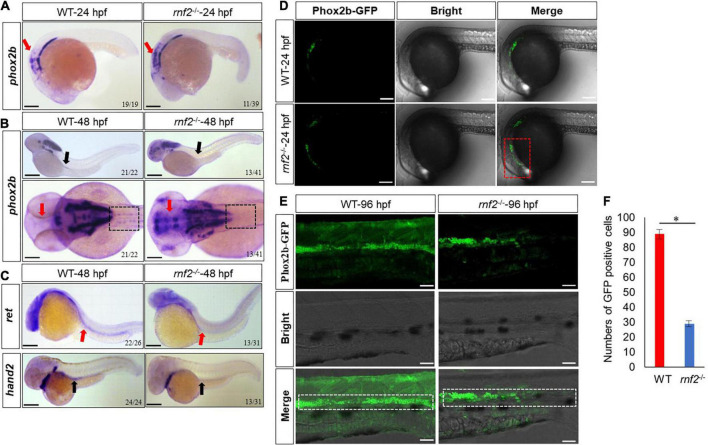
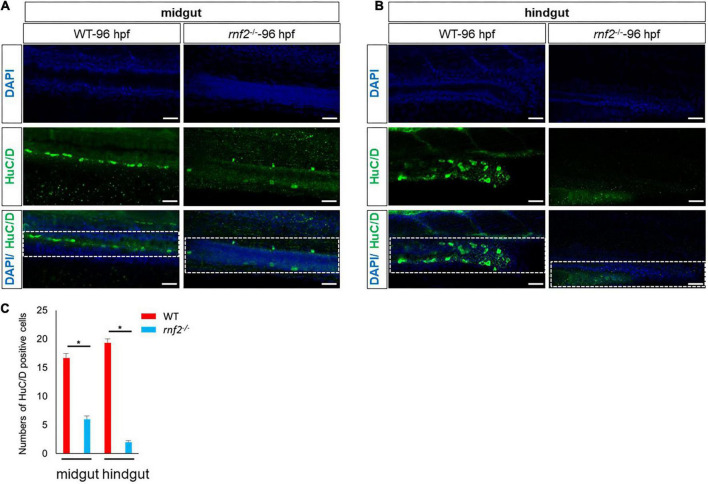
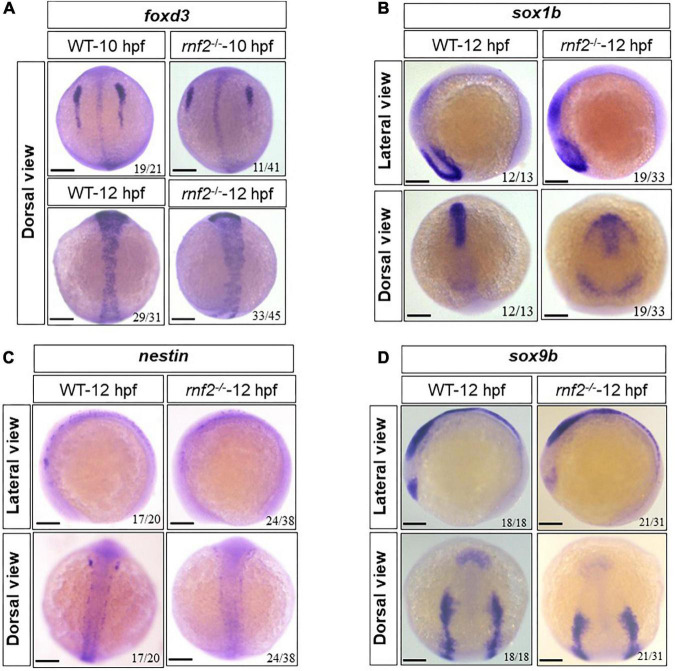
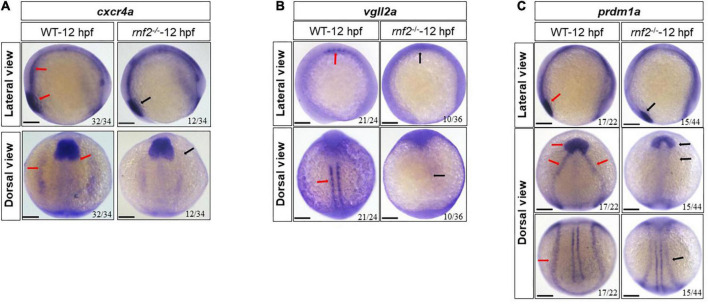
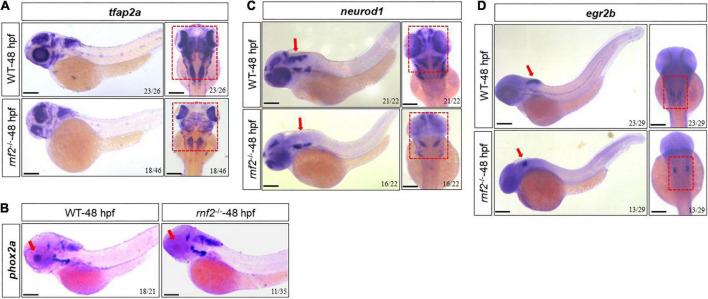
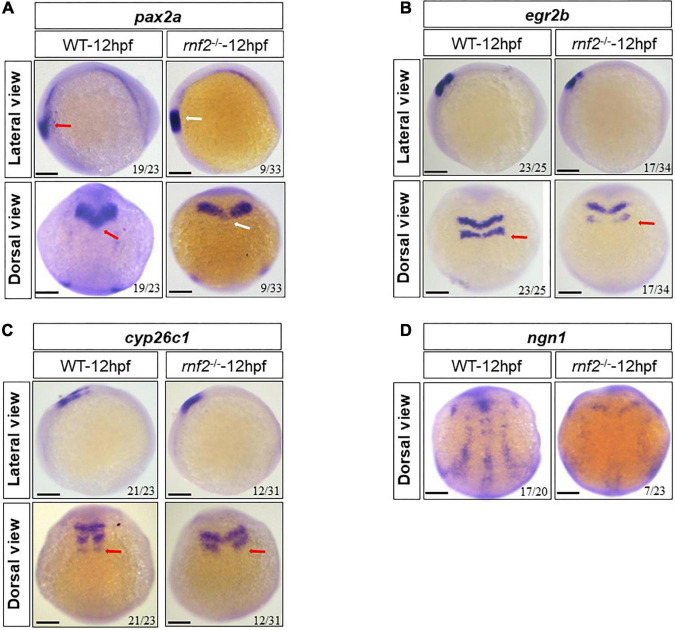
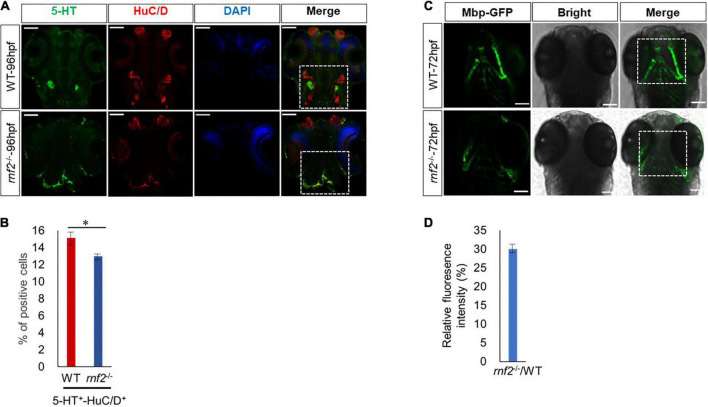
The development of central nervous system (CNS) and enteric nervous system (ENS) is under precise and strict control in vertebrates. Whether and how the Polycomb repressive complex 1 (PRC1) is involved in it remain unclear. To investigate the role of PRC1 in the nervous system development, using CRISPR/Cas9 technology, we have generated mutant zebrafish lines for the rnf2 gene which encodes Ring1b, the enzymatic component of the PRC1 complex. We show that rnf2 loss of function leads to abnormal migration and differentiation of neural crest and neural precursor cells. rnf2 mutant embryos exhibit aganglionosis, in which the hindgut is devoid of neurons. In particular, the formation of 5-HT serotonin neurons and myelinating glial cells is defective. Furthermore, ectopic expression of ENS marker genes is observed in forebrain of rnf2 mutant embryos. These findings suggest that the rnf2 gene plays an important role in the migration and differentiation of neural precursor cells, and its absence leads to abnormal development of ENS and CNS in zebrafish.

Keywords: CNS; ENS; PRC1; neural crest; neural precursor cells; rnf2.


Conflict of interest statement

The authors declare that the research was conducted in the absence of any commercial or financial relationships that could be construed as a potential conflict of interest.

Figures

FIGURE 1
FIGURE 1
Expression patterns of rnf2 in zebrafish embryos. (A) Whole mount in situ hybridization (WISH) of rnf2 at the indicated time points. (B) The expression of rnf2 at 72 hpf WT embryos. Black arrows showing the expression of rnf2 in the gut of zebrafish embryos. (C) Immunohistochemistry images of Rnf2 and HuC/D in zebrafish gut (40 × oil, embryos direction: anterior is to the left). The overlapping of Rnf2 and HuC/D expression is marked by the white box. (D) Quantitation of percentage of Rnf2/HuC double positive cells (n = 29). The experiments were repeated at least three times. Scale bar: 0.1 mm.
FIGURE 2
FIGURE 2
The effect of rnf2 deficiency on the migration of enteric neural precursor cells in zebrafish embryos. (A) The expression of phox2b in rnf2–/– and WT embryos at 24 hpf. Red arrows showing the reduced expression of phox2b in intestinal bulb of mutant embryos. Scale bar = 0.1 mm. (B) The expression of phox2b in rnf2–/– and WT embryos at 48 hpf. Black arrows showing the reduced expression of phox2b in the gut of mutant embryos, red arrows showing the ectopic expression of phox2b in the brain regions. The dashed black box showing the compromised migration of ENPCs. Upper: lateral view; bottom: dorsal view. (C) The expression of ret and hand2 in rnf2–/– and WT embryos at 48 hpf. Black arrows showing the reduced expression of hand2 in the gut of mutant embryos; red arrows showing the reduced expression of ret. The dashed black box showing the compromised migration of ENPCs. Upper: lateral view; bottom: lateral view. (D) The expression of Phox2b-GFP in the brain regions of rnf2–/– and WT embryos at 24 hpf (40 × oil, lateral view). The numbers of samples were 28 and 24 in 24 hpf WT and rnf2–/– embryos, respectively. The red dashed box showing the expansion of GFP signals. (E) The expression of Phox2b-GFP in gut regions of rnf2–/– and WT embryos at 96 hpf (40 × oil, lateral view and head is to the left). The white dashed box showing the different distribution of GFP+ signals in the gut of WT and rnf2–/– embryos at 96 hpf. The numbers of samples were 30 and 27 in 96 hpf WT and rnf2–/– embryos, respectively. (F) Quantitation of GFP positive cells in (E). The star indicates significant differences at p ≤ 0.05. The experiments were repeated at least three times. Scale bar: 0.1 mm.
FIGURE 3
FIGURE 3
The deficiency of rnf2 decreased the enteric neurons in zebrafish embryos. (A) Confocal images showing HuC/D positive enteric neurons in midgut of rnf2–/– and WT embryos at 96 hpf (40 × oil, lateral view and head is to the left). The white dashed box showing the different distribution of HuC/D+ signals in the midgut of WT and rnf2–/– embryos at 96 hpf. (B) Confocal images showing HuC/D positive enteric neurons in hindgut of rnf2–/– and WT embryos at 96 hpf (40 × oil, lateral view and head is to the left). The white dashed box showing the different distribution of HuC/D+ signals in the hindgut of WT and rnf2–/– embryos at 96 hpf. Scale bar: 0.1 mm. (C) Quantitation of HuC positive cells in (A,B). The numbers of samples were 26 and 21 in 96 hpf WT and rnf2–/– embryos, respectively. The star indicates significant differences at p ≤ 0.05. The experiments were repeated at least three times. Scale bar: 0.1 mm.
FIGURE 4
FIGURE 4
The effect of loss of rnf2 on the specification of neural crest cells. (A) The expression of foxd3 in rnf2–/– and WT embryos at 10 and 12 hpf. Dorsal view. (B) The expression of sox1b in rnf2–/– and WT embryos at 12 hpf. Upper: lateral view, bottom: dorsal view. (C) The expression of nestin in rnf2–/– and WT embryos at 12 hpf. Upper: lateral view, bottom: dorsal view. (D) The expression of sox9b in rnf2–/– and WT embryos at 12 hpf. Upper: lateral view, bottom: dorsal view. The experiments were repeated at least three times. Scale bar = 0.1 mm.
FIGURE 5
FIGURE 5
The effect of rnf2 deficiency on differentiation of neural crest in zebrafish embryos. (A) The expression of cxcr4a in rnf2–/– and WT embryos at 12 hpf. Upper: lateral view, bottom: dorsal view. (B) The expression of vgll2a in rnf2–/– and WT embryos at 12 hpf. Upper: lateral view, bottom: dorsal view. (C) The expression of prdm1a in rnf2–/– and WT embryos at 12 hpf. Upper: lateral view; middle: dorsal anterior view; bottom: dorsal posterior view. Red arrows showing the expression of cxcr4a, vgll2a, and prdm1a in 12 hpf WT embryos, black arrows showing the reduced expression of cxcr4a, vgll2a, and prdm1a in 12 hpf rnf2–/– mutant embryos. The experiments were repeated at least three times. Scale bar = 0.1 mm.
FIGURE 6
FIGURE 6
The effect of rnf2 deficiency on central nervous system development in zebrafish embryos. (A) The expression of tfap2a in rnf2–/– and WT embryos at 48 hpf. Left: lateral view; right: dorsal view of the brain. The red dashed boxes showing the different expansion of tfap2a in the brain regions of rnf2–/– embryos at 48 hpf. (B) The expression of phox2a in rnf2–/– and WT embryos at 48 hpf. The red boxes and arrows showing the loss of phox2a expression in the brain regions of mutant embryos. Lateral view. (C) The expression of neurod1 in rnf2–/– and WT embryos at 48 hpf. The red boxes and arrows showing the loss of neurod1 expression in MHB and hindbrain of mutant embryos. Left: lateral view; right: dorsal view of the brain. (D) The expression of egr2b in rnf2–/– and WT embryos at 48 hpf. The red arrows showing the reduced egr2b expression in MHB of mutant embryos. Left: lateral view; right: dorsal view of the brain. The experiments were repeated at least three times. Scale bar = 0.1 mm.
FIGURE 7
FIGURE 7
The effect of ring1b deficiency on the early development of brain in zebrafish embryos. (A) The expression of pax2a in rnf2–/– and WT embryos at 12 hpf. Upper: lateral view, bottom: dorsal view. The red and white arrows, respectively, showing the different expression of pax2a in WT and rnf2–/– embryos at 12 hpf. (B) The expression of egr2b in rnf2–/– and WT embryos at 12 hpf. Upper: lateral view, bottom: dorsal view. The red arrows showing the different expression of egr2b in WT and rnf2–/– embryos at 12 hpf. (C) The expression of cyp26c1 in rnf2–/– and WT embryos at 12 hpf. Upper: lateral view, bottom: dorsal view. The red arrows showing the different expression of cyp26c1 in WT and rnf2–/– embryos at 12 hpf. (D) The expression of ngn1 in rnf2–/– and WT embryos at 12 hpf. The experiments were repeated at least three times. Scale bar = 0.1 mm.
FIGURE 8
FIGURE 8
Loss of Rnf2 leads to neuronal differentiation defects in zebrafish embryos. (A) Confocal images showing the expression of HuC/D and 5-HT in zebrafish brain at 96 hpf (40 × oil). Dorsal view. The white dashed boxes showing the overlapping of HuC/D+ and 5-HT+ signals in the brain of WT and rnf2–/– embryos at 96 hpf. (B) Quantitation of percentage of 5-HT/HuC double positive cells in (A). The numbers of samples were 20 and 18 in 96 hpf WT and rnf2–/– embryos, respectively. The star indicates significant differences at p ≤ 0.05. (C) Confocal images showing the expression of Mbp-GFP in zebrafish brain at 72 hpf (40 × oil). Dorsal view. The white dashed boxes showing the distribution of Mbp+ signals in the brain of WT and rnf2–/– embryos at 72 hpf. (D) Quantitation of relative fluorescence intensity in (C). The numbers of samples were 28 and 20 in 72 hpf WT and rnf2–/– embryos, respectively. The experiments were repeated three times. Scale bar = 0.1 mm.

Similar articles

Cited by

References

    1. Alexandre P., Xavier M., Harold C., Christo G., Jean-FranÇois B. (1999). The homeobox gene Phox2b is essential for the development of autonomic neural crest derivatives. Nature 399 366–370. 10.1038/20700 - DOI - PubMed
    1. Almeida M., Pintacuda G., Masui O., Koseki Y., Gdula M., Cerase A., et al. (2017). PCGF3/5-PRC1 initiates Polycomb recruitment in X chromosome inactivation. Science 356 1081–1084. 10.1126/science.aal2512 - DOI - PMC - PubMed
    1. Amiel J., Lyonnet S. (2008). Hirschsprung disease, associated syndromes, and genetics: A review. J. Med. Genet. 38 729–39. 10.1136/jmg.38.11.729 - DOI - PMC - PubMed
    1. Andrzejczuk L. A., Banerjee S., England S. J., Voufo C., Kamara K., Lewis K. E. (2018). Tal1, Gata2a, and Gata3 Have Distinct Functions in the Development of V2b and Cerebrospinal Fluid-Contacting KA Spinal Neurons. Front. Neurosci. 12:170. 10.3389/fnins.2018.00170 - DOI - PMC - PubMed
    1. Asakawa K., Kawakami K. (2009). The Tol2-mediated Gal4-UAS method for gene and enhancer trapping in zebrafish. Methods 49 275–281. 10.1016/j.ymeth.2009.01.004 - DOI - PMC - PubMed

LinkOut - more resources