. 2022 Sep 2:15:961995.
doi: 10.3389/fnmol.2022.961995. eCollection 2022.

Differential synaptic mechanism underlying the neuronal modulation of prefrontal cortex, amygdala, and hippocampus in response to chronic postsurgical pain with or without cognitive deficits in rats

Affiliations

Differential synaptic mechanism underlying the neuronal modulation of prefrontal cortex, amygdala, and hippocampus in response to chronic postsurgical pain with or without cognitive deficits in rats

Zhen Li et al. Front Mol Neurosci. .

Abstract

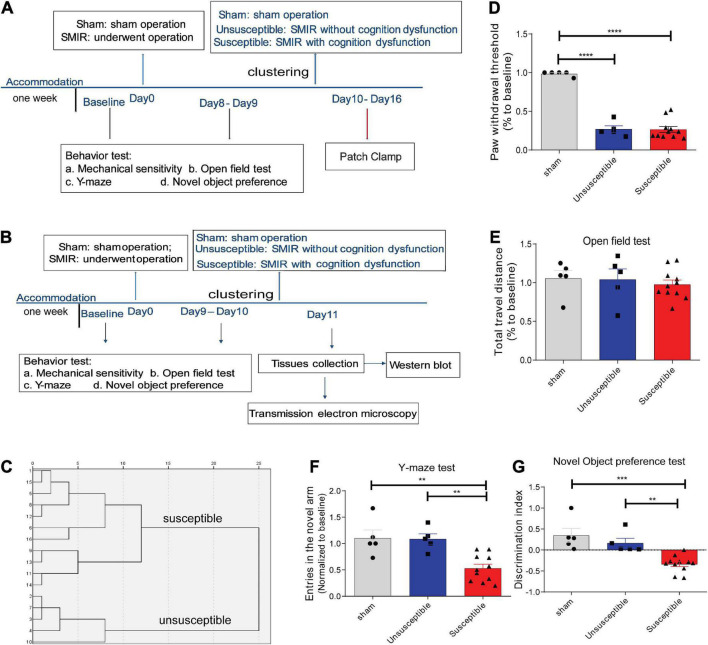
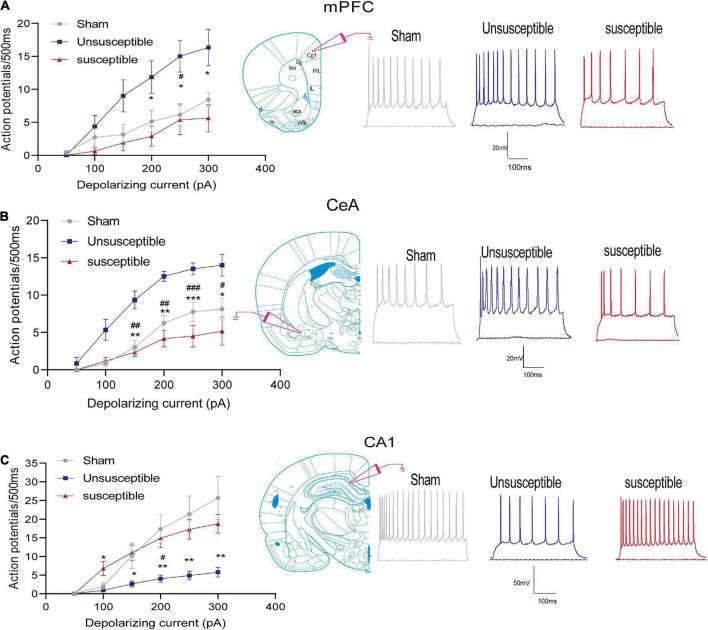
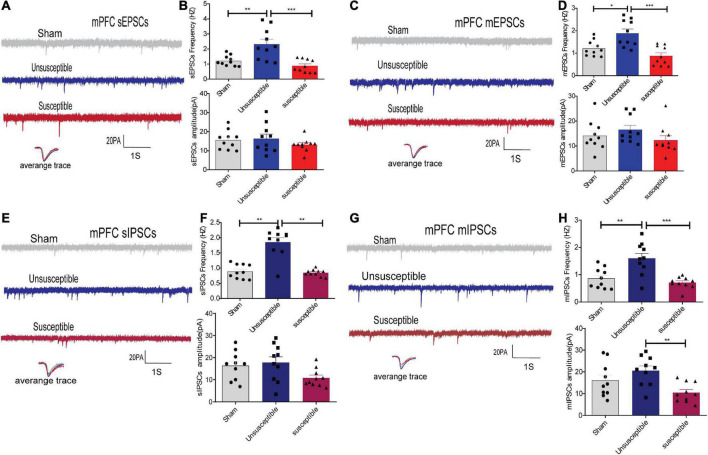
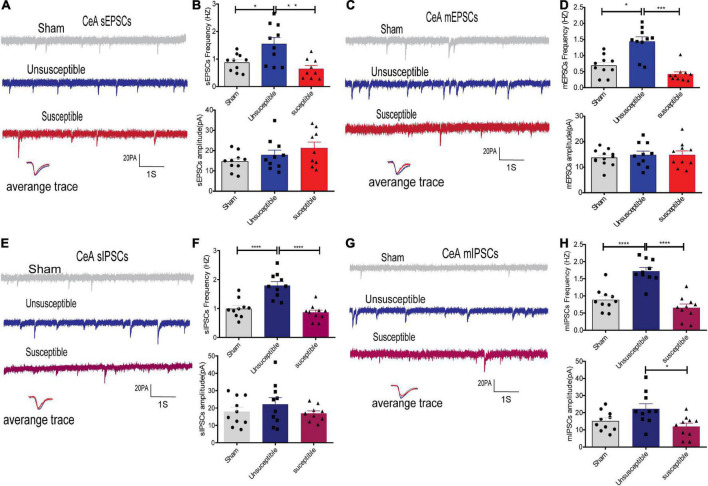
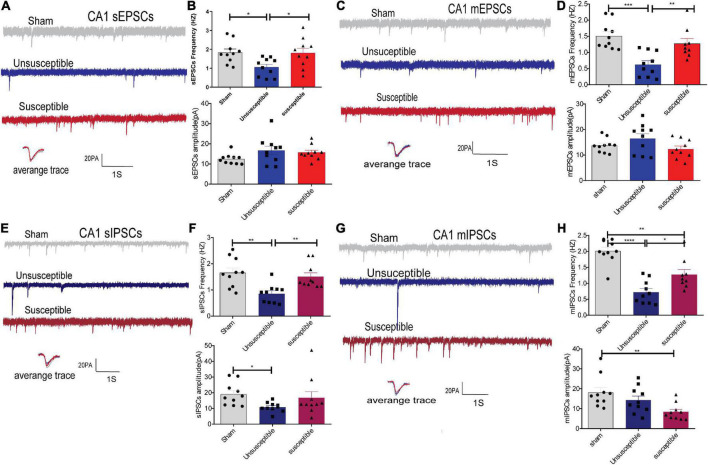
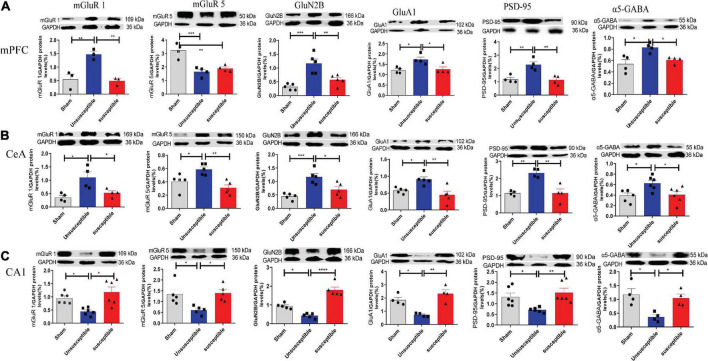
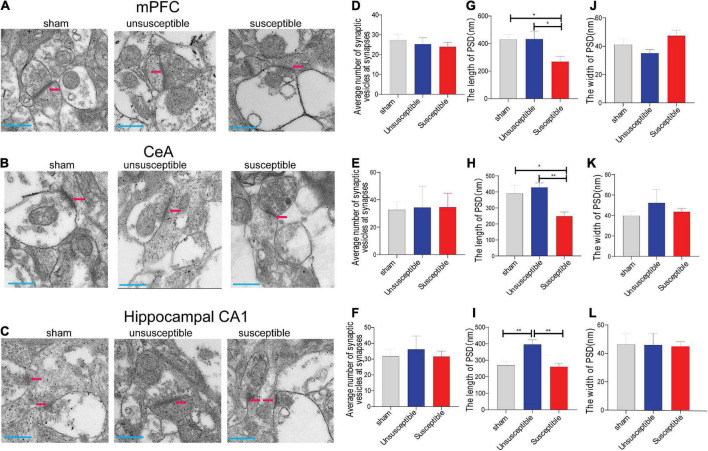
Chronic Postsurgical Pain (CPSP) is well recognized to impair cognition, particularly memory. Mounting evidence suggests anatomic and mechanistic overlap between pain and cognition on several levels. Interestingly, the drugs currently used for treating chronic pain, including opioids, gabapentin, and NMDAR (N-methyl-D-aspartate receptor) antagonists, are also known to impair cognition. So whether pain-related cognitive deficits have different synaptic mechanisms as those underlying pain remains to be elucidated. In this context, the synaptic transmission in the unsusceptible group (cognitively normal pain rats) was isolated from that in the susceptible group (cognitively compromised pain rats). It was revealed that nearly two-thirds of the CPSP rats suffered cognitive impairment. The whole-cell voltage-clamp recordings revealed that the neuronal excitability and synaptic transmission in the prefrontal cortex and amygdala neurons were enhanced in the unsusceptible group, while these parameters remained the same in the susceptible group. Moreover, the neuronal excitability and synaptic transmission in hippocampus neurons demonstrated the opposite trend. Correspondingly, the levels of synaptic transmission-related proteins demonstrated a tendency similar to that of the excitatory and inhibitory synaptic transmission. Furthermore, morphologically, the synapse ultrastructure varied in the postsynaptic density (PSD) between the CPSP rats with and without cognitive deficits. Together, these observations indicated that basal excitatory and inhibitory synaptic transmission changes were strikingly different between the CPSP rats with and without cognitive deficits.

Keywords: chronic postsurgical pain; cognitive function; excitatory postsynaptic currents (EPSCs); inhibitory postsynaptic synaptic currents (IPSCs); postsynaptic density.


Conflict of interest statement

The authors declare that the research was conducted in the absence of any commercial or financial relationships that could be construed as a potential conflict of interest.

Figures

FIGURE 1
FIGURE 1
SMIR-induced significant mechanical hypersensitivity and cognitive impairment in rats. (A,B) Schematic illustration of the design of the complete experiment. (C) Dendrogram of the hierarchical clustering analysis. The rats who underwent the SMIR surgery were divided into the susceptible group (CPSP rats with cognitive dysfunction, n = 11) and the unsusceptible group (CPSP rats without cognitive dysfunction, n = 5) according to the hierarchical clustering analysis of the data from the Y-maze test and the novel object preference test. (D–G) Behavioral test after SMIR surgery, including (D) mechanical sensitivity (F = 90.07, p < 0.0001), (E) the open field test (F = 0.28, p = 0.76), (F) the Y-maze (F = 11.40, p = 0.0006), (G) the novel object preference test (F = 14.21, p = 0.0002). Results are expressed as mean ± SEM; Tukey’s post-hoc tests; **p < 0.01, ***p < 0.001, ****p < 0.0001.
FIGURE 2
FIGURE 2
Neuronal excitability in the mPFC, hippocampus, and CeA pyramidal neurons after the SMIR surgery. Graphs present the mean frequency of AP (action potential) fired in response to the 500 ms current injection ranging from 0 to 300 pA (left). Traces present the potential firings evoked by the 500 ms depolarizing current steps of 300 pA (right). (A) Quantification of the AP firing frequencies in the anterior cingulate cortex of the mPFC neurons; N = 5 rats/group, F = 30.64, p < 0.0001. (B) Quantification of the AP firing frequencies in the CeA neurons; N = 5 rats/group, F = 18.16, p < 0.0001. (C) Quantification of the AP firing frequencies in the hippocampal CA1 neurons; N = 5 rats/group, F = 8.27, p = 0.0026. Statistical significance was determined by two-way ANOVA followed by Bonferroni’s post-hoc test. Sham vs. Unsusceptible, #p < 0.05, ##p < 0.01, ###p < 0.001; Unsusceptible vs. Susceptible, *p < 0.05, **p < 0.01, ***p < 0.001.
FIGURE 3
FIGURE 3
Apparent discrepancies in the synaptic transmissions in the anterior cingulate cortex of mPFC pyramidal neurons between the CPSP rats with and without cognitive deficits. (A,C) A typical time-course with traces of sEPSCs/mEPSCs in the individual slices from three groups of rats (above) and the individual traces (average) of sEPSCs/mEPSCs obtained from the corresponding recordings (bottom). Calibration: 20 pA. (B,D) Bar graphs presenting the frequencies and amplitudes of the sEPSCs/mEPSCs. sEPSCs (frequency: one-way ANOVA, F = 12.29, P = 0.0002; amplitude: one-way ANOVA, F = 0.94, P = 0.40), mEPSCs (frequency: one-way ANOVA, F = 11.98, P = 0.0002; amplitude: one-way ANOVA, F = 1.38, P = 0. 27). (E,G) Representative sIPSCs/mIPSCs in the pyramidal neurons recorded from the three groups of rats (above) and the individual traces (average) of sIPSCs/mIPSCs obtained from the corresponding recordings (bottom). Calibration: 20 pA. (F,H) Bar graphs presenting the frequencies and amplitudes of sIPSCs/mIPSCs. sIPSCs (frequency: Kruskal-Wallis test, P = 0.0009; amplitude: one-way ANOVA, F = 3.21, P = 0.06), mIPSCs (frequency: one-way ANOVA, F = 12.86, P = 0.0001; amplitude: one-way ANOVA, F = 6.16, P = 0.006). Results are expressed as mean ± SEM; n = 10 neurons from 5 rats/group; Tukey’s post-hoc tests; *p < 0.05, **p < 0.01, ***p < 0.001 (compared to sham and unsusceptible groups, respectively).
FIGURE 4
FIGURE 4
Evident differences in the synaptic transmission from the CeA pyramidal neurons between the cognitively normal and cognitively compromised pain rats. (A,C) Sample recordings of sEPSCs/mEPSCs in the individual slices from the three groups (above) and the individual traces (average) of sEPSCs/mEPSCs obtained from the corresponding recordings (bottom). Calibration: 20 pA. (B,D) Bar graphs presenting the frequencies and amplitudes of sEPSCs/mEPSCs. sEPSCs (frequency: one-way ANOVA, F = 8.46, P = 0.002; amplitude: one-way ANOVA, F = 2.02, P = 0.15), mEPSCs (frequency: Kruskal-Wallis test, P = 0.0002; amplitude: one-way ANOVA, F = 0.24, P = 0. 79). (E,G) Representative sIPSCs/mIPSCs in the pyramidal neurons from the three groups (above) and the individual traces (average) of sIPSCs/mIPSCs obtained from the corresponding recordings (bottom). Calibration: 20 pA. (F,H) Bar graphs presenting the frequencies and amplitudes of the sIPSCs/mIPSCs. sIPSCs (frequency: one-way ANOVA, F = 21.48, P < 0.0001; amplitude: one-way ANOVA, F = 0.98, P = 0.39), mIPSCs (frequency: one-way ANOVA, F = 28.23, P < 0.0001; amplitude: one-way ANOVA, F = 5.13, P = 0.01). Results are expressed as mean ± SEM; n = 10 neurons from 5 rats/group; Tukey’s post-hoc tests; *p < 0.05, **p < 0.01, ***p < 0.001, ****p < 0.001 (compared to sham and unsusceptible groups, respectively).
FIGURE 5
FIGURE 5
CPSP rats with and without cognitive deficits exhibited marked differences in the synaptic transmissions in hippocampal CA1 pyramidal neurons. (A,C) A typical time-course with traces showing a continuous recording of sEPSCs/mEPSCs taken from groups after SMIR surgery. Calibration: 20 pA. (B,D) Bar graphs present the frequencies and amplitude of sEPSCs/mEPSCs. sEPSCs (frequency: one-way ANOVA, F = 4.94, P = 0.01; amplitude: one-way ANOVA, F = 2.31, P = 0.12), mEPSCs (frequency: one-way ANOVA, F = 11.81, P = 0.0002; amplitude: one-way ANOVA, F = 0.41, P = 0. 11). (E,G) Representative sIPSCs/mIPSCs recorded in the CA1 pyramidal neurons from the three groups (above) and the individual traces (average) of sIPSCs/mIPSCs obtained from the corresponding recordings (bottom). Calibration: 20 pA. (F,H) Bar graphs presented the frequencies and amplitudes of sIPSCs/mIPSCs. sIPSCs (frequency: Kruskal-Wallis test, P = 0.0002; amplitude: Kruskal-Wallis test, P = 0.02), mIPSCs (frequency: one-way ANOVA, F = 26.28, P < 0.0001; amplitude: Kruskal-Wallis test, P = 0.004). Results are expressed as mean ± SEM; n = 10 cells from 5 rats/group; Tukey’s post-hoc tests; *p < 0.05, **p < 0.01, ***p < 0.001, ****p < 0.001 (compared to sham and unsusceptible groups, respectively).
FIGURE 6
FIGURE 6
Changes in the levels of mGluR1, mGluR5, GluN2B, GluA1, PSD-95, and α5-GABA in mPFC, CeA, and hippocampus, 11 days after the SMIR surgery. (A) The representative Western blots and quantification of synaptic transmission-related proteins in mPFC. one-way ANOVA, mGluR1 (F = 16.24, P = 0.004), mGluR5 (F = 19.42, P = 0.0005), GluN2B (F = 16.28, P = 0.0004), GluA1 (F = 7.54, P = 0.02), PSD-95 (F = 13.36, P = 0.002), and α5-GABA (F = 8.31, P = 0.009). (B) Changes in the levels of synaptic transmission-related proteins in CeA. one-way ANOVA, mGluR1 (F = 8.23, P = 0.009), mGluR5 (F = 9.72, P = 0.003), GluN2B (F = 13.58, P = 0.0008), GluA1 (F = 9.05, P = 0.004), PSD-95 (F = 16.19, P = 0.001), and α5-GABA (F = 5.74, P = 0.01). (C) Changes in the expression levels of synaptic transmission-related proteins in the hippocampus. one-way ANOVA, mGluR1 (F = 9.03, P = 0.002), mGluR5 (F = 6.85, P = 0.01), GluN2B (F = 44.96, P < 0.0001), GluA1 (F = 15.50, P = 0.001), PSD-95 (F = 7.17, P = 0.006), and α5-GABA (F = 8.26, P = 0.009). Results are expressed as mean ± SEM; Tukey’s post-hoc tests; *p < 0.05, **p < 0.01, ***p < 0.001, ****p < 0.0001; n = 3–6/group.
FIGURE 7
FIGURE 7
Electron microscopic images for the mPFC, CeA, and hippocampus regions after the SMIR surgery. (A–C) Representative synapses of the synapse ultrastructure in the mPFC, CeA, and hippocampus neurons. (D–F) The average number of synaptic vesicles at the synapses (n = 5 slices). one-way ANOVA, mPFC (F = 0.31, P = 0.73), CeA (F = 0.01, P = 0.99), and hippocampus (F = 0.18, P = 0.83). (G–I) The length of PSD (n = 5 slices). one-way ANOVA, mPFC (F = 4.54, P = 0.02), CeA (F = 6.30, P = 0.01), and hippocampus (F = 10.35, P = 0.0005). (J–L) The width of postsynaptic density (PSD) (n = 5 slices). one-way ANOVA, mPFC (F = 2.97, P = 0.07), CeA (F = 0.42, P = 0.66), and hippocampus (F = 0.01, P = 0.99). Scale bar = 500 nm. Results are expressed as mean ± SEM; Tukey’s post-hoc tests; *p < 0.05, **p < 0.01.

Similar articles

Cited by

References

    1. Attal N., Masselin-Dubois A., Martinez V., Jayr C., Albi A., Fermanian J., et al. (2014). Does cognitive functioning predict chronic pain? Results from a prospective surgical cohort. Brain 137 904–917. 10.1093/brain/awt354 - DOI - PubMed
    1. Berry-Kravis E. M., Lindemann L., Jonch A. E., Apostol G., Bear M. F., Carpenter R. L., et al. (2018). Drug development for neurodevelopmental disorders: lessons learned from fragile X syndrome. Nat. Rev. Drug Discov. 17 280–299. 10.1038/nrd.2017.221 - DOI - PMC - PubMed
    1. Berryman C., Stanton T. R., Jane Bowering K., Tabor A., McFarlane A., Lorimer Moseley G. (2013). Evidence for working memory deficits in chronic pain: a systematic review and meta-analysis. Pain 154 1181–1196. 10.1016/j.pain.2013.03.002 - DOI - PubMed
    1. Blom S. M., Pfister J. P., Santello M., Senn W., Nevian T. (2014). Nerve injury-induced neuropathic pain causes disinhibition of the anterior cingulate cortex. J. Neurosci. 34 5754–5764. 10.1523/JNEUROSCI.3667-13.2014 - DOI - PMC - PubMed
    1. Bravo-Hernandez M., Corleto J. A., Barragan-Iglesias P., Gonzalez-Ramirez R., Pineda-Farias J. B., Felix R., et al. (2016). The alpha5 subunit containing GABAA receptors contribute to chronic pain. Pain 157 613–626. 10.1097/j.pain.0000000000000410 - DOI - PMC - PubMed

LinkOut - more resources