

Identifying hub genes and miRNAs in Crohn's disease by bioinformatics analysis
- PMID: 36118873
- PMCID: PMC9471261
- DOI: 10.3389/fgene.2022.950136
Identifying hub genes and miRNAs in Crohn's disease by bioinformatics analysis
Abstract
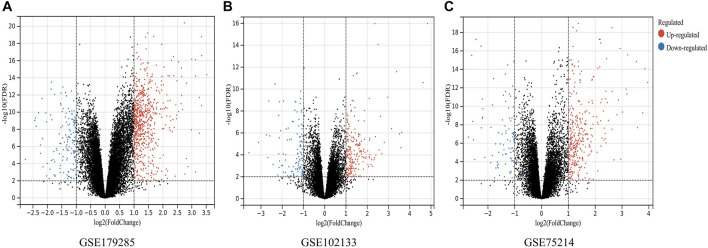
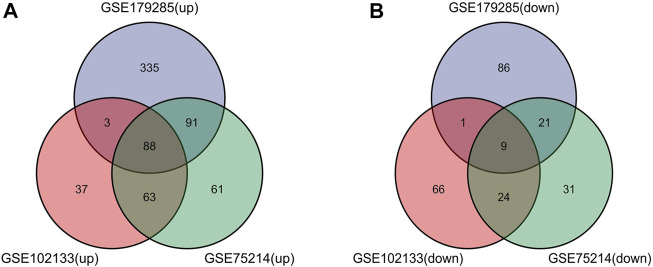
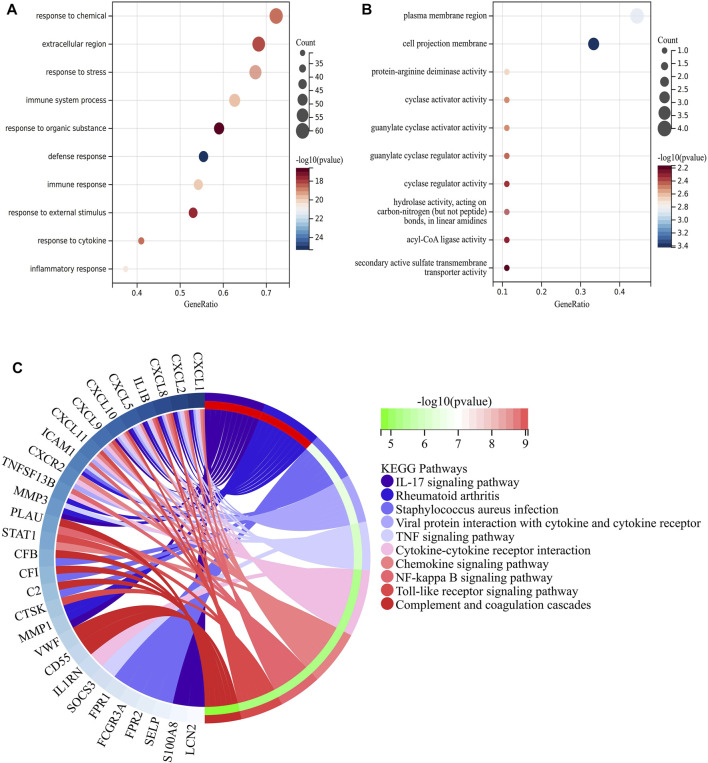
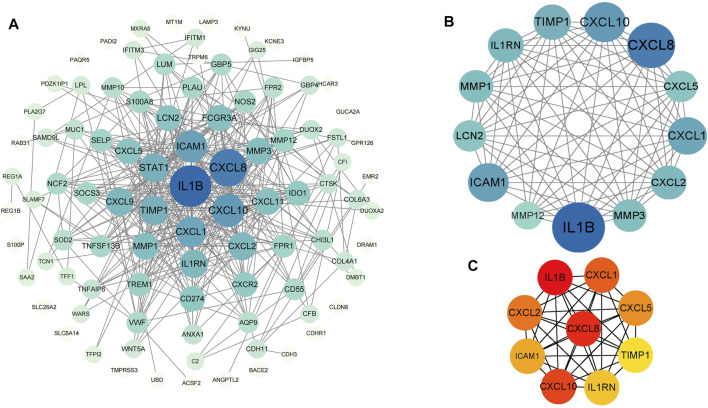
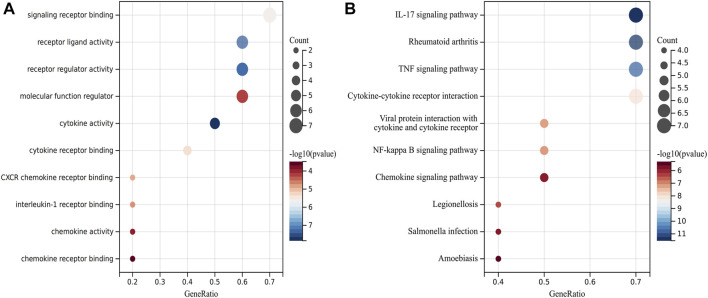
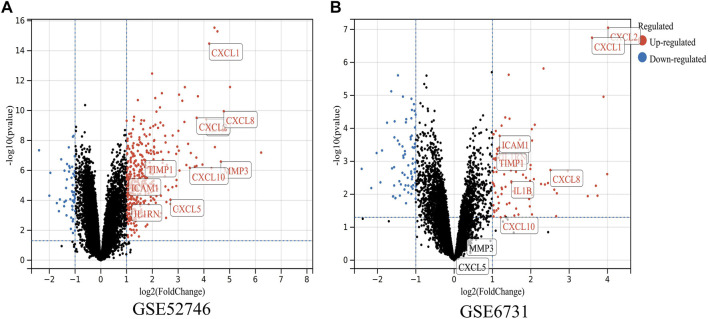
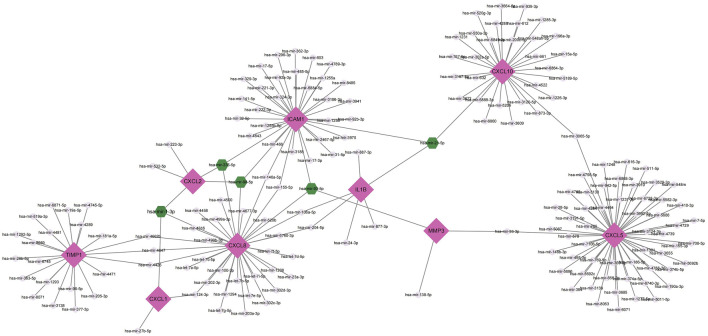
Introduction: Crohn's disease (CD) is a disease that manifests mainly as chronic inflammation of the gastrointestinal tract, which is still not well understood in terms of its pathogenesis. The aim of this study was to use bioinformatics analysis to identify differentially expressed genes (DEGs) and miRNAs with diagnostic and therapeutic potential in CD. Materials and methods: Three CD datasets (GSE179285, GSE102133, GSE75214) were downloaded from the Gene Expression Omnibus (GEO) database. DEGs between normal and CD tissues were identified using the GEO2R online tool. The Gene Ontology (GO) term and Kyoto Encyclopedia of Genes and Genomes (KEGG) pathway enrichment analyses of the DEGs were conducted using the clusterProfiler function in the R package. Protein-protein interaction network (PPI) analysis and visualization were performed with STRING and Cytoscape. Ten hub genes were identified using cytoHubba's MCC algorithm and validated with datasets GSE6731 and GSE52746. Finally, the miRNA gene regulatory network was constructed by Cytoscape and NetworkAnalyst to predict potential microRNAs (miRNAs) associated with DEGs. Results: A total of 97 DEGs were identified, consisting of 88 downregulated genes and 9 upregulated genes. The enriched functions and pathways of the DEGs include immune system process, response to stress, response to cytokine and extracellular region. KEGG pathway analysis indicates that the genes were significantly enriched in Cytokine-cytokine receptor interaction, IL-17 signaling pathway, Rheumatoid arthritis and TNF signaling pathway. In combination with the results of the protein-protein interaction (PPI) network and CytoHubba, 10 hub genes including IL1B, CXCL8, CXCL10, CXCL1, CXCL2, CXCL5, ICAM1, IL1RN, TIMP1 and MMP3 were selected. Based on the DEG-miRNAs network construction, 5 miRNAs including hsa-mir-21-5p, hsa-mir-93-5p, hsa-mir-98-5p, hsa-mir-1-3p and hsa-mir-335-5p were identified as potential critical miRNAs. Conclusion: In conclusion, a total of 97 DEGs, 10 hub genes and 5 miRNAs that may be involved in the progression or occurrence of CD were identified in this study, which could be regarded as biomarkers of CD.
Keywords: Crohn’s disease; MicroRNAs; bioinformatics analysis; differentially expressed genes; hub genes.
Copyright © 2022 Sun, Cai, Hu and Fang.
Conflict of interest statement
The authors declare that the research was conducted in the absence of any commercial or financial relationships that could be construed as a potential conflict of interest.
Figures
Similar articles
-
Identification of Differentially Expressed Genes and miRNAs for Ulcerative Colitis Using Bioinformatics Analysis.Front Genet. 2022 Jun 2;13:914384. doi: 10.3389/fgene.2022.914384. eCollection 2022. Front Genet. 2022. PMID: 35719390 Free PMC article.
-
Study on potential differentially expressed genes in stroke by bioinformatics analysis.Neurol Sci. 2022 Feb;43(2):1155-1166. doi: 10.1007/s10072-021-05470-1. Epub 2021 Jul 27. Neurol Sci. 2022. PMID: 34313877 Free PMC article.
-
Three hematologic/immune system-specific expressed genes are considered as the potential biomarkers for the diagnosis of early rheumatoid arthritis through bioinformatics analysis.J Transl Med. 2021 Jan 6;19(1):18. doi: 10.1186/s12967-020-02689-y. J Transl Med. 2021. PMID: 33407587 Free PMC article.
-
Common gene signatures and key pathways in hypopharyngeal and esophageal squamous cell carcinoma: Evidence from bioinformatic analysis.Medicine (Baltimore). 2020 Oct 16;99(42):e22434. doi: 10.1097/MD.0000000000022434. Medicine (Baltimore). 2020. PMID: 33080677 Free PMC article.
-
Meta-analysis of transcriptomics data identifies potential biomarkers and their associated regulatory networks in gallbladder cancer.Gastroenterol Hepatol Bed Bench. 2022;15(4):311-325. doi: 10.22037/ghfbb.v15i4.2292. Gastroenterol Hepatol Bed Bench. 2022. PMID: 36762219 Free PMC article. Review.
Cited by
-
Identification and validation of shared biomarkers and drug repurposing in psoriasis and Crohn's disease: integrating bioinformatics, machine learning, and experimental approaches.Front Immunol. 2025 May 8;16:1587705. doi: 10.3389/fimmu.2025.1587705. eCollection 2025. Front Immunol. 2025. PMID: 40406126 Free PMC article.
-
Fecal miRNA Profiling of Yorkshire Terrier Enteropathy.Int J Mol Sci. 2025 Apr 4;26(7):3385. doi: 10.3390/ijms26073385. Int J Mol Sci. 2025. PMID: 40244288 Free PMC article.
-
Identification of the key miRNA-mRNA regulatory network in lung adenocarcinoma.J Thorac Dis. 2023 Apr 28;15(4):2037-2050. doi: 10.21037/jtd-23-400. Epub 2023 Apr 27. J Thorac Dis. 2023. PMID: 37197496 Free PMC article.
-
Integrated multiple microarray studies by robust rank aggregation to identify immune-associated biomarkers in Crohn's disease based on three machine learning methods.Sci Rep. 2023 Feb 15;13(1):2694. doi: 10.1038/s41598-022-26345-1. Sci Rep. 2023. PMID: 36792688 Free PMC article.
-
Validation of Biomarkers and Immunotherapy With Crohn's Disease Using WGCNA and Two-Sample Mendelian Randomization Study.Gastroenterol Res Pract. 2025 Jul 1;2025:8194480. doi: 10.1155/grp/8194480. eCollection 2025. Gastroenterol Res Pract. 2025. PMID: 40630894 Free PMC article.
References
-
- Bandettini W. P., Kellman P., Mancini C., Booker O. J., Vasu S., Leung S. W., et al. (2012). MultiContrast Delayed Enhancement (MCODE) Improves Detection of Subendocardial Myocardial Infarction by Late Gadolinium Enhancement Cardiovascular Magnetic Resonance: a Clinical Validation Study. J. Cardiovasc. Magn. Reson. 14, 83. 10.1186/1532-429X-14-83 - DOI - PMC - PubMed
LinkOut - more resources
Full Text Sources
Research Materials
Miscellaneous